Clinical Trial
. 2016 Oct 28;9(1):115.
doi: 10.1186/s13045-016-0346-2.

Integrating a prospective pilot trial and patient-derived xenografts to trace metabolic changes associated with acute myeloid leukemia

Affiliations
Clinical Trial

Integrating a prospective pilot trial and patient-derived xenografts to trace metabolic changes associated with acute myeloid leukemia

Matteo G Carrabba et al. J Hematol Oncol. .

Abstract

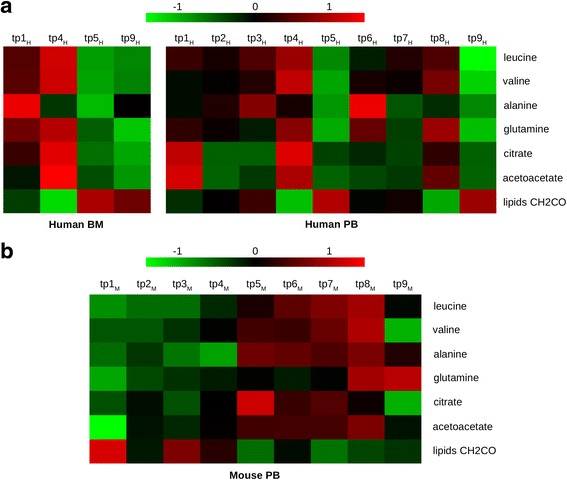
Despite the considerable progress in understanding the molecular bases of acute myeloid leukemia (AML), new tools to link disease biology to the unpredictable patient clinical course are still needed. Herein, high-throughput metabolomics, combined with the other "-omics" disciplines, holds promise in identifying disease-specific and clinically relevant features.In this study, we took advantage of nuclear magnetic resonance (NMR) to trace AML-associated metabolic trajectory employing two complementary strategies. On the one hand, we performed a prospective observational clinical trial to identify metabolic changes associated with blast clearance during the first two cycles of intensive chemotherapy in nine adult patients. On the other hand, to reduce the intrinsic variability associated with human samples and AML genetic heterogeneity, we analyzed the metabolic changes in the plasma of immunocompromised mice upon engraftment of primary human AML blasts.Combining the two longitudinal approaches, we narrowed our screen to seven common metabolites, for which we observed a mirror-like trajectory in mice and humans, tracing AML progression and remission, respectively. We interpreted this set of metabolites as a dynamic fingerprint of AML evolution.Overall, these NMR-based metabolomic data, to be consolidated in larger cohorts and integrated in more comprehensive system biology approaches, hold promise for providing valuable and non-redundant information on the systemic effects of leukemia.

Keywords: Acute myeloid leukemia; Metabolomics; Nuclear magnetic resonance; Patient-derived xenografts.


Figures

Fig. 1
Fig. 1
Metabolic changes in AML patients undergoing intensive chemotherapy. a Patient characteristics. CR1 first complete remission. *UPN#1 developed a lethal fungal pneumonia while in remission after the first consolidation CT cycle. **UPN#3 underwent allogeneic hematopoietic stem cell transplantation in CR1 and subsequently relapsed. b Outline of the study design. c Superposition of representative 1H Carr-Purcell-Meiboom-Gill (CPMG) spectra of BM at tp1H (black line) and tp9H (red line) acquired at 37 °C on a Bruker Avance 600-MHz spectrometer. The 1H CPMG NMR experiment is based on a pulse sequence that strongly reduces the NMR signals deriving from large molecules; herewith, molecules with high molecular weight are essentially invisible in the 1H spectrum, thus facilitating spectra interpretation and small molecule identification in the presence of large proteins and lipoproteins. Peaks correspond to the different metabolites: 1—high-, low-, and very low-density lipoproteins (HDL, LDL, VLDL) CH3; 2—isoleucine; 3—leucine; 4—valine; 5—3-aminoisobutyrate; 6—3-hydroxybutyrate; 7—LDL/VLDL CH2; 8—lactate; 9—alanine; 10—lipids CH2CH2CO; 11—acetate; 12—lipids CH2C=C; 13—N-acetyl-glycoproteins (NAG) NHCOCH3; 14—glutamine; 15—lipids CH2CO; 16—acetoacetate; 17—citrate; 18—lipids C=CCH2C=C; 19—creatinine; 20—creatine; 21—creatine phosphate; 22—glucose; 23—glycerol of lipids CHOCOR; 24—α glucose; 25—poly-unsaturated fatty acids (UFA); 26—tyrosine; 27—phenylalanine; 28—histidine; 29—formate. d OPLS-DA score plot for pooled PB and BM samples collected at diagnosis and typing positive (blue circles; n = 6) or negative (green circles; n = 12) for missense mutations in the IDH1/2 genes. OPLS-DA with N = 18, CV ANOVA p = 0.059, R 2 = 0.93, and Q 2 = 0.615. The area under the curve (AUC) of the ROC analysis was 0.86 (p < 0.001). e Metabolites discriminating AML patients with or without IDH gene mutations. Loadings indicate how much the variables, i.e., the metabolites, contribute to the model. Shown are loadings with jack-knifed confidence interval. The metabolites significantly contributing to the model were selected based on variable importance in projection >1 and jack-knifed confidence interval of loadings not crossing the zero line. Positive loading values (blue bars) indicate the metabolites increased in patients with mutated IDH, while negative values (green bars) are associated with increased levels in patients with wild-type IDH. Note that the concentration levels of the classical IDH mutation oncometabolite (R)-2-hydroxyglutarate were below the NMR detection limit and that because of the overlap of the resonances associated to CH2 groups of high-, low- and very low-density lipoproteins (HDL, LDL, VLDL) and the CH2C=C groups of different lipid molecules it was not possible to establish their specific contribution to the model. f OPLS-DA score plot for pooled PB and BM samples of patients at diagnosis (tp1H, blue circles; n = 18) vs remission after chemotherapy (pooling samples after induction, tp5H, and after first consolidation, tp9H, green circles; n = 29). OPLS-DA model with N = 47, CV-ANOVA p = 0.006, R 2 = 0.99, and Q 2 = 0.671. The AUC of the ROC analysis was 0.73 (p < 0.001). g Metabolites discriminating AML patients at diagnosis and in remission after chemotherapy. Positive loading values (blue bars) indicate the metabolites increased in AML patients at tp1H, while negative values (green bars) are associated with increased metabolite levels at tp5H + tp9H
Fig. 2
Fig. 2
Metabolic profile of the AML mouse-human model. a Design of the study. b Leukemic cell count (human CD33+, CD45+ values) over time. c OPLS-DA score plot for healthy mice (tp1M and tp2M; green circles; n = 12) vs mice at tp5M and tp6M (blue circles; n = 12) showing an AML metabolic signature at an early stage of AML. OPLS-DA model with N = 24, CV-ANOVA p = 0.002, R 2 = 0.99, and Q 2 = 0.819. The area under the curve (AUC) of the ROC analysis was 0.96 (p < 0.001). d Metabolites discriminating healthy and human AML-engrafted mice. Positive loading values (blue bars) indicate the metabolites increased in AML mice, while negative values (green bars) are associated with increased levels in healthy mice
Fig. 3
Fig. 3
Heat maps of human or mouse plasma tracing the trajectory of the seven metabolites associated with AML evolution in both the patients and mice. a Heat maps of human BM and PB tracing the trajectory of the seven metabolites (averaged normalized metabolite area) associated with AML evolution in both the mice and patients. b Heat map of mouse PB depicting the trajectory of the seven metabolites (averaged normalized metabolite area of the six mice) associated with AML evolution in both the mice and patients. Note that leucine, valine, alanine, citrate, and acetoacetate increased upon AML progression until tp8M and then decreased at tp9M. This reverse effect supported our hypothesis about a metabolic change due to overall systemic failure at a late stage of disease and not to a specific effect of AML

References

    1. Hanahan D, Weinberg RA. Hallmarks of cancer: the next generation. Cell. 2011;144:646–74. doi: 10.1016/j.cell.2011.02.013. - DOI - PubMed
    1. Losman JA, Looper RE, Koivunen P, Lee S, Schneider RK, McMahon C, et al. (R)-2-hydroxyglutarate is sufficient to promote leukemogenesis and its effects are reversible. Science. 2013;339:1621–5. doi: 10.1126/science.1231677. - DOI - PMC - PubMed
    1. McKenney AS, Levine RL. Isocitrate dehydrogenase mutations in leukemia. J Clin Invest. 2013;123:3672–7. doi: 10.1172/JCI67266. - DOI - PMC - PubMed
    1. Tiziani S, Lodi A, Khanim FL, Viant MR, Bunce CM, Gunther UL. Metabolomic profiling of drug responses in acute myeloid leukaemia cell lines. PLoS One. 2009;4:e4251. doi: 10.1371/journal.pone.0004251. - DOI - PMC - PubMed
    1. Lodi A, Tiziani S, Khanim FL, Drayson MT, Gunther UL, Bunce CM, et al. Hypoxia triggers major metabolic changes in AML cells without altering indomethacin-induced TCA cycle deregulation. ACS Chem Biol. 2011;6:169–75. doi: 10.1021/cb900300j. - DOI - PMC - PubMed