. 2016:581:105-145.
doi: 10.1016/bs.mie.2016.08.019. Epub 2016 Oct 10.

Quantifying the Assembly of Multicomponent Molecular Machines by Single-Molecule Total Internal Reflection Fluorescence Microscopy

Affiliations

Quantifying the Assembly of Multicomponent Molecular Machines by Single-Molecule Total Internal Reflection Fluorescence Microscopy

E M Boehm et al. Methods Enzymol. 2016.

Abstract

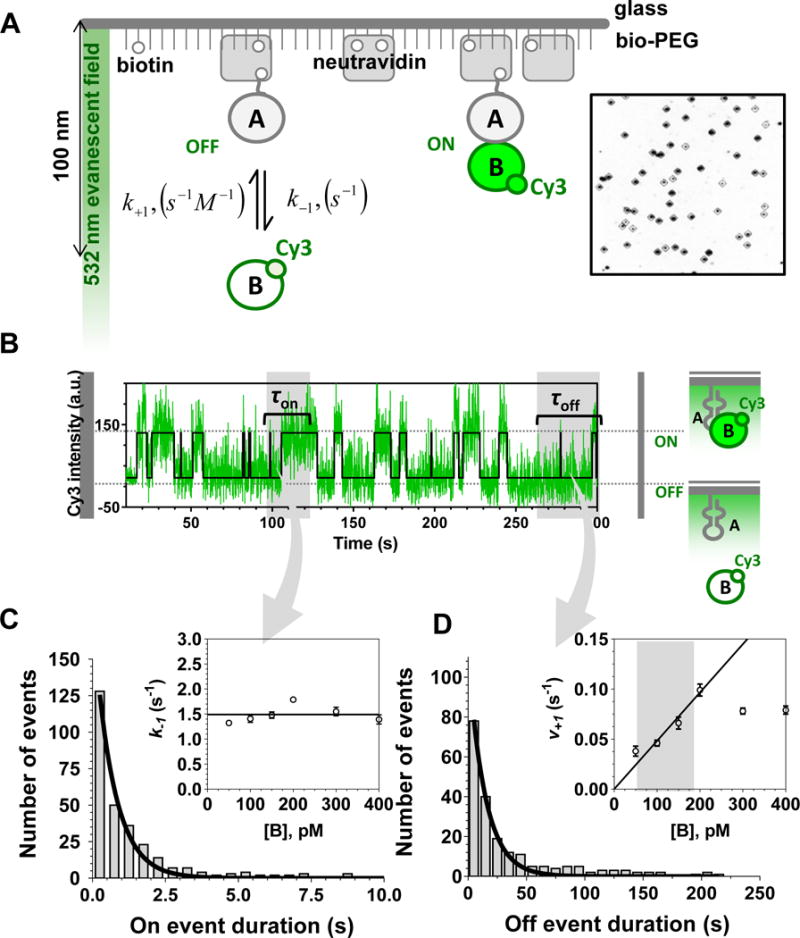
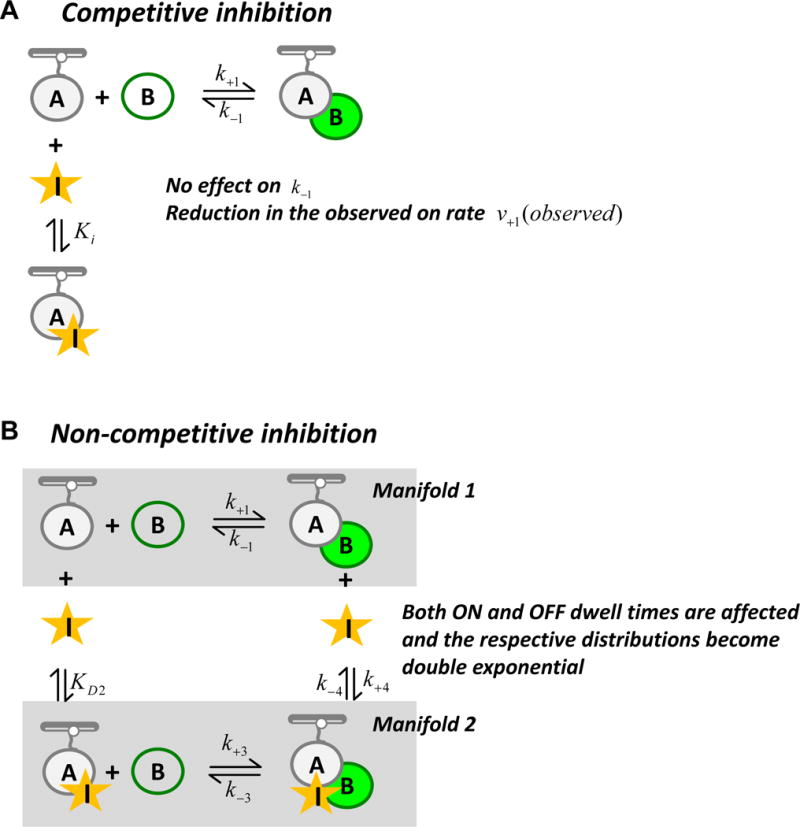
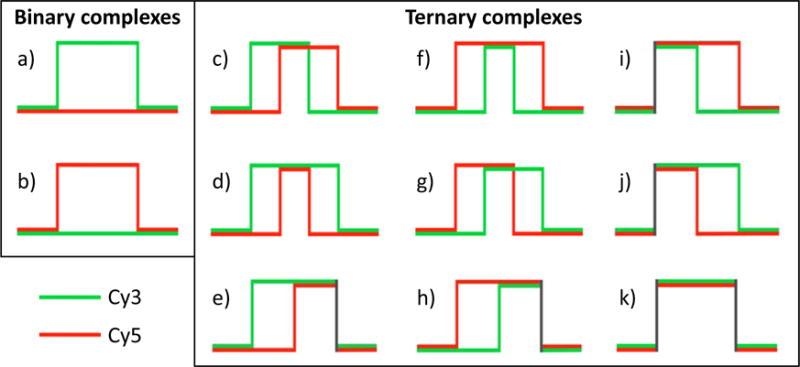
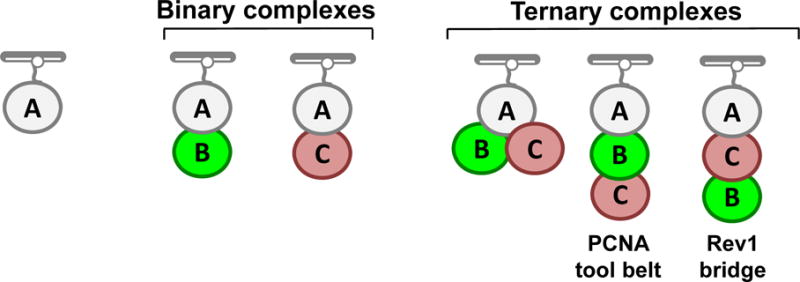
Large, dynamic macromolecular complexes play essential roles in many cellular processes. Knowing how the components of these complexes associate with one another and undergo structural rearrangements is critical to understanding how they function. Single-molecule total internal reflection fluorescence (TIRF) microscopy is a powerful approach for addressing these fundamental issues. In this article, we first discuss single-molecule TIRF microscopes and strategies to immobilize and fluorescently label macromolecules. We then review the use of single-molecule TIRF microscopy to study the formation of binary macromolecular complexes using one-color imaging and inhibitors. We conclude with a discussion of the use of TIRF microscopy to examine the formation of higher-order (i.e., ternary) complexes using multicolor setups. The focus throughout this article is on experimental design, controls, data acquisition, and data analysis. We hope that single-molecule TIRF microscopy, which has largely been the province of specialists, will soon become as common in the tool box of biophysicists and biochemists as structural approaches have become today.

Keywords: Colocalization single-molecule imaging; Competitive and noncompetitive inhibition; Kinetic event resolving algorithm; Protein–protein and protein–nucleic acid interaction; Single-molecule fluorescence; Total internal reflection fluorescence microscopy.


Figures

Fig. 1
Fig. 1. Experimental Scheme for the TIRFM-enabled single-molecule binding experiment
A. The evanescent wave generated by the TIR penetrates the reaction chamber to approximately 100 nm. The biotinylated macromolecules (A) are tethered to the surface of the passified, PEGylated microscope slide via interaction with the neutravidin, which bridges them with the sparsely biotinylated PEG. The Cy3-labeled molecule (B) is then flown into the reaction chamber and the recording is initiated. Formation of the AB complex (governed by the association rate constant k+1 and the concentration of freely diffusing B) brings the Cy3-labeled B in the evanescent filed, which excites the dye. Decomposition of the AB complex (governed by the dissociation rate constant k−1) leads to diffusion of B away from the evanescent field and in disappearance of the fluorescence signal. The inset shows a part of the camera field of view with dark spots corresponding to the points on the slide where the molecules are tethered and complexes are being formed during the experiment. B. A representative fluorescence trajectory shows the evolution of the Cy3 signal in one of the spots on the slide. Raw data are shown in green overlaid with the idealized trajectory shown as a black line. High Cy3 signal corresponds to the AB complex (τon is the “ON” dwell time for the event), while the background fluorescence corresponds to the unbound A (and the corresponding “OFF” dwell time τoff). The dark grey rectangles in the beginning and at the end of the trajectory indicate the events excluded from the analysis. C. Fitting of the dwell time distribution constructed from all “ON” dwell times with single exponential function provides the dissociation rate constant k−1, which is independent of the concentration of B (inset). D. Fitting of the dwell time distribution constructed from all “OFF” dwell times with single exponential function provides the association rate v+1, which increases with increasing concentration of B until reaching saturation (inset). The range of the concentrations useful for calculating the association rate constant k+1 is marked by the grey rectangle in the inset. The data in this figure are adapted with permission from (Haghighat Jahromi et al., 2013).
Fig. 2
Fig. 2. Construction and analysis of the dwell time distributions
The data in this figure are adapted with permission from (Chen et al., 2016). A. A histogram of the 469 individual “OFF” dwell times for the complex formation between the surface-tethered RPA protein and a Cy3-labeled 30-mer ssDNA constructed using 10 seconds bins (grey bars) is fitted with a single-exponential function (black line). B. The residuals from the fit shown in A display a symmetric scatter around zero. C. The same data set was binned with varying bin size and fitted with single exponential function. The resulting association rate is plotted as a function of bin size. It remains the same between the minimal reasonable bin size of 200 milliseconds to about 20 seconds. Larger bin size combines most of the data in a very few bins (the half-life for this process is around 55 seconds) and consequently to an erroneous determination of the rate. The grey rectangle suggests the optimal bin size range. D. The same data are plotted on the logarithmic scale. E. A histogram of the 566 individual “ON” dwell times for the RPA-ssDNA constructed using 1 second bins (grey bars) is fitted with a single-exponential function (black dashed line) and double exponential (grey continuous line). F. The residuals from the single-exponential fit shown in D display a systematic deviation from zero. G. The residuals from the double-exponential fit display a symmetric scatter around zero and are much tighter. H. The same data are plotted on the logarithmic scale clearly reveal that the process is indeed a double exponential. The grey rectangle shows the values missing due to the slow sampling rate.
Fig. 3
Fig. 3. Single-molecule analysis of the binary macromolecular interactions in the presence of unlabeled inhibitors
A. Competitive inhibition. The experimental scheme is essentially the same as in the single-molecule analysis of binary interaction. The inhibitor that interacts with A is depicted as a star. Ki is the equilibrium inhibition constant. B. Non-competitive inhibition. Both A-B and A-B-I complexes are observed.
Fig. 4
Fig. 4. Single-molecule analysis of ternary macromolecular complexes
The data in this figure are adapted with permission from (Boehm, 2016) A, Sample fluorescence trajectory shows the evolution of the Cy3 (green) and Cy5 (red) signals in one of the spots on the slide. High Cy3 signal corresponds to the PCNA binding to the immobilized pol η molecule. High Cy5 signal represents Rev1 bound to the immobilized pol η. The five binding events are indicated. B, The Cy3 and Cy5 signals are separated into two trajectories. C, Idealized Cy3 and Cy5 trajectories are obtained from QuB. D, the idealized Cy3 and Cy5 trajectories are re-combined and analyzed by KERA.
Fig. 5
Fig. 5. Idealized trajectories of binary and ternary complexes
Idealized trajectories of (a) the binary complex between Cy3-labeled PCNA binding to pol η and (b) the binary complex between Cy5-labeled Rev1 binding to pol η. Idealized trajectories of (c) the ternary complex in which Cy3-labeled PCNA binds pol η first and the Cy3-labeled PCNA releases from pol η first, (d) the ternary complex in which Cy3-labeled PCNA binds pol η first and the Cy5-labeled Rev1 releases from pol η first (i.e., the hallmark of a PCNA tool belt), (e) the ternary complex in which Cy3-labeled PCNA binds pol η first and both proteins release from pol η simultaneously, (f) the ternary complex in which Cy5-labeled Rev1 binds pol η first and the Cy3-labeled PCNA releases from pol η first (i.e., the hallmark of a Rev1 bridge), (g) the ternary complex in which Cy5-labeled Rev1 binds pol η first and the Cy5-labeled Rev1 releases from pol η first, (h) the ternary complex in which Cy5-labeled Rev1 binds pol η first and both proteins release from pol η simultaneously, (i) the ternary complex in which both proteins bind pol η simultaneously and Cy3-labeled PCNA releases from η first, (j) the ternary complex in which both proteins bind pol η simultaneously and Cy5-labeled Rev1 releases from η first, (k) the ternary complex in which both proteins bind pol η simultaneously and both proteins release from η simultaneously.
Fig. 6
Fig. 6. Types of binary and ternary complexes
Binary complexes are shown between A and B and between A and C. Ternary complexes are shown among A, B, and C. In the first ternary complex (left), B and C both simultaneously bind A. In the second (middle), A directly binds B and B directly binds C, but A does not directly bind C. When A is pol η, B is PCNA, and C is Rev1, this arrangement is a PCNA tool belt. In the third (right) A directly binds C and C directly binds B, but A does not directly bind B. When A is pol η, B is PCNA, and C is Rev1, this arrangement is a Rev1 bridge.

References

    1. ABELSON J, BLANCO M, DITZLER MA, FULLER F, ARAVAMUDHAN P, WOOD M, VILLA T, RYAN DE, PLEISS JA, MAEDER C, GUTHRIE C, WALTER NG. Conformational dynamics of single pre-mRNA molecules during in vitro splicing. Nat Struct Mol Biol. 2010;17:504–12. - PMC - PubMed
    1. AGGARWAL V, HA T. Single-molecule pull-down (SiMPull) for new-age biochemistry: methodology and biochemical applications of single-molecule pull-down (SiMPull) for probing biomolecular interactions in crude cell extracts. Bioessays. 2014;36:1109–19. - PubMed
    1. AKYUZ N, ALTMAN RB, BLANCHARD SC, BOUDKER O. Transport dynamics in a glutamate transporter homologue. Nature. 2013;502:114–8. - PMC - PubMed
    1. AMRUTE-NAYAK M, LAMBECK KA, RADOCAJ A, HUHNT HE, SCHOLZ T, HAHN N, TSIAVALIARIS G, WALTER WJ, BRENNER B. ATP turnover by individual myosin molecules hints at two conformers of the myosin active site. Proc Natl Acad Sci U S A. 2014;111:2536–41. - PMC - PubMed
    1. APPEL MJ, BERTOZZI CR. Formylglycine, a post-translationally generated residue with unique catalytic capabilities and biotechnology applications. ACS Chem Biol. 2015;10:72–84. - PMC - PubMed

Publication types

MeSH terms

LinkOut - more resources