. 2016 Nov 15;45(5):1066-1077.
doi: 10.1016/j.immuni.2016.10.008. Epub 2016 Oct 25.

Immunomodulatory Functions of BTLA and HVEM Govern Induction of Extrathymic Regulatory T Cells and Tolerance by Dendritic Cells

Affiliations

Immunomodulatory Functions of BTLA and HVEM Govern Induction of Extrathymic Regulatory T Cells and Tolerance by Dendritic Cells

Andrew Jones et al. Immunity. .

Abstract

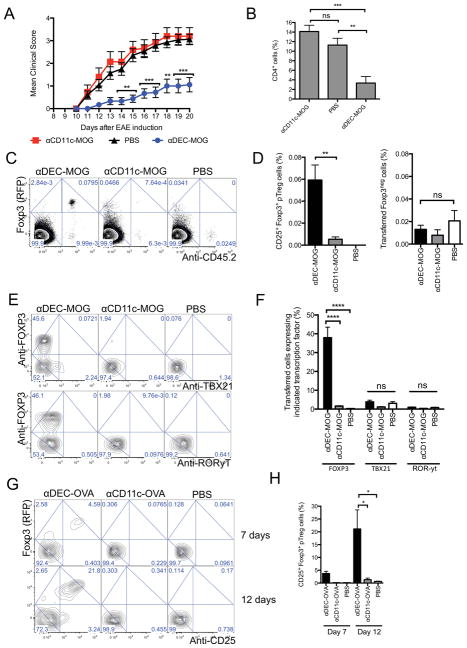
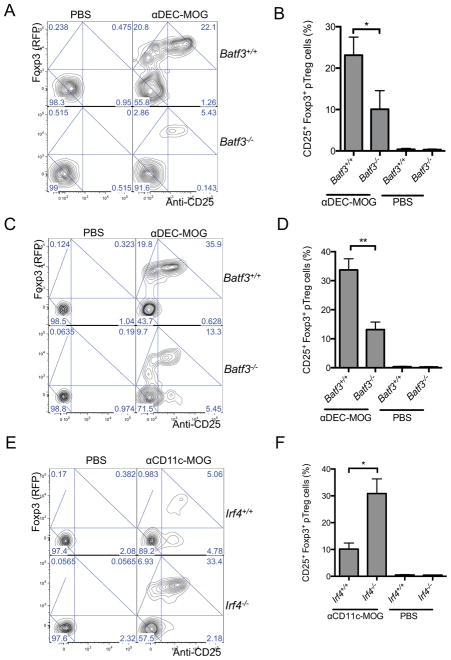
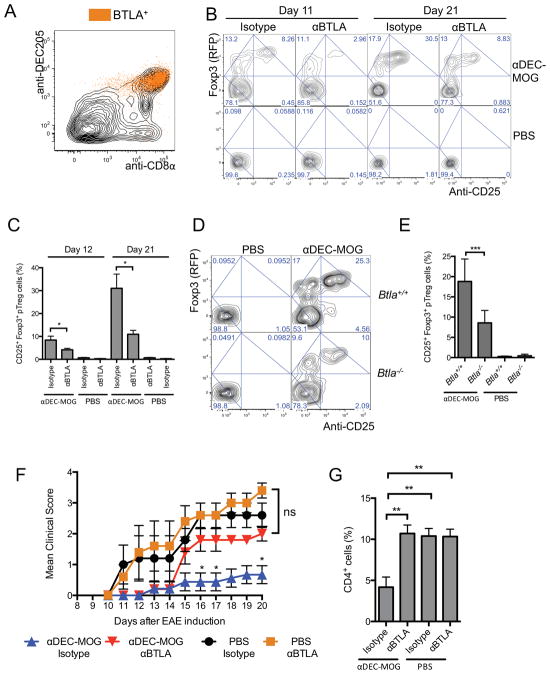
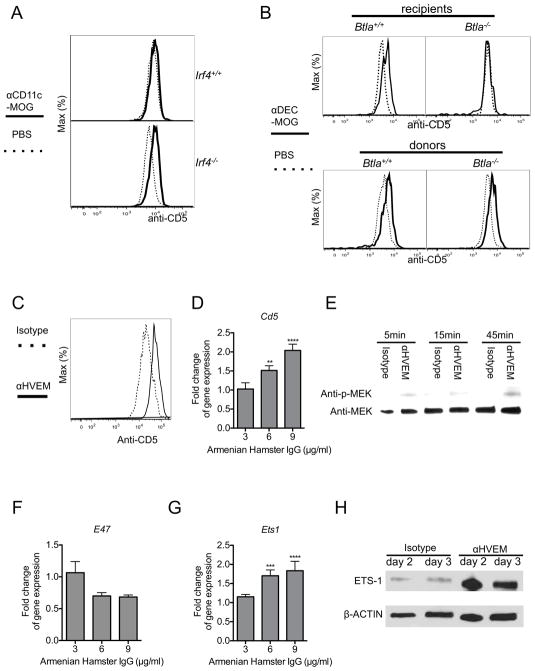
Dendritic cells (DCs) initiate immunity and also antigen-specific tolerance mediated by extrathymic regulatory T (Treg) cells, yet it remains unclear how DCs regulate induction of such tolerance. Here, we report that efficient induction of Treg cells was instructed by BTLA+DEC205+CD8+CD11c+ DCs and the immunomodulatory functions of BTLA. In contrast, T cell activation in steady state by total CD11c+ DCs that include a majority of DCs that do not express BTLA did not induce Treg cells and had no lasting impact on subsequent immune responses. Engagement of HVEM, a receptor of BTLA, promoted Foxp3 expression in T cells through upregulation of CD5. In contrast, T cells activated in the absence of BTLA and HVEM-mediated functions remained CD5lo and therefore failed to resist the inhibition of Foxp3 expression in response to effector cell-differentiating cytokines. Thus, DCs require BTLA and CD5-dependent mechanisms to actively adjust tolerizing T cell responses under steady-state conditions.


Figures

Figure 1
Figure 1. Activation of T cells by CD11c+ DCs in steady state has no lasting impact on autoimmune responses (A and B)
Targeting of MOG to all CD11c+ DCs fails to prevent subsequently induced EAE. Mice were treated with chimeric antibodies as indicated 6 weeks before induction of EAE. (A) Graphs show mean EAE disease scores (n=10–20). (B) Results show mean percentages of CD4+ T cells in spinal cords 19 days after EAE induction (n=3–4). (C and D) CD11c+ DCs fail to induce pTreg cells in steady state. Sorted 2D2 Foxp3negCD25neg T cells were adoptively transferred and analyzed by flow cytometry 6 weeks after treatment of recipients with chimeric antibodies as indicated. (C) Plots show Foxp3 (RFP) expression and anti-CD45.2 staining intensity among total CD4+ T cells from splenocytes. (D) Graphs show percentages of remaining Foxp3negCD25neg T cells and converted Foxp3+CD25+ pTreg cells among total CD4+ splenocytes (n=5–7). (E and F) Expression of transcription factors. Mice treated as in (C and D) and analyzed after 2 weeks. (E) Plots show anti-FOXP3 and anti-TBX21 (upper panel) or anti-RORyt (lower panel) intracellular staining intensity in transferred CD4+ T cells among splenocytes. (F) Graphs show percentages of cells that were positively stained for FOXP3, TBX21 and RORyt (n=4). (G and H) CD11c+ DCs fail to induce pTreg cells from T cells of various TCR-specificity. Sorted OTII Foxp3negCD25neg T cells were transferred into recipient mice and analyzed by flow cytometry at indicated days after indicated treatments. (G) Plots show Foxp3 (RFP) expression and anti-CD25 staining intensity in transferred CD4+ T cells from splenocytes. (H) Graphs show percentages of pTreg cells (n=3). (C, E and G) Numbers in quadrants indicate corresponding percentages. Results represent one of two to four similar experiments. (A, B, D, F and H) Graphs show mean +/− standard error of mean (SEM), * P< 0.05, ** P< 0.01 ***, P< 0.001 and **** P< 0.0001 determined by one-way or two-way ANOVA, n = number of mice per group from two to four independent experiments. Please see also Figure S1.
Figure 2
Figure 2. DEC205+CD8+ DCs mediate induction of pTreg cells
(A–D) Batf3-dependent DCs are required for pTreg cell induction. Sorted 2D2 Foxp3negCD25neg T cells were adoptively transferred into Batf3+/+ and Batf3−/− recipient mice that were treated as indicated. Plots show Foxp3 (RFP) expression and anti-CD25 staining intensity in transferred CD4+ T cells from splenocytes analyzed by flow cytometry after 12 days (A) or 21 days (C). Graphs show percentages of pTreg cells (n=4–5) after 12 days (B) or 21 days (D). (E and F) Conversion of pTreg cells depends on the proportion of the DEC205+CD8+ DCs among CD11c+ DCs. Cells as in (A) were transferred into Irf4−/− and Irf4+/+ recipient mice treated as indicated. (E) Plots show Foxp3 (RFP) expression and anti-CD25 staining intensity in transferred CD4+ T cells from splenocytes analyzed by flow cytometry after 21 days. (F) Graphs show percentages of pTreg cells (n=9–11). (A, C and E) Numbers in quadrants indicate corresponding percentages. Results represent one of three to four similar experiments. (B, D and F) graphs show mean +/− SEM, * P< 0.05 and ** P< 0.01 determined by one-way ANOVA, n = number of mice per group from three to four independent experiments. Please see also Figure S2.
Figure 3
Figure 3. BTLA is required for induction of tolerogenic pTreg cells
(A) BTLA is specifically expressed in DEC205+CD8+ DCs. The plot shows anti-DEC205 and anti-CD8α staining intensities analyzed by flow cytometry in splenic CD11c+MHCII+ DCs with superimposed distribution of BTLA+ events. (B and C) Blocking of BTLA reduces DC-mediated pTreg cell conversion. 2D2 Foxp3negCD25neg T cells were transferred into recipient mice treated with chimeric antibodies and αBTLA or isotype control as indicated. (B) Plots show Foxp3 (RFP) expression and anti-CD25 staining intensity in transferred CD4+ T cells from splenocytes analyzed by flow cytometry after 11 and 21 days. (C) Graphs show percentages Foxp3+CD25+ pTreg cells (n=4–5). (D and E) BTLA is required for DC-mediated pTreg cell induction. 2D2 Foxp3negCD25neg T cells were adoptively transferred into Btla+/+ and Btla−/− recipient mice that were treated as indicated. (D) Plots show Foxp3 (RFP) expression and anti-CD25 staining intensity in transferred CD4+ T cells from splenocytes analyzed by flow cytometry after 9 days. (E) Graphs show percentages of pTreg cells (n=4–6). (F and G) Blocking of BTLA abolishes DC-induced tolerance against EAE. Mice were treated as indicated and subsequently treated with αBTLA or isotype control 6 weeks before induction of EAE. (F) Graphs show mean EAE disease scores (n=10–20). (G) Results show mean percentages of CD4+ T cells in spinal cords 19 days after EAE induction (n=3–4). (B and D) Numbers in quadrants indicate corresponding percentages. (A, B and D) Results represent one of three similar experiments. (C, E, F and G) Graphs show mean +/− SEM, * P< 0.05, ** P< 0.01 and *** P< 0.001 determined by one-way or two-way ANOVA, n = number of mice per group from two to three independent experiments. Please see also Figure S3.
Figure 4
Figure 4. Upregulation of CD5 in T cells depends on BTLA and HVEM functions
(A) BTLA+DEC205+CD8+CD11c+ DCs increase CD5 expression in T cells in vivo. 2D2 Foxp3negCD25neg T cells were adoptively transferred into Irf4+/+ and Irf4−/− recipient mice treated as indicated. Overlaid histograms show staining intensity with anti-CD5 in transferred Foxp3neg T cells among splenocytes analyzed by flow cytometry after 9 days. (B) BTLA is required for DC-mediated upregulation of CD5 in T cells. Upper panel - 2D2 Foxp3negCD25neg T cells were transferred into Btla+/+ and Btla−/− recipient mice that were treated as indicated. Lower panel - Btla+/+ and Btla−/− 2D2 Foxp3negCD25neg T cells were transferred into recipient mice that were treated as indicated. Overlaid histograms show staining intensity with anti-CD5 in transferred Foxp3neg CD4+ T cells among splenocytes analyzed by flow cytometry after 9 days. (C) Engagement of HVEM in T cells induces CD5 upregulation. Naïve 2D2 Foxp3negCD25neg CD4+ T cells were stimulated in vitro for 3 days with αCD3 and αCD28 and in the presence of either αHVEM or isotype control followed by cross-linking with a secondary reagent. Overlaid histograms show CD5 expression in Foxp3neg CD4+ T cells as indicated. (D) Engagement of HVEM in T cells induces Cd5 gene expression. Naïve 2D2 CD4+Foxp3negCD25neg T cells were stimulated for 2 days in vitro in the presence of either αHVEM or isotype control at indicated concentrations followed by cross-linking with a secondary reagent. Gene expression was analyzed by quantitative real-time RT-PCR, normalized for expression of HPRT and calculated using ΔΔCT method. Graph shows a fold difference in αHVEM over isotype treated with an arbitrary value indicating no change set at 1. (E) Engagement of HVEM in T cells activates MEK phosphorylation. Immunoblot analysis in lysates of T cells stimulated as in (D) and for the indicated times. (F and G) Engagement of HVEM in T cells reduces E47 gene expression (F) and induces Ets1 gene expression (G). T cells were stimulated and gene expression analyzed as in (D). (H) Engagement of HVEM in T cells increases ETS1 protein expression. Immunoblot analysis in lysates of T cells stimulated as in (D) and for the indicated times. (A, B, C, E, and H) Results represent one of two to three similar experiments. (D, F, and G) Results (n=4) from two independent experiments represent mean +/− SEM. ** p ≤0.01 *** p ≤0.001 **** p ≤0.0001, analyzed by two-way ANOVA. Please see also Figure S4.
Figure 5
Figure 5. Engagement of HVEM in T cells induces CD5-dependent Treg cell induction
(A and B) HVEM-mediated upregulation of CD5 relieves inhibition of Treg cell induction by IL-4. (A) Naïve Cd5+/+ and Cd5−/− 2D2 Foxp3negCD25neg CD4+ T cells were stimulated for 5 days in vitro with αCD3 and αCD28 in the presence of TGF-β and αHVEM or isotype control followed by cross-linking with a secondary reagent and also in the presence or absence of IL-4. Plots show Foxp3 (RFP) expression and anti-CD25 staining intensity. (B) Graphs show percentages of Foxp3+CD25+ cells (n=3–4). (C and D) HVEM-mediated upregulation of CD5 relieves inhibition of Treg cell induction by IL-6. (C) T cells were cultured as in (A) but in the presence or absence of IL-6. Plots show Foxp3 (RFP) expression and anti-CD25 staining intensity. (D) Graphs show percentages of Foxp3+CD25+ cells in the indicated groups (n=3–5). (A and C) Numbers in quadrants indicate corresponding percentages. Results represent on of two to three similar experiments. (B and D) Results represent mean +/− SEM, * P< 0.05, ** p ≤0.01 and **** p ≤0.0001 determined by one-way ANOVA, Results in each group are from two to three independent experiments. Please see also Figure S5.

Comment in

References

    1. Albring JC, Sandau MM, Rapaport AS, Edelson BT, Satpathy A, Mashayekhi M, Lathrop SK, Hsieh CS, Stelljes M, Colonna M, et al. Targeting of B and T lymphocyte associated (BTLA) prevents graft-versus-host disease without global immunosuppression. The Journal of experimental medicine. 2010;207:2551–2559. - PMC - PubMed
    1. Azzam HS, DeJarnette JB, Huang K, Emmons R, Park CS, Sommers CL, El-Khoury D, Shores EW, Love PE. Fine tuning of TCR signaling by CD5. Journal of immunology. 2001;166:5464–5472. - PubMed
    1. Azzam HS, Grinberg A, Lui K, Shen H, Shores EW, Love PE. CD5 expression is developmentally regulated by T cell receptor (TCR) signals and TCR avidity. The Journal of experimental medicine. 1998;188:2301–2311. - PMC - PubMed
    1. Barnden MJ, Allison J, Heath WR, Carbone FR. Defective TCR expression in transgenic mice constructed using cDNA-based alpha- and beta-chain genes under the control of heterologous regulatory elements. Immunol Cell Biol. 1998;76:34–40. - PubMed
    1. Belz GT, Behrens GM, Smith CM, Miller JF, Jones C, Lejon K, Fathman CG, Mueller SN, Shortman K, Carbone FR, Heath WR. The CD8alpha(+) dendritic cell is responsible for inducing peripheral self-tolerance to tissue-associated antigens. The Journal of experimental medicine. 2002;196:1099–1104. - PMC - PubMed

Publication types

MeSH terms

Substances