. 2016 Dec 15;83(1):e02826-16.
doi: 10.1128/AEM.02826-16. Print 2017 Jan 1.

Bacteria as Emerging Indicators of Soil Condition

Affiliations

Bacteria as Emerging Indicators of Soil Condition

Syrie M Hermans et al. Appl Environ Microbiol. .

Abstract

Bacterial communities are important for the health and productivity of soil ecosystems and have great potential as novel indicators of environmental perturbations. To assess how they are affected by anthropogenic activity and to determine their ability to provide alternative metrics of environmental health, we sought to define which soil variables bacteria respond to across multiple soil types and land uses. We determined, through 16S rRNA gene amplicon sequencing, the composition of bacterial communities in soil samples from 110 natural or human-impacted sites, located up to 300 km apart. Overall, soil bacterial communities varied more in response to changing soil environments than in response to changes in climate or increasing geographic distance. We identified strong correlations between the relative abundances of members of Pirellulaceae and soil pH, members of Gaiellaceae and carbon-to-nitrogen ratios, members of Bradyrhizobium and the levels of Olsen P (a measure of plant available phosphorus), and members of Chitinophagaceae and aluminum concentrations. These relationships between specific soil attributes and individual soil taxa not only highlight ecological characteristics of these organisms but also demonstrate the ability of key bacterial taxonomic groups to reflect the impact of specific anthropogenic activities, even in comparisons of samples across large geographic areas and diverse soil types. Overall, we provide strong evidence that there is scope to use relative taxon abundances as biological indicators of soil condition.

Importance: The impact of land use change and management on soil microbial community composition remains poorly understood. Therefore, we explored the relationship between a wide range of soil factors and soil bacterial community composition. We included variables related to anthropogenic activity and collected samples across a large spatial scale to interrogate the complex relationships between various bacterial community attributes and soil condition. We provide evidence of strong relationships between individual taxa and specific soil attributes even across large spatial scales and soil and land use types. Collectively, we were able to demonstrate the largely untapped potential of microorganisms to indicate the condition of soil and thereby influence the way that we monitor the effects of anthropogenic activity on soil ecosystems into the future.

Keywords: biogeography; biological indicator; soil health; soil microbiology.


Figures

FIG 1
FIG 1
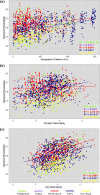
Relationship between dissimilarity in bacterial community composition (Bray-Curtis measure) and (a) geographic distance, (b) dissimilarity in climate, and (c) dissimilarity in the soil environment, for samples within each land use category. Linear regression lines for each trend are plotted, and adjusted R2 values are provided. Asterisks (*) indicate significant values (P value < 0.05); full regression equations are provided in Table S4.
FIG 2
FIG 2
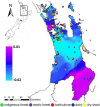
Location of the sites sampled across northern New Zealand; points are colored according to the land use of each site. Variability in the composition of bacterial communities across the study region is portrayed using kriging interpolation of the first-axis nMDS scores (calculated from a Bray-Curtis dissimilarity matrix based on relative phylum abundances). The color scale on the left indicates the extrapolated scores derived from the first nMDS axis; areas with similar colors represent sample data that clustered together on the first nMDS axis. A similar map, produced using the scores of the second nMDS axis, is provided in Fig. S2 in the supplemental material. (Outline maps are from Statistics New Zealand [Creative Commons Attribution 4.0 International license].)
FIG 3
FIG 3
Relationship between bacterial community composition or relative taxon abundances and each soil variable. The radius of each circle represents the amount of variation in community composition or taxon abundance that was accounted for by each soil variable, based on adjusted R-squared values from distance-based multivariate multiple regression analyses; only statistically significant (P value < 0.05) contributions are shown, based on 999 permutations of the data. Additionally, the univariate relationship between the abundance of each taxon and soil variables, calculated using Pearson's correlation coefficient, is represented by the color of the circle (blue represents a negative correlation; orange represents a positive correlation). Phyla or classes are ordered according to overall abundance in all the samples, from most abundant (top) to least abundant (bottom). Daggers (†) indicate that some soil variables were correlated with other variables in the data set, leading to some being removed from analysis, as detailed in Table S3. NH4-N was also included in the analysis, but the results did not reveal a significant relationship with bacterial community composition or relative taxon abundance and are therefore not shown.
FIG 4
FIG 4
Relationships between specific soil variables and the abundances of four selected taxa. The Pearson's correlation coefficient (r) value for each relationship is indicated; all correlations were significant (P values < 0.001). Each point represents one site; sites are colored according to land use. Asterisks (*) indicate taxa that were classified only to the family level; therefore, these groups of organisms may consist of several genera within that family which remain unclassified. Daggers (†) indicate soil variables that were correlated with other soil variables in the data set, which were removed. Thus, for example, relationships between the relative abundances of Bradyrhizobium and cadmium similar to those determined for Olsen P may be expected, as detailed in Table S3.

References

    1. Ranjard L, Poly F, Nazaret S. 2000. Monitoring complex bacterial communities using culture-independent molecular techniques: application to soil environment. Res Microbiol 151:167–177. doi: 10.1016/S0923-2508(00)00136-4. - DOI - PubMed
    1. Compant S, Duffy B, Nowak J, Clément C, Barka EA. 2005. Use of plant growth-promoting bacteria for biocontrol of plant diseases: principles, mechanisms of action, and future prospects. Appl Environ Microbiol 71:4951–4959. doi: 10.1128/AEM.71.9.4951-4959.2005. - DOI - PMC - PubMed
    1. Wu T, Chellemi DO, Graham JH, Martin KJ, Rosskopf EN. 2008. Comparison of soil bacterial communities under diverse agricultural land management and crop production practices. Microb Ecol 55:293–310. doi: 10.1007/s00248-007-9276-4. - DOI - PubMed
    1. Fierer N, Jackson RB. 2006. The diversity and biogeography of soil bacterial communities. Proc Natl Acad Sci U S A 103:626–631. doi: 10.1073/pnas.0507535103. - DOI - PMC - PubMed
    1. Griffiths RI, Thomson BC, James P, Bell T, Bailey M, Whiteley AS. 2011. The bacterial biogeography of British soils. Environ Microbiol 13:1642–1654. doi: 10.1111/j.1462-2920.2011.02480.x. - DOI - PubMed

Publication types

LinkOut - more resources