. 2016 Dec 1;44(21):10343-10353.
doi: 10.1093/nar/gkw968. Epub 2016 Oct 27.

Visualization of DNA G-quadruplexes in herpes simplex virus 1-infected cells

Affiliations

Visualization of DNA G-quadruplexes in herpes simplex virus 1-infected cells

Sara Artusi et al. Nucleic Acids Res. .

Abstract

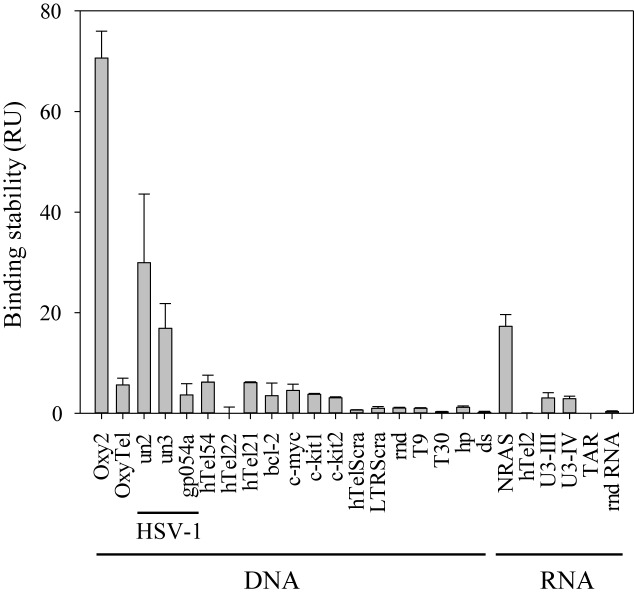
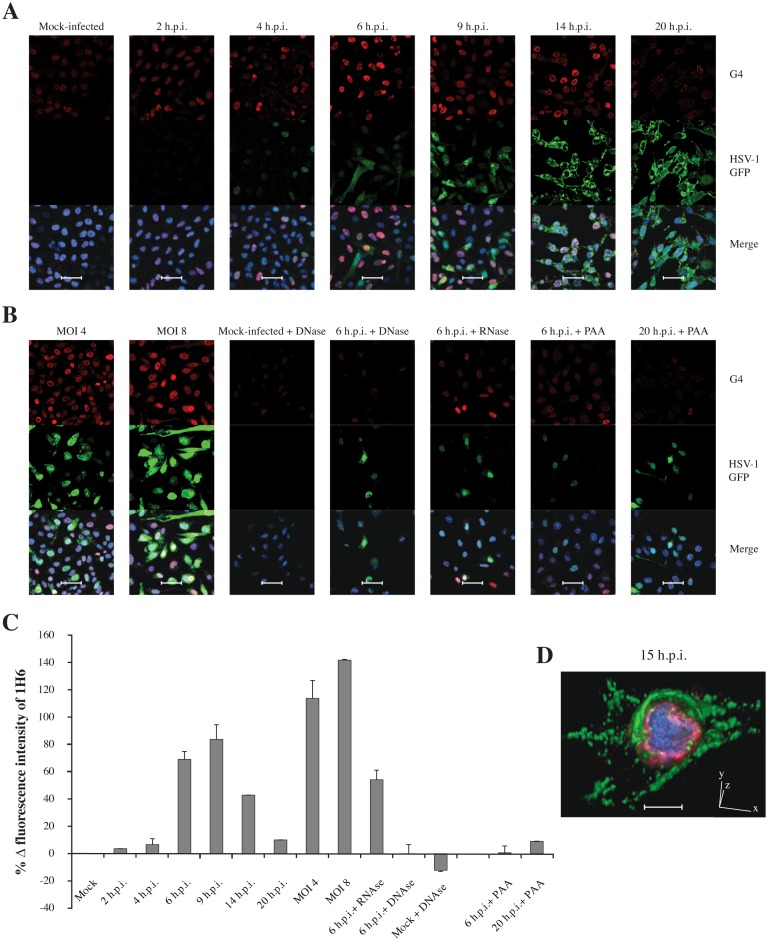
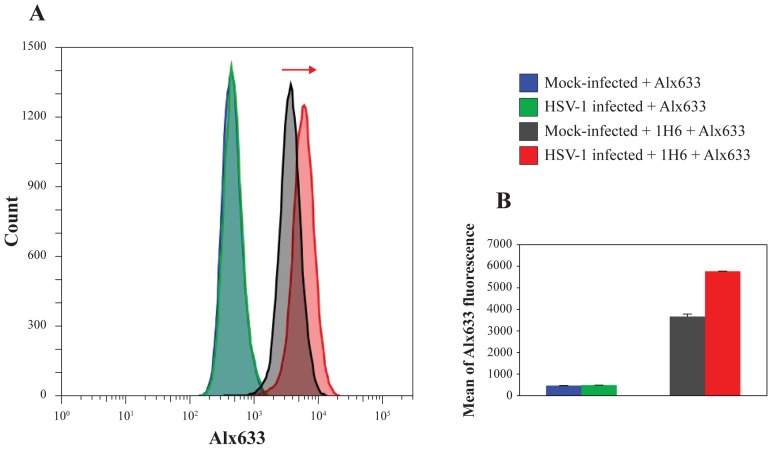
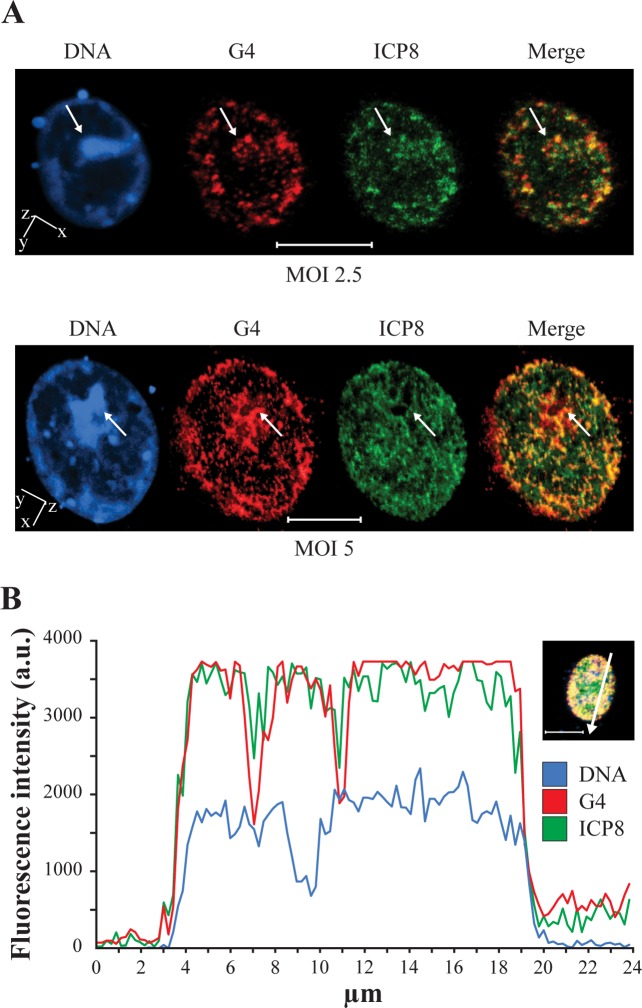
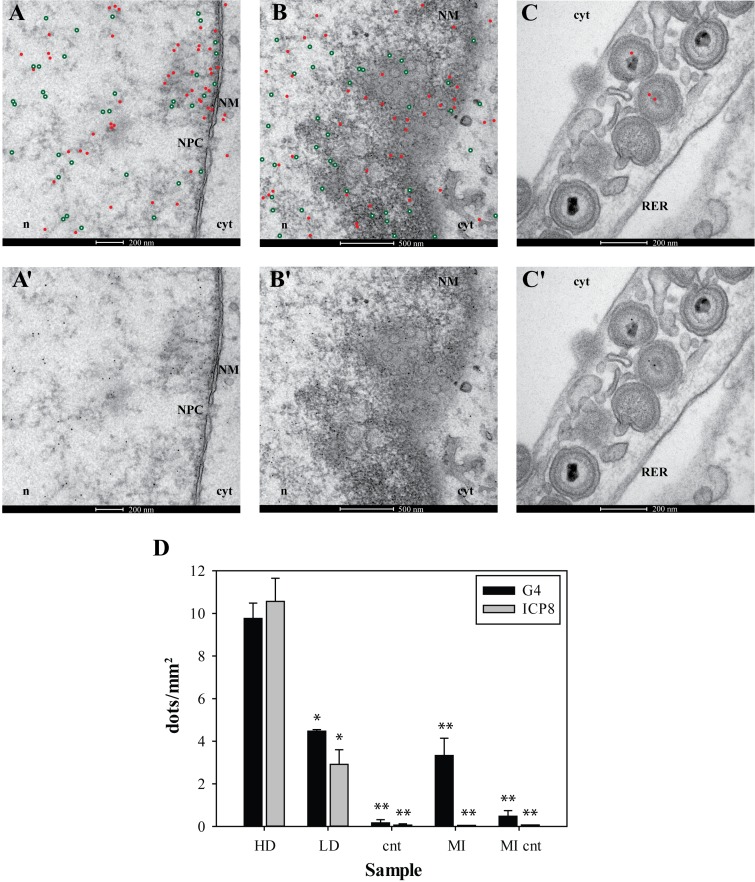
We have previously shown that clusters of guanine quadruplex (G4) structures can form in the human herpes simplex-1 (HSV-1) genome. Here we used immunofluorescence and immune-electron microscopy with a G4-specific monoclonal antibody to visualize G4 structures in HSV-1 infected cells. We found that G4 formation and localization within the cells was virus cycle dependent: viral G4s peaked at the time of viral DNA replication in the cell nucleus, moved to the nuclear membrane at the time of virus nuclear egress and were later found in HSV-1 immature virions released from the cell nucleus. Colocalization of G4s with ICP8, a viral DNA processing protein, was observed in viral replication compartments. G4s were lost upon treatment with DNAse and inhibitors of HSV-1 DNA replication. The notable increase in G4s upon HSV-1 infection suggests a key role of these structures in the HSV-1 biology and indicates new targets to control both the lytic and latent infection.


Figures

Figure 1.
Figure 1.
SPR analysis of 1H6 antibody binding stability to HSV-1 G4-forming oligonucleotides and control sequences. HSV-1 G4-forming oligonucleotides (un2, un3, gp054a) (Table 1) and the controls (0.25-8 μM) were injected on chip-immobilized 1H6. The binding stability values at 4 μM oligonucleotides are shown. Values were measured in the late dissociation phase. For DNA sequences: Oxy2 forms a tetramolecular G4 against which 1H6 was initially developed in animals; OxyTel is the corresponding monomolecular G4. HTel21, hTel22 and hTel54 are different-length G4-forming telomeric repeats; bcl-2, c-myc, c-kit1 and c-kit2 are oncogene promoter G4s; hTelScra and LTRScra are G-rich non-G4-forming oligonucleotides; rnd is a random sequence; T9 and T30 are polyT oligonucleotides; hp is a hairpin forming sequence; dsDNA is double stranded DNA. For RNA sequences: NRAS and hTel2 are two cellular G4s; U3-III and U3-IV are two HIV-1 G4s; TAR is a hairpin RNA; rndR is a unstructured random RNA. Results are shown as RU (response units) values ± SEM (n = 3).
Figure 2.
Figure 2.
Immunofluorescence confocal microscopy of HSV-1 v41-infected mammalian cells at 60× magnification. (A) Infected cells visualized at different h.p.i., corresponding to a single cycle of replication. (B) Cells infected with increasing MOIs of HSV-1 v41 visualized at 6 h.p.i. and infected cell treated with DNase, RNAse and PAA, an inhibitor of the viral DNA polymerase, visualized either at 6 h.p.i. or 20 h.p.i., as indicated. In all images: the red signal indicates G4s, detected with the 1H6 primary Ab and Alexa Fluor-546 secondary Ab; the green signal derives from the viral recombinant L protein VP16-GFP and indicates the presence of the virus in cells; the blue signal is obtained staining the DNA with DRAQ5®. In the merge images the blue signal is shown overlapped with the red and green fluorescence. Mock-infected cells were treated in the same conditions. Shown are representative images at 60× magnification. Each condition was tested at least three times, always including mock-infected and infected cells as reference. Scale bars: 50 μm. (C) Quantification of the G4 (1H6) signal. Data refer to intensity values supplied by the instrument for the non-saturated signal in the 20× images (Supplementary Figure S2), opportunely normalized to the number of cell nuclei and to mock-infected cell fluorescence intensity. (D) Three-dimension (3D) confocal microscopy of HSV-1 v41 infected cell at 15 h.p.i.. Red fluorescence indicates G4s (1H6), which are mainly localized at the internal layer of the nuclear membrane; the green fluorescence shows the late viral protein VP16-GFP, mainly accumulated in the cytoplasm at this time p.i.; the blue fluorescence shows the DNA dispersed in the cell nucleus. Scale bar: 10 μm.
Figure 3.
Figure 3.
Quantification of G4s in HSV-1 infected cells by flow cytometry. (A) Analysis of the increase of 1H6 fluorescence in HSV-1 infected cells (in red) in comparison with mock-infected cells (in black) as indicated by the red arrow. No effect on fluorescence was observed in the presence of the Alexa Fluor-633 secondary antibody only (Alx633) in neither mock-infected nor infected cells (see histogram on the left, curves are indicated in blue and green respectively). Figures are representative of two independent experiments, each made in triplicate. (B) Mean of 1H6 fluorescence in mock-infected and infected cells: a 57% increase, in terms of mean of 1H6 fluorescence was observed in infected cells compared to mock-infected cells within the replication time range. The mean of Alx633 in mock-infected and infected cells resulted superimposable and no increase was observed.
Figure 4.
Figure 4.
Colocalization of G4s and the viral protein ICP8 by 3D confocal microscopy. ICP8 is a marker for HSV-1 replication compartments (RCs) (41). (A) Cells were infected with different amounts of wt HSV-1 (strain F), MOI 2.5 (upper panel) and 5 (lower panel). At 6–8 h.p.i. cells were stained with the anti-G4 (1H6) and anti-ICP8-FITC Abs. Blue, red and green indicate DNA, G4s and ICP8-dependent viral RCs, respectively. The images on the right (merge) show G4 (red) and ICP8 (green) overlapping as a yellow/orange signal. Spatial orientation is indicated. (B) Intensity profiles of DNA (blue), G4s (red) and ICP8-dependent RCs (green) obtained with NIS-Elements Advanced Research software, along an ideal 24 μm-long straight line (white) crossing the nucleus of a representative infected cell (right inset). The DNA profile defines the nuclear area where the G4 and ICP8 profiles are clearly also enclosed. G4 and ICP8 exhibit very similar fluorescence profile. The scale bar is set to 10 μm.
Figure 5.
Figure 5.
Immuno-EM of HSV-1 infected cells, fixed at 15 h.p.i. and incubated with anti-G4 Ab (1H6) and 3–83 anti-ICP8 serum. Primary 1H6 and anti-ICP8 Abs were detected with 5- and 10-nm gold particles, respectively. To improve image clarity, gold particles were highlighted with red dots (indicating G4s) and green encircled white dots (indicating ICP8) in A, B, C. The original images are provided in the corresponding panels A', B', C'. (A-A’) G4s and ICP8 are gathered in close proximity to the nuclear membrane (NM) where a nuclear pore complex (NPC) is present. Nuclear egress via NCP is one of the pathways used by HSV-1 capsids to move from the nucleus (n) to the cytoplasm (cyt) (46,47); (B-B’) G4s and ICP8 clustered close to the NM, where many newly formed virions are budding. (C-C’) After nuclear egress, enveloped virions, some of which show the presence of G4s in their core, are transported into RER. ‘n’ indicates the nucleoplasm, cyt the cytoplasm. Bars length is indicated in each panel. Panel (D): statistical analysis of G4 and ICP8 distribution in cells. G4 and ICP8 dots were calculated in 35–45 images per each condition and represented as dot/mm2. Cell areas with ≤5 dots/mm2 were considered low-density (LD) areas and calculated separately with respect to high-density (HD) areas. Cnt are infected cells treated only with secondary Abs. MI are mock-infected cells treated with both the primary and secondary Abs; MI cnt are mock-infected cells treated only with the secondary Abs. In all data sets: mean ± sem, Student's t-test, *P < 0.05, **P < 0.01.

References

    1. Huppert J.L. Four-stranded nucleic acids: structure, function and targeting of G-quadruplexes. Chem. Soc. Rev. 2008;37:1375–1384. - PubMed
    1. Eddy J., Maizels N. Gene function correlates with potential for G4 DNA formation in the human genome. Nucleic Acids Res. 2006;34:3887–3896. - PMC - PubMed
    1. Huppert J.L., Balasubramanian S. G-quadruplexes in promoters throughout the human genome. Nucleic Acids Res. 2007;35:406–413. - PMC - PubMed
    1. Nakken S., Rognes T., Hovig E. The disruptive positions in human G-quadruplex motifs are less polymorphic and more conserved than their neutral counterparts. Nucleic Acids Res. 2009;37:5749–5756. - PMC - PubMed
    1. Mani P., Yadav V.K., Das S.K., Chowdhury S. Genome-wide analyses of recombination prone regions predict role of DNA structural motif in recombination. PLoS One. 2009;4:e4399. - PMC - PubMed

LinkOut - more resources