. 2017 May;19(5):e12689.
doi: 10.1111/cmi.12689. Epub 2016 Nov 25.

Infection with the Lyme disease pathogen suppresses innate immunity in mice with diet-induced obesity

Affiliations

Infection with the Lyme disease pathogen suppresses innate immunity in mice with diet-induced obesity

Nataliya Zlotnikov et al. Cell Microbiol. 2017 May.

Abstract

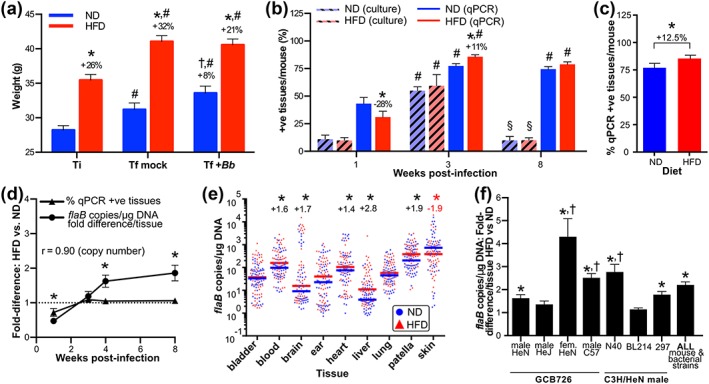
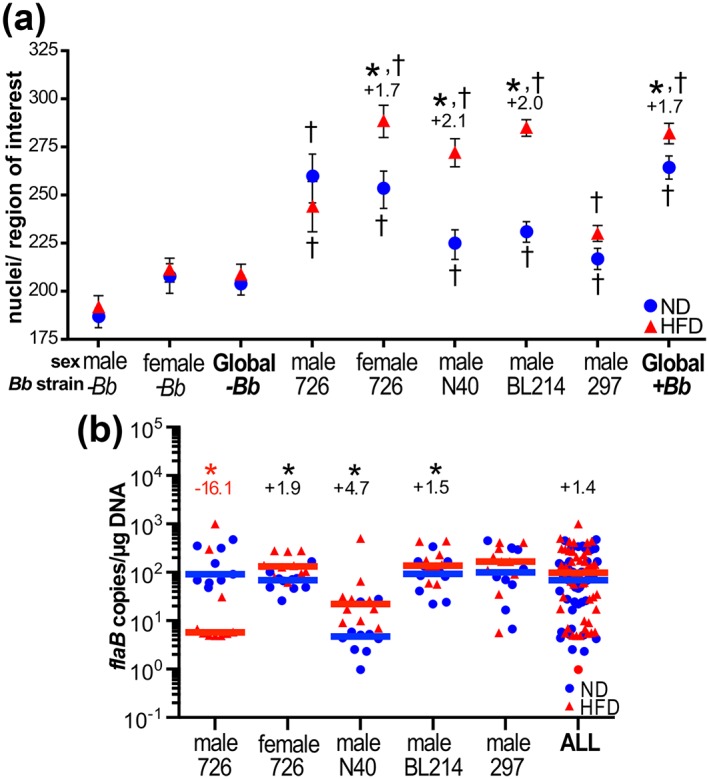
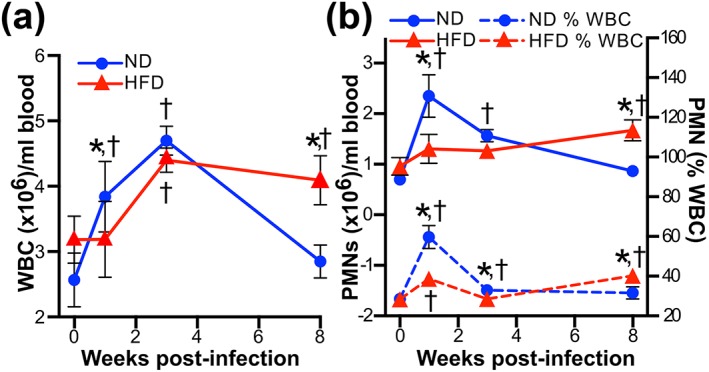
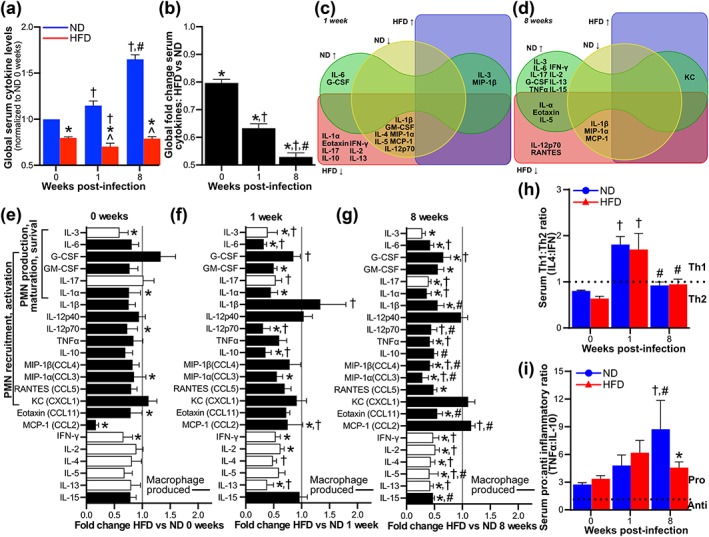
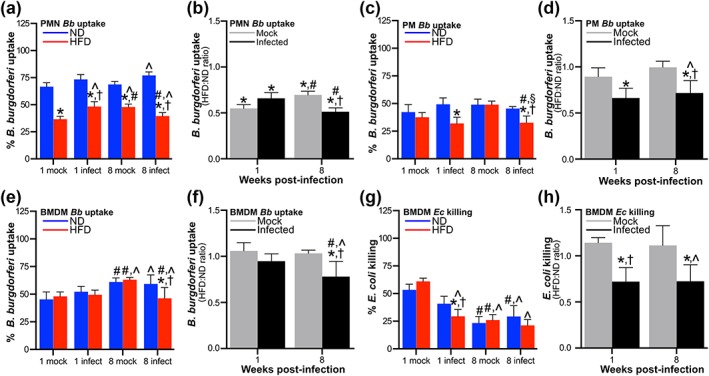
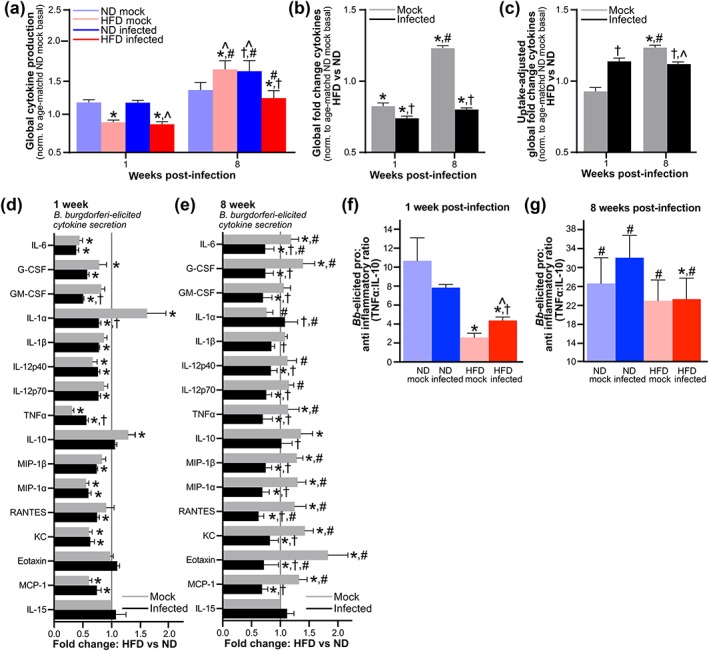
Obesity is a major global public health concern. Immune responses implicated in obesity also control certain infections. We investigated the effects of high-fat diet-induced obesity (DIO) on infection with the Lyme disease bacterium Borrelia burgdorferi in mice. DIO was associated with systemic suppression of neutrophil- and macrophage-based innate immune responses. These included bacterial uptake and cytokine production, and systemic, progressive impairment of bacterial clearance, and increased carditis severity. B. burgdorferi-infected mice fed normal diet also gained weight at the same rate as uninfected mice fed high-fat diet, toll-like receptor 4 deficiency rescued bacterial clearance defects, which greater in female than male mice, and killing of an unrelated bacterium (Escherichia coli) by bone marrow-derived macrophages from obese, B. burgdorferi-infected mice was also affected. Importantly, innate immune suppression increased with infection duration and depended on cooperative and synergistic interactions between DIO and B. burgdorferi infection. Thus, obesity and B. burgdorferi infection cooperatively and progressively suppressed innate immunity in mice.

Keywords: Borrelia burgdorferi; Lyme disease; diseases; host obesity; immunology; infection.


Figures

Figure 1
Figure 1
Progressive, systemic, and toll‐like receptor (TLR)4‐dependent impairment of Borrelia burgdorferi clearance in diet‐induced obesity (DIO). (a) Body weight at time of infection (T i) and final sacrifice (T f) for mice preconditioned with normal (ND) or high‐fat diet (HFD) and infected for 4 weeks with 1 × 104 B. burgdorferi (+Bb) or vehicle (mock: bacterial cultivation medium alone). Mean ± 95% confidence intervals (CIs) are shown for all mouse sexes and strains and bacterial strains analyzed in this study. At T i, all HFD mice were ≥25% heavier than age‐, sex‐, and strain‐matched ND controls and were obese. N ≥ 30 (T i) and 98 mice (in each of T f mock and T f + Bb groups) per diet group. * indicates p < 0.05 HFD versus ND within time point (% difference shown above HFD columns). † indicates p < 0.05 T f + Bb versus T f mock for ND (% difference shown above T f + Bb column). # indicates p < 0.05 T f versus T i within diet. Weight and blood glucose values for individual experiments are provided in Figure S1c–f. (b) Mean ± standard error of the mean (SEM) percentage of tissues from male C3H/HeN mice infected with 1 × 104 GCB726 from which B. burgdorferi could be cultivated (culture) or that were positive for B. burgdorferi flaB DNA (quantitative polymerase chain reaction [qPCR]) 1, 3, and 8 weeks after infection. N = 10–11 mice per diet group (Weeks 1 and 8) and 5 mice per diet group (Week 3). Values above columns indicate percentage change in qPCR‐positive tissues in mice for HFD versus ND at the same time point. * indicates p < 0.05 HFD versus ND within time point. # indicates p < 0.05 3 and 8 weeks versus 1 week within diet group. § indicates 8 versus 3 weeks within diet group. (c) Mean (± 95% CI) percentage of qPCR‐positive tissues per mouse for all mouse strains and sexes and bacterial strains combined. * indicates p < 0.05 (two‐tailed t‐test). Values for individual experiments are provided in Figure S2b. (d) Mean ± SEM fold‐differences (HFD vs. ND) in percentage of qPCR‐positive tissues and median flaB copy number/tissue 1, 3, 4, and 8 weeks after infection of male C3H/HeN mice with 1 × 104 GCB726. Average fold differences in median flaB copy number/tissue were calculated by normalizing DNA concentration‐adjusted values for each tissue from each mouse to the median flaB copy number for the same tissue from ND mice. Then, for each HFD mouse, median fold differences obtained for each tissue were averaged to obtain the mean fold difference/tissue across all tissues. Shown in panel D are the means of mean fold difference/tissue for all mice within the HFD group. r: Pearson correlation coefficient: copy number fold difference versus time. N = 5–11 mice/diet group and time point. * indicates p < 0.05 copy number versus % qPCR‐positive fold differences. Raw values are provided in Figure S2c–d. (e) Median flaB copy number in individual tissues for all mouse strains and sexes and bacterial strains combined. Each data point corresponds to the value for one tissue from one mouse 4 weeks post‐infection. Values above datasets for each tissue indicate significant fold‐differences in HFD versus ND group (* p < 0.05). Raw values for individual experiments are provided in Figure S2e–k. Each diet group for each experimental group contained 9–11 mice. Statistical comparison between diet groups for this meta‐analysis was performed by two‐way ANOVA, and each individual experimental group was equally weighted, to control for differences in mouse numbers in individual groups. (f) Mean ± SEM fold‐differences (HFD vs. ND) in median bacterial burden/tissue for individual mouse strains and sexes and bacterial strains. HeJ mice are TLR4‐deficient. N ≥ 9 mice/diet group for individual experiments. N = 9–11 mice/diet group and experimental condition. * indicates p < 0.05 HFD versus ND. † indicates p < 0.05 versus male HeN infected with GCB726
Figure 2
Figure 2
Increased Lyme carditis severity in diet‐induced obesity (DIO). (a) Mean ± standard error of the mean (SEM) carditis (inflammation) scores, calculated as described in experimental procedures by measuring mean numbers of nuclei/region of interest in heart sections from mice infected with indicated bacterial strains, and age‐, sex‐, and strain‐matched mock‐infected mice (−Bb). Global values (−Bb and +Bb) are means for all sexes and bacterial strains combined. Representative histology images are provided in Figure S3. (b) Median Borrelia burgdorferi DNA copy number in hearts for indicated mouse strains and sexes and bacterial strains, and all groups (ALL). Each data point corresponds to the copy number values for one mouse. For a and b, values above datasets indicate significant fold‐differences for high‐fat diet (HFD) versus normal diet (ND) groups. N ≥ 9 mice/diet group for individual experiments. * indicates p < 0.05 HFD versus ND. † indicates p < 0.05 versus age‐, sex‐, and diet‐matched mock‐infected control group († symbols placed above and below mean values for each infected diet group)
Figure 3
Figure 3
Attenuated and delayed systemic neutrophil responses to Borrelia burgdorferi infection in diet‐induced obesity (DIO). Mean ± standard error of the mean (SEM) cell count/ml blood for white blood cells (a: WBC) and neutrophils (b: PMN) 0, 1, 3, and 8 weeks after infection (0 weeks: uninfected baseline). Experiments were performed with male C3H/HeN mice infected with 1 × 104 GCB726. The percentage of total WBCs that were PMNs is indicated by dashed lines plotted on the right y‐axis. Blood counts for other WBC types are provided in Figure S3b–e. N = 10–11 mice per diet group (Weeks 0, 1, and 8) and 5 mice per diet group (week 3). * indicates p < 0.05 normal diet (ND) versus high‐fat diet (HFD). † indicates infected versus uninfected (0 weeks) within diet group
Figure 4
Figure 4
Progressive, global suppression of systemic cytokine responses to Borrelia burgdorferi infection in diet‐induced obesity (DIO). Serum levels of 23 cytokines 0, 1, and 8 weeks after infection (0 weeks: uninfected baseline) of male C3H/HeN mice with 1 × 104 GCB726. (a–b) Global fold difference/cytokine for all cytokines, compared to normal diet (ND) uninfected baseline (a) and for high‐fat diet (HFD) versus ND (b). (c–d) Venn diagrams illustrating significantly (p < 0.05) upregulated (↑) or downregulated (↓) cytokines compared to ND uninfected baseline, at 1 (c) and 8 (d) weeks post‐infection. (e–g) HFD:ND fold‐differences for individual cytokines at 0 (e), 1 (f), and 8 (g) weeks. Cytokines involved in neutrophil production, maturation, survival, recruitment, and activation are indicated. Black bars indicate macrophage‐produced cytokines. (h) Th1:Th2 (interleukin [IL]‐4:interferon [IFN]‐γ) and (i) pro‐inflammatory: anti‐inflammatory (tumor necrosis factor [TNF]α:IL‐10) cytokine ratios. Raw data for all panels in this figure and names of cytokines indicated by abbreviations are provided in Figure S4. N = 10–11 mice per diet group and time point. Data summaries: mean ± standard error of the mean (SEM). * indicates p < 0.05 HFD versus ND. † indicates p < 0.05 infected versus uninfected (0 weeks) within diet group. # indicates p < 0.05 8 versus 1 week within diet group. ^ indicates p < 0.05 versus ND uninfected (0 weeks)
Figure 5
Figure 5
Borrelia burgdorferi infection‐dependent suppression of neutrophil and macrophage bacterial uptake in diet‐induced obesity (DIO). (a–f) Ex vivo uptake of B. burgdorferi by peritoneally recruited neutrophils (a–b: PMN), peritoneally recruited macrophages (c–d: PM) and bone marrow‐derived macrophages (e–f: BMDMs). Raw values are shown in a, c, and e. Uptake in mock‐infected and infected high‐fat diet (HFD) groups normalized to uptake by age‐ and infection‐matched normal diet (ND) controls are shown in b, d, and f. (g–h) Ex vivo E. coli killing by BMDMs. g: raw data. h: killing in mock‐infected and infected HFD groups normalized to killing by age‐ and infection‐matched ND controls. For all experiments, neutrophils and macrophages were obtained from male C3H/HeN mice 1 and 8 weeks after inoculation with bacterial cultivation medium alone (mock) or 1 × 104 GCB726 (infected). N ≥ 9, 12, and 9 mice per diet and infection group at each time point for PMN, PM, and BMDM experiments, respectively. Summary values are mean ± standard error of the mean (SEM). * indicates p < 0.05 HFD versus ND within infection group and time point. † indicates p < 0.05 infected versus mock within diet group and time point. # indicates p < 0.05 8 versus 1 week within diet and infection group. ^ indicates p < 0.05 versus ND mock 1 week
Figure 6
Figure 6
Infection‐dependent global suppression of macrophage cytokine production in response to Borrelia burgdorferi challenge in diet‐induced obesity (DIO). Cytokines produced ex vivo by peritoneally recruited macrophages from male C3H/HeN mice 1 and 8 weeks after mice were inoculated with cultivation medium alone (mock) or 1 × 104 GCB726 (infected). (a) Global induction of all cytokines by co‐incubation with B. burgdorferi, normalized to basal cytokine production by unstimulated PMs from age‐matched normal diet (ND) mock‐infected mice. (b–c) Global high‐fat diet (HFD):ND fold‐difference/cytokine for all cytokines, unadjusted (b) and adjusted (c) for differences in B. burgdorferi uptake efficiency among groups (Figure 5c). (d–e) HFD:ND fold‐differences for individual cytokines at 1 (d) and 8 (e) weeks. (f–g) Pro‐inflammatory: anti‐inflammatory (tumor necrosis factor [TNF]α:interleukin [IL]‐10) cytokine ratios for individual mice at 1 (f) and 8 (g) weeks post‐inoculation. Raw data for all panels are provided in Figure S7. N ≥ 12 mice per diet group and time point. Data summaries: mean ± standard error of the mean (SEM). * indicates p < 0.05 HFD versus ND within infection group and time point. † indicates p < 0.05 infected versus mock. # indicates p < 0.05 8 versus 1 week within infection group. ^ indicates p < 0.05 versus age‐matched ND mock group

References

    1. Amar, S. , Zhou, Q. , Shaik‐Dasthagirisaheb, Y. , & Leeman, S. (2007). Diet‐induced obesity in mice causes changes in immune responses and bone loss manifested by bacterial challenge. Proceedings of the National Academy of Sciences of the United States of America, 104(51), 20466–20471. doi:10.1073/pnas.0710335105 - DOI - PMC - PubMed
    1. Barbour, A. G. (1984). Isolation and cultivation of Lyme disease spirochetes. The Yale Journal of Biology and Medicine, 57(4), 521–525. - PMC - PubMed
    1. Barthold, S. W. , Cadavid, D. , & Philipp, M. T. (2010). Animal models of borreliosis In Radolf J. D., & Samuels D. S. (Eds.), Borrelia: Molecular biology, host interaction, and pathogenesis. (pp. 359–411). Norfolk, UK: Caister Academic Press.
    1. Barthold, S. W. , Sidman, C. L. , & Smith, A. L. (1992). Lyme borreliosis in genetically resistant and susceptible mice with severe combined immunodeficiency. The American Journal of Tropical Medicine and Hygiene, 47(5), 605–613. - PubMed
    1. Benhnia, M. R. , Wroblewski, D. , Akhtar, M. N. , Patel, R. A. , Lavezzi, W. , Gangloff, S. C. , … Sellati, T. J. (2005). Signaling through CD14 attenuates the inflammatory response to Borrelia burgdorferi, the agent of Lyme disease. Journal of Immunology, 174(3), 1539–1548. doi:10.4049/jimmunol.174.3.1539 - DOI - PubMed

MeSH terms