

Effects of age and hearing loss on overshoot
- PMID: 27794300
- PMCID: PMC5065574
- DOI: 10.1121/1.4964267
Effects of age and hearing loss on overshoot
Abstract
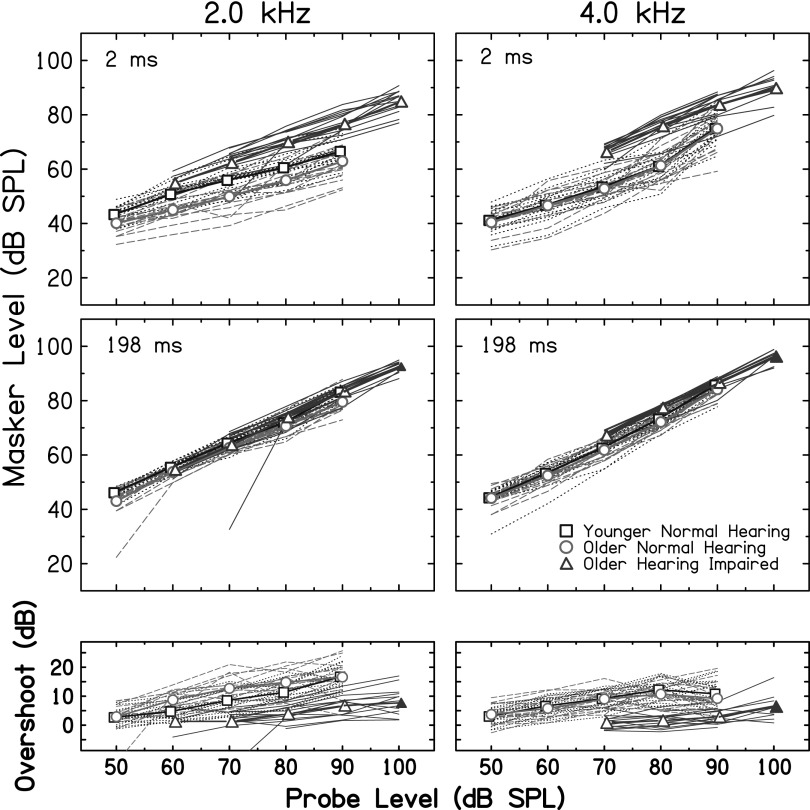
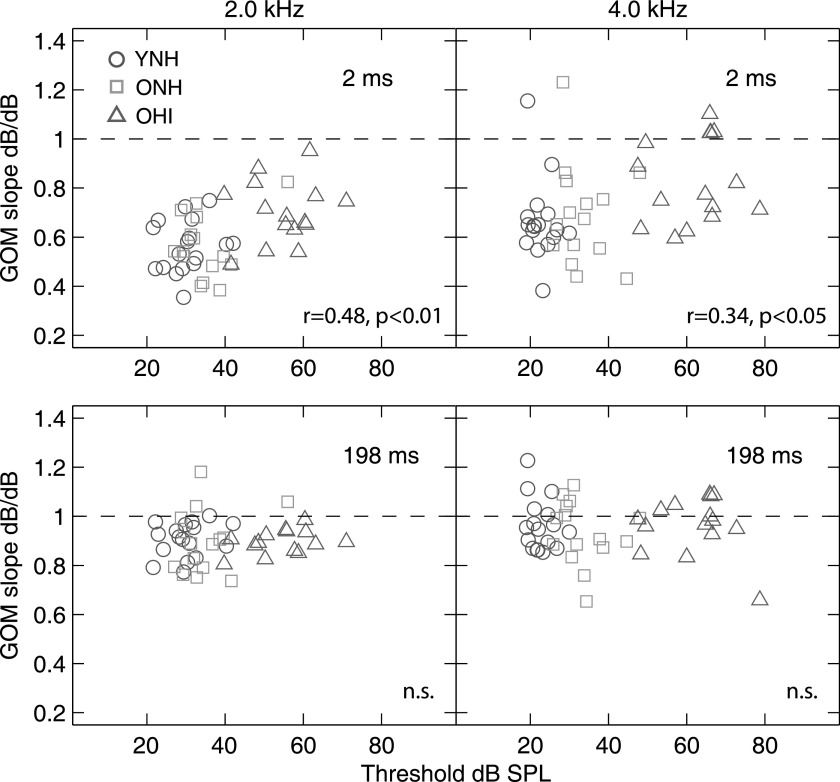
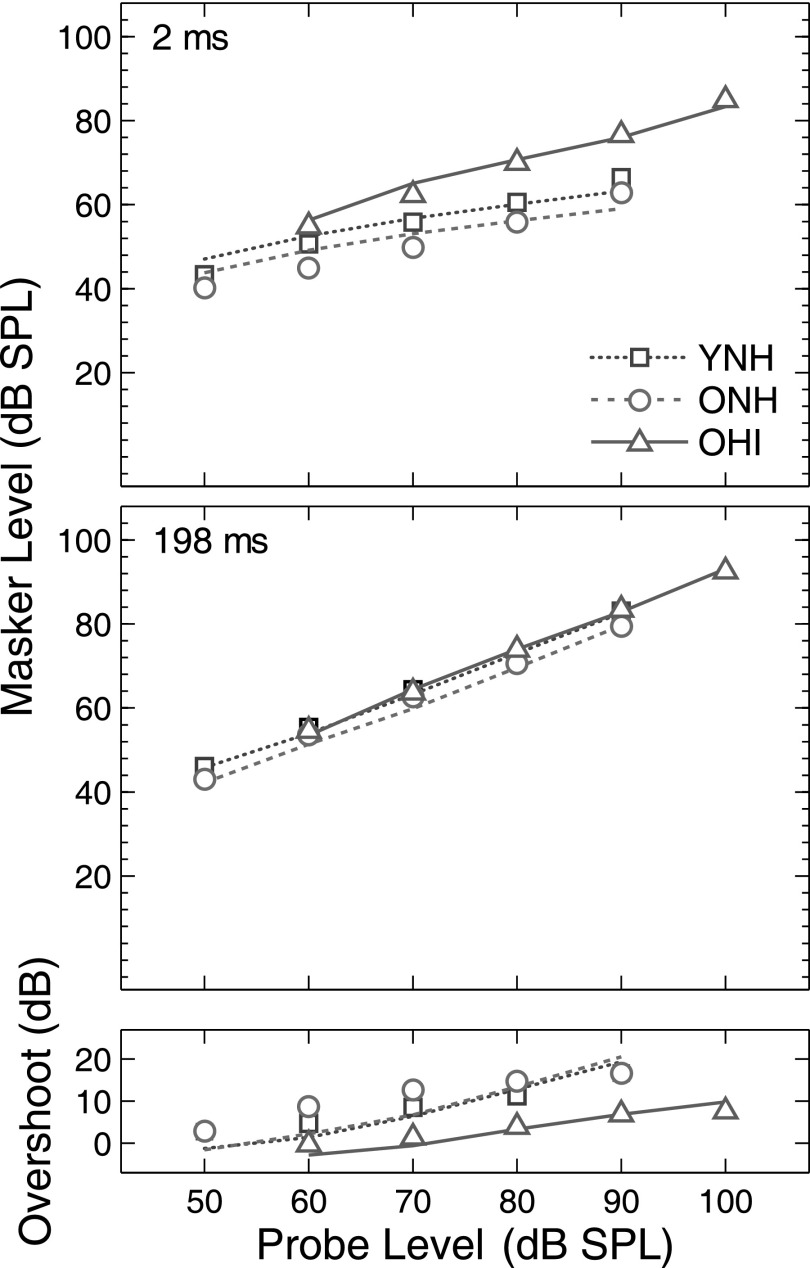
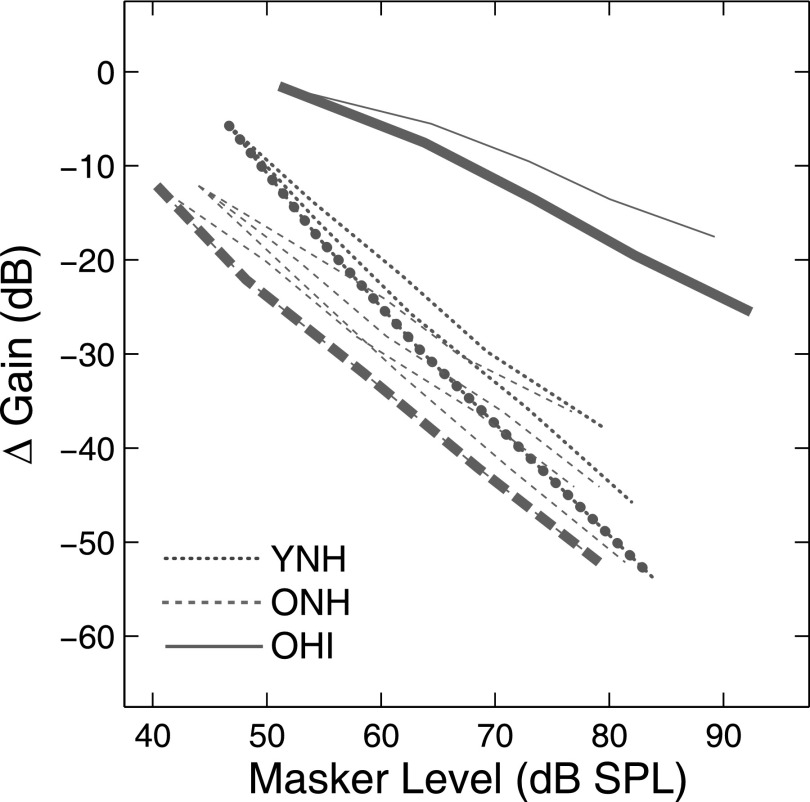
The detection of a brief, sinusoidal probe in a long broadband, simultaneous masker improves as the probe is delayed from the masker's onset. This improvement ("overshoot") may be mediated by a reduction in cochlear amplifier gain over the timecourse of the masker via the medial olivocochlear (MOC) reflex. Overshoot was measured in younger adults with normal hearing and in older adults with normal and impaired hearing to test the hypothesis that aging and cochlear hearing loss result in abnormal overshoot, consistent with changes in certain structures along the MOC pathway. Overshoot decreased with increasing quiet probe thresholds and was only minimally influenced by increasing age. Marked individual differences in overshoot were observed due to differences in masking thresholds for probes presented near the masker's onset. Model simulations support the interpretation that reduced overshoot in hearing-impaired listeners is due to limited cochlear amplifier gain and therefore less gain to adjust over the timecourse of the masker. Similar overshoot among younger and older adults with normal hearing suggests that age-related changes to mechanisms underlying overshoot do not result in significant differences in overshoot among younger and older adults with normal hearing.
Figures
Similar articles
-
Evaluating adaptation and olivocochlear efferent feedback as potential explanations of psychophysical overshoot.J Assoc Res Otolaryngol. 2011 Jun;12(3):345-60. doi: 10.1007/s10162-011-0256-5. Epub 2011 Jan 26. J Assoc Res Otolaryngol. 2011. PMID: 21267622 Free PMC article.
-
Is overshoot caused by an efferent reduction in cochlear gain?Adv Exp Med Biol. 2013;787:65-72. doi: 10.1007/978-1-4614-1590-9_8. Adv Exp Med Biol. 2013. PMID: 23716210
-
Overshoot effects using Schroeder-phase harmonic maskers in listeners with normal hearing and with hearing impairment.Hear Res. 2001 Dec;162(1-2):1-9. doi: 10.1016/s0378-5955(01)00342-2. Hear Res. 2001. PMID: 11707346
-
Overshoot in normal-hearing and hearing-impaired subjects.J Acoust Soc Am. 1992 May;91(5):2865-71. doi: 10.1121/1.402967. J Acoust Soc Am. 1992. PMID: 1629479
-
Temporal masking in electric hearing.J Assoc Res Otolaryngol. 2005 Dec;6(4):390-400. doi: 10.1007/s10162-005-0016-5. J Assoc Res Otolaryngol. 2005. PMID: 16261267 Free PMC article.
Cited by
-
Temporal Effects on Monaural Amplitude-Modulation Sensitivity in Ipsilateral, Contralateral and Bilateral Noise.J Assoc Res Otolaryngol. 2018 Apr;19(2):147-161. doi: 10.1007/s10162-018-0656-x. Epub 2018 Mar 5. J Assoc Res Otolaryngol. 2018. PMID: 29508100 Free PMC article.
-
The role of the medial olivocochlear reflex in psychophysical masking and intensity resolution in humans: a review.J Neurophysiol. 2021 Jun 1;125(6):2279-2308. doi: 10.1152/jn.00672.2020. Epub 2021 Apr 28. J Neurophysiol. 2021. PMID: 33909513 Free PMC article. Review.
-
Effects of Masker Envelope Fluctuations on the Temporal Effect.J Assoc Res Otolaryngol. 2018 Dec;19(6):717-727. doi: 10.1007/s10162-018-00688-x. Epub 2018 Aug 20. J Assoc Res Otolaryngol. 2018. PMID: 30128623 Free PMC article.
-
The effects of broadband elicitor duration on transient-evoked otoacoustic emissions and a psychoacoustic measure of gain reduction.Res Sq [Preprint]. 2025 Aug 12:rs.3.rs-6753082. doi: 10.21203/rs.3.rs-6753082/v2. Res Sq. 2025. PMID: 40502776 Free PMC article. Preprint.
-
Olivocochlear Efferents in Animals and Humans: From Anatomy to Clinical Relevance.Front Neurol. 2018 Mar 26;9:197. doi: 10.3389/fneur.2018.00197. eCollection 2018. Front Neurol. 2018. PMID: 29632514 Free PMC article. Review.
References
Publication types
MeSH terms
Grants and funding
LinkOut - more resources
Full Text Sources
Other Literature Sources