. 2016 Oct;140(4):2257.
doi: 10.1121/1.4963865.

On Zwicker tones and musical pitch in the likely absence of phase locking corresponding to the pitch

Affiliations

On Zwicker tones and musical pitch in the likely absence of phase locking corresponding to the pitch

Hedwig E Gockel et al. J Acoust Soc Am. 2016 Oct.

Abstract

It was assessed whether Zwicker tones (ZTs) (an auditory afterimage produced by a band-stop noise) have a musical pitch. First (stage I), musically trained subjects adjusted the frequency, level, and decay time of an exponentially decaying diotic sinusoid to sound similar to the ZT they perceived following the presentation of diotic broadband noise, for various band-stop positions. Next (stage II), subjects adjusted a sinusoid in frequency and level so that its pitch was a specified musical interval below that of either a preceding ZT or a preceding sinusoid, and so that it was equally loud. For each subject the reference sinusoid corresponded to their adjusted sinusoid from stage I. Subjects selected appropriate frequency ratios for ZTs, although the standard deviations of the adjustments were larger for the ZTs than for the equally salient sinusoids by a factor of 1.0-2.2. Experiments with monaural stimuli led to similar results, although the pitch of the ZTs could differ for monaural and diotic presentation of the ZT-exciting noise. The results suggest that a weak musical pitch may exist in the absence of phase locking in the auditory nerve to the frequency corresponding to the pitch (or harmonics thereof) at the time of the percept.


Figures
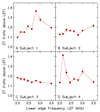
Fig. 1
Fig. 1
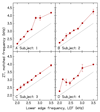
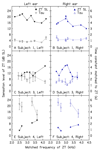
Geometric mean frequency (and the corresponding SE) of the diotic sinusoid matched in pitch to the ZT, expressed as the ratio relative to the LEF, plotted as a function of the LEF of the notch in the diotically presented ZT-exciting noise.
Fig. 2
Fig. 2
As Fig. 1, but showing the absolute frequency (and the corresponding SD) of the pitch-matched sinusoid.
Fig. 3
Fig. 3
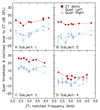
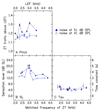
Initial level of exponentially decaying diotic sinusoid matched to the initial loudness of the ZT perceived after diotic presentation of a ZT-exciting noise (circles), and absolute thresholds in quiet for left (downward-pointing triangles) and right ears (upward-pointing triangles) at pure tone frequencies matched to the pitch of the ZT, as a function of the frequency of the sinusoid matched in pitch to the ZTs. Levels are equivalent diffuse-field levels.
Fig. 4
Fig. 4
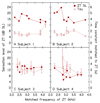
Initial sensation level (SL) of exponentially decaying diotic sinusoid matched to the initial loudness of the ZT perceived after diotic presentation of a ZT-exciting noise (filled circles connected by solid lines) plotted with respect to left-hand y-axis, and the corresponding time constants (Tau, open circles connected by dashed lines) plotted with respect to right-hand y-axis, as a function of the matched frequency.
Fig. 5
Fig. 5
Results of the four subjects for experiment 1. The figure shows the geometric mean (and corresponding SD across reference frequencies or LEFs) of the ratio of the adjusted frequency to the expected frequency, with the PT and the ZT as reference (see legend), for each target musical interval (fifth and minor third).
Fig. 6
Fig. 6
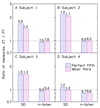
Ratio of the geometric mean (across reference frequencies or LEFs) of the SDs (left) and of the average number of trials (n-listen, right) between ZT and PT conditions, for musical intervals of a perfect fifth and a minor third (see legend). The value of each measure for the PT condition is given by the number above the corresponding bar; for the SD this is the representative SD (see text), expressed as a percentage of the geometric mean of the adjusted frequencies.
Fig. 7
Fig. 7
As Fig. 1, but for experiment 2. Results for the diotic presentation used in experiment 1 are re-plotted for comparison, together with a repeat measure for the diotic presentation collected after completion of experiment 2.
Fig. 8
Fig. 8
As Fig. 4, but for the results of experiment 2. Left ear: left-hand column, right ear: right-hand column.
Fig. 9
Fig. 9
Left column: Initial SL of exponentially decaying sinusoid matched to the initial loudness of the ZT for conditions monaural left (filled downward-pointing triangles), monaural right (filled upward-pointing triangles), and diotic (filled circles), plotted with regard to left-hand axis, as a function of the matched frequency. Right column: Corresponding time constants of exponentially decaying sinusoid matched to the initial loudness of the ZT for conditions monaural left (empty downward-pointing triangles), monaural right (empty upward-pointing triangles), and diotic (empty circles), plotted with regard to right-hand axis, as a function of the matched frequency.
Fig. 10
Fig. 10
As in Fig. 5, but for experiment 2 (monaural, left column). Results for diotic presentation are re-plotted for comparison (right-hand column).
Fig. 11
Fig. 11
As in Fig. 6, but for experiment 2 (monaural, left). Results for diotic presentation are re-plotted for comparison (right).
Fig. 12
Fig. 12
Identity matches obtained for the lower presentation level of the ZT-exciting noise (open triangles, subject 1 only). Results of experiment 2 (shown in Figs. 7 and 8) are re-plotted for comparison (filled triangles). (A) Geometric mean frequency (and SEs) of the monaural sinusoid matched in pitch to the ZT, expressed relative to the LEF, plotted as a function of the LEF. (B) Initial SL of exponentially decaying monaural sinusoid matched to the initial loudness of the ZT, plotted with respect to left-hand axis, as a function of the matched frequency. (C) Corresponding time constants (and SEs), plotted with respect to right-hand axis, as a function of the matched frequency.
Fig. 13
Fig. 13
As Fig. 10, but for the lower noise level (monaural, 41 dB SPL noise) (A). Results from experiment 2 (monaural, 51 dB SPL noise) are re-plotted for comparison (B).
Fig. 14
Fig. 14
As Fig. 11, but for the lower noise level (monaural, 41 dB SPL noise) (A). Results from experiment 2 (monaural, 51 dB SPL noise) are re-plotted for comparison (B).

Similar articles

Cited by

References

    1. Akeroyd MA, Moore BCJ, Moore GA. Melody recognition using three types of dichotic-pitch stimulus. J Acoust Soc Am. 2001;110:1498–1504. doi: 10.1121/1.1390336. - DOI - PubMed
    1. Akeroyd MA, Summerfield AQ. A fully-temporal account of the perception of dichotic pitches. Brit J Audiol. 1999;33:106–107.
    1. Attneave F, Olson RK. Pitch as a medium: A new approach to psychophysical scaling. Am J Psychol. 1971;84:147–166. doi: 10.2307/1421351. - DOI - PubMed
    1. Bilsen FA. Pitch of noise signals: Evidence for a ‘central spectrum,’. J Acoust Soc Am. 1977;61:150–161. doi: 10.1121/1.381276. - DOI - PubMed
    1. Bleeck S, Ives T, Patterson RD. Aim-Mat: The auditory image model in MATLAB. Acta Acust Acust. 2004;90:781–787.

Publication types

LinkOut - more resources