. 2017 Feb:174:42-55.
doi: 10.1016/j.ajo.2016.10.005. Epub 2016 Oct 26.

Choriocapillaris Nonperfusion is Associated With Poor Visual Acuity in Eyes With Reticular Pseudodrusen

Affiliations

Choriocapillaris Nonperfusion is Associated With Poor Visual Acuity in Eyes With Reticular Pseudodrusen

Peter L Nesper et al. Am J Ophthalmol. 2017 Feb.

Abstract

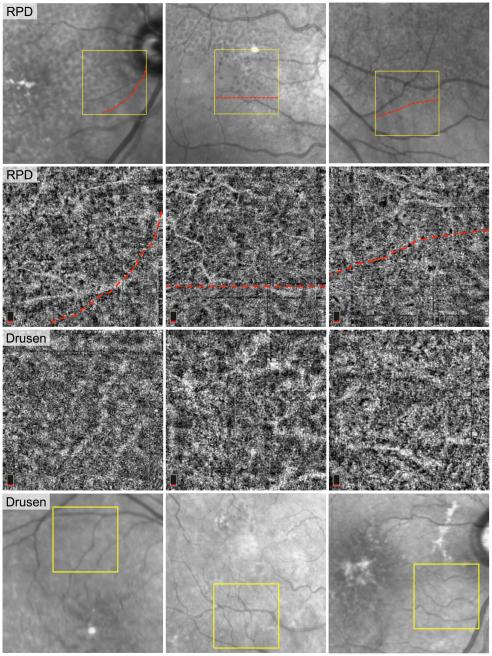
Purpose: To study choriocapillaris blood flow in age-related macular degeneration (AMD) using optical coherence tomography angiography (OCTA) and study its correlation to visual acuity (VA) in eyes with reticular pseudodrusen (RPD) vs those with drusen without RPD (drusen).

Design: Cross-sectional study.

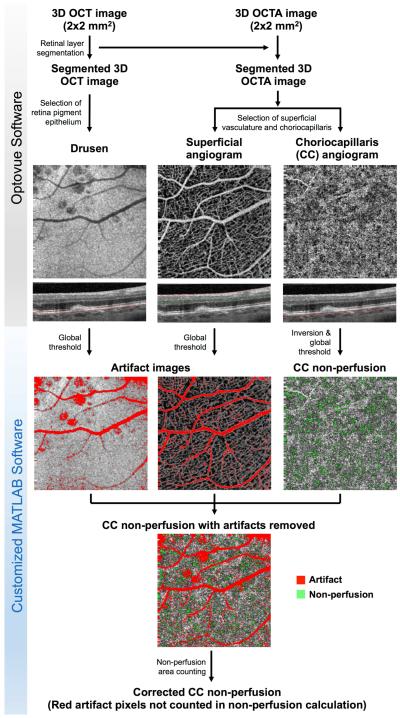
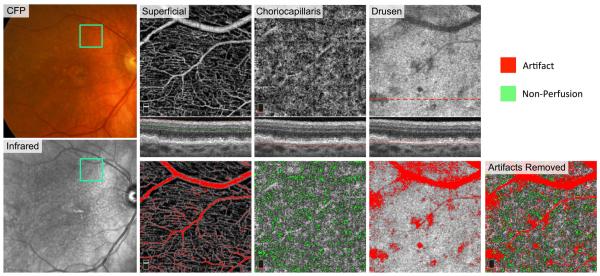
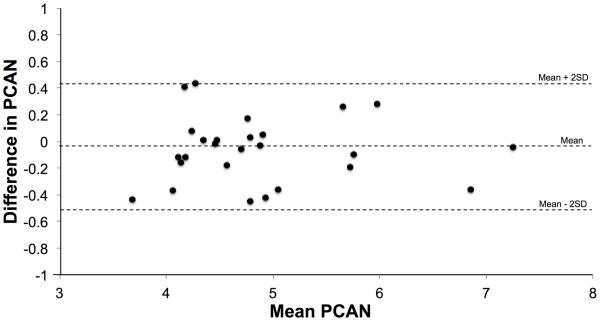
Methods: Patients with either drusen or RPD in early AMD underwent OCTA imaging of the superior, inferior, and/or nasal macula. We quantified "percent choriocapillaris area of nonperfusion" (PCAN) in eyes with RPD vs those with drusen. We assessed the repeatability of PCAN and its correlations with VA.

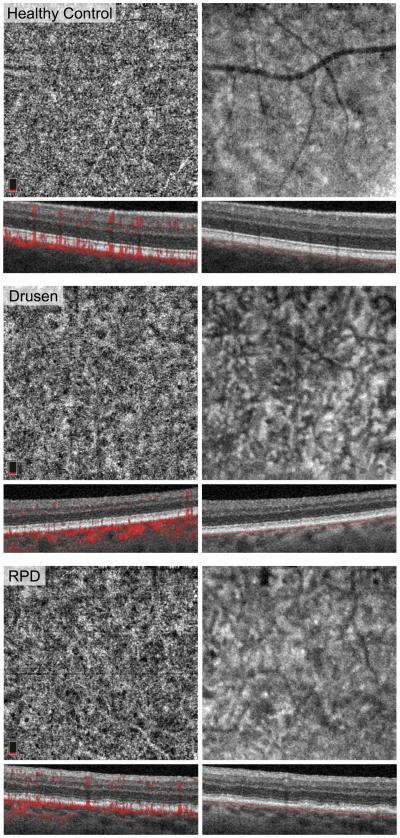
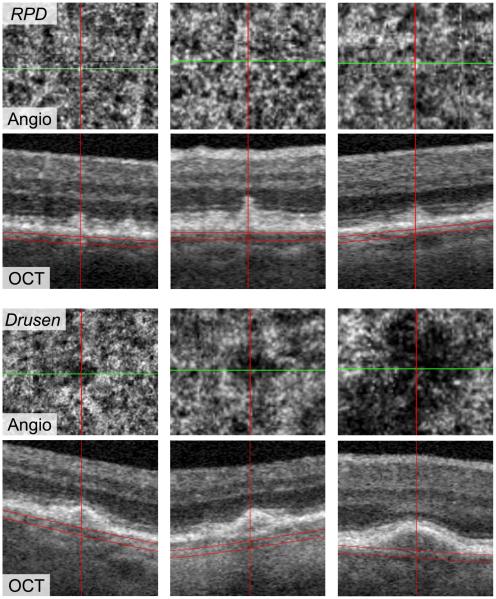
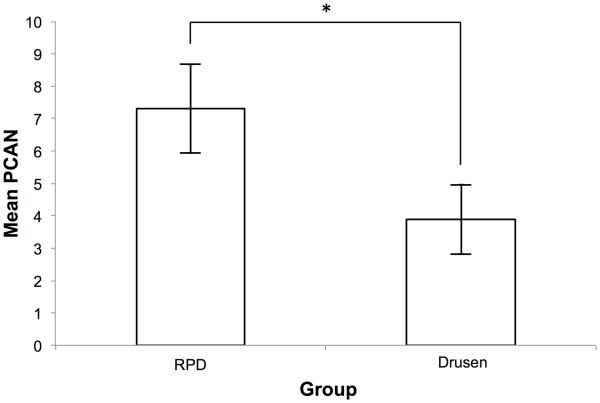
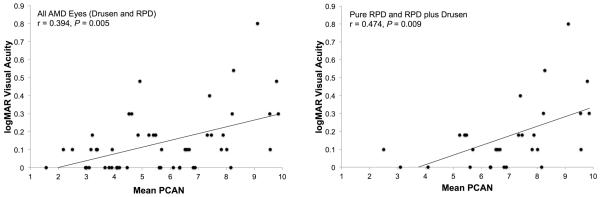
Results: Twenty-nine eyes of 26 patients with RPD and 21 eyes of 16 age-matched AMD patients with drusen were included. Qualitatively, the choriocapillaris in areas with RPD showed focal dark regions without flow signal on OCTA (nonperfusion). The repeatability coefficient of PCAN was 0.49%. Eyes with RPD had significantly greater PCAN compared with eyes with drusen (7.31% and 3.88%, respectively; P < .001). We found a significant correlation between PCAN and VA for the entire dataset (r = 0.394, P = .005). When considering eyes with RPD separately, this correlation was stronger (r = 0.474, P = .009) but lost significance when considering eyes with drusen separately (r = 0.175, P = .45).

Conclusions: Eyes with RPD have significantly larger areas of choriocapillaris nonperfusion compared with eyes with drusen and no RPD. The correlation between PCAN and VA in this RPD population provides a potential mechanistic explanation for vision compromise in RPD compared with other forms of drusen in AMD.


Figures

Figure 1
Figure 1. Optical Coherence Tomography Angiography (OCTA) Imaging of the Choriocapillaris
Example en face OCTA images of the choriocapillaris (left) and en face structural OCT (right), in a healthy age-matched eye (Top) early age-related macular degeneration with drusen (Middle), and reticular pseudodrusen (RPD; Bottom). OCT B-scans with red flow overlay are shown below each OCTA image highlighting the relatively uniform flow signal immediately below Bruch’s membrane, with relevant segmentation boundaries (red lines) confirming the angiogram is of the choriocapillaris. OCT B-scans without red flow signal below each structural OCT image show the structural components of the choriocapillaris, which do not consistently correlate with flow signal of the choriocapillaris angiogram.
Figure 2
Figure 2. Algorithm for Artifact Removal and Calculation of Percent Choriocapillaris Area of Non-Perfusion (PCAN)
Optical coherence tomography (OCT) and OCT angiography (OCTA) images covering a 2 × 2 mm2 area were acquired by the Angiovue device. Retina layer segmentation was performed on the three-dimensional (3-D) structural OCT image to obtain the locations of the retinal layers. The 3-D OCT image was converted into a two-dimensional retinal pigment epithelium (RPE) structure image by semi-automatically selecting the RPE layer and obtaining the en face slab (~28 μm thick) to highlight drusen and retinal vessels that may cast shadows on the choriocapillaris. The 3-D OCTA image was converted into two en face angiograms: one for the superficial retinal capillary vasculature and one for the choriocapillaris. The segmentation for the superficial angiogram extended from 3 μm below the inner limiting membrane to 15 μm below the inner plexiform layer, while the segmentation for the choriocapillaris was taken from the bottom of the RPE to ~28 μm below. The segmentation lines are shown on the OCT B-scan below each image. To obtain masks of the shadow artifacts, the RPE structure (drusen mask) and superficial angiogram were globally thresholded. To obtain a mask of the choriocapillaris non-perfusion, the choriocapillaris angiogram was first inverted and then thresholded based on the outer retinal slab; all choriocapillaris pixels with intensity below the average pixel intensity of the outer retina (noise-level) were considered non-perfusion in the choriocapillaris. The artifact masks were removed from the choriocapillaris non-perfusion mask, to avoid false counting of shadow artifacts as non-perfusion. Finally, the PCAN in the choriocapillaris non-perfusion mask is calculated by dividing the area below the threshold by the remaining area of choriocapillaris.
Figure 3
Figure 3. Subretinal Drusenoid Deposits (SDD) and Drusen on Optical Coherence Tomography Angiography (OCTA)
Enlarged view from choriocapillaris angiograms in eyes with reticular pseudodrusen (RPD) centered on the location of SDD (Top row). Enlarged view of OCT B-scan from the OCTA device centered on SDD of varying size and shape (Second row). Regardless of the size of the SDD lesion, they did not produce shadowing artifacts on the choriocapillaris. Enlarged view from choriocapillaris angiograms in eyes with drusen centered on the location of the drusen (Third row). Enlarged view of OCT B-scan from the OCTA device centered on drusen of varying size and shape (Bottom row). Drusen produced shadows on the choriocapillaris that may be artifactually counted as non-perfusion.
Figure 4
Figure 4. Elimination of Shadow Artifacts on the Choriocapillaris of an Eye with Both Drusen and Reticular Pseudodrusen (RPD)
Top left: Color fundus photograph (CFP) with location of optical coherence tomography angiography (OCTA) image (green box). Bottom left: Infrared reflectance image with visible hypo-reflective RPD lesions. Top middle-left: OCTA image (2 × 2 mm2) of the superficial capillary plexus (SCP) with B-scan below showing red and green segmentation boundary lines. Bottom middle-left: SCP with overlaid red pixel mask of the brightest pixels, which will be eliminated from choriocapillaris non-perfusion calculation. Top middle-right: Original OCTA image of the choriocapillaris with B-scan below showing red segmentation boundary lines. Bottom middle: OCTA of the choriocapillaris with green pixel mask representing pixels falling below the pixel intensity threshold. Top right: En face structural OCT image segmented at the retinal pigment epithelium (RPE) with B-scan below showing red segmentation boundary lines. Dotted red line shows location of B-scans. Drusen and large retinal vessels appear dark. Bottom middle-right: En face structural OCT with red pixel mask (darkest pixels in this en face image) representing drusen and retinal vessels, areas which will be eliminated from the choriocapillaris non-perfusion calculation. The diffuse red pixels in the top of the image represent an area where the segmentation boundaries failed to follow the contour of RPE, which will also be eliminated from the calculation. Bottom right: OCTA of choriocapillaris with the non-perfusion (green) pixel and artifact (red) pixel masks. Red pixels were eliminated from the image before the final calculation of the “percent choriocapillaris area of non-perfusion” (PCAN) from the remaining image.
Figure 5
Figure 5. Distinct Appearance of the Choriocapillaris Underlying Reticular Pseudodrusen (RPD)
Top row: Infrared reflectance (IR) images of three eyes with RPD and corresponding optical coherence tomography angiography (OCTA) en face images directly below. The red lines indicate the transition zone from RPD present (superiorly) to RPD absent (inferiorly). Second row: The OCTA images of the choriocapillaris in RPD reveal a distinct pattern of numerous, focal “dark spots” lacking any flow signal underlying the zones of RPD as seen on IR. RPD is present above the red line in the OCTA scans. Third row: OCTA of the choriocapillaris in three eyes with early age-related macular degeneration (AMD) with drusen without RPD. OCTA shows a more uniform flow signal throughout the scan without the obvious appearance of the “dark spots,” which are seen in eyes with RPD. Bottom row: The IR images of the three AMD eyes with drusen without RPD, corresponding to OCTA seen in the third row, confirm absent RPD patterns and absent regional choriocapillaris flow changes.
Figure 6
Figure 6. Choriocapillaris Non-Perfusion on Optical Coherence Tomography Angiography (OCTA) is Significantly Greater in Eyes with Reticular Pseudodrusen (RPD)
The average “percent choriocapillaris area of non-perfusion” (PCAN) was 7.31% for eyes with RPD and 3.88% for eyes with early age-related macular degeneration with drusen without RPD (P < 0.001). Scale bars represent standard deviations (1.37% and 1.07% for RPD and drusen, respectively).
Figure 7
Figure 7. Choriocapillaris Non-Perfusion on Optical Coherence Tomography Angiography (OCTA) Correlated Significantly with Visual Acuity
Left: Spearman rank correlation between “percent choriocapillaris area of non-perfusion” (PCAN) and logarithm of the minimum angle of resolution (logMAR) visual acuity for all eyes with age-related macular degeneration (AMD) included in the study (r = 0.394, P = 0.005). This included eyes with drusen and eyes with reticular pseudodrusen (RPD). Right: The correlation between PCAN and logMAR visual acuity was stronger when only eyes with RPD and eyes with RPD plus drusen were considered (r = 0.474, P = 0.009).
Figure 8
Figure 8. Repeatability of Optical Coherence Tomography Angiography (OCTA) and Image Processing
The Bland-Altman plot comparing two repeated measurements of the same location on retina with the OCTA device, and the “percent choriocapillaris area of non-perfusion” (PCAN) for each scan. The difference in PCAN scores between the two repeated measurements are plotted against their mean to explore the relation between the difference and the mean. No trend was apparent, allowing us to calculate the coefficient of the repeatability without mathematical transformations. The mean of the differences was −0.06 (middle dotted line) and standard deviation (SD) of the differences was 0.25 (Mean ± 1.96 × SD: top and bottom dotted lines).

References

    1. Vingerling JR, Dielemans I, Hofman A, et al. The prevalence of age-related maculopathy in the Rotterdam Study. Ophthalmology. 1995;102(2):205–210. - PubMed
    1. Hawkins BS, Bird A, Klein R, West SK. Epidemiology of age-related macular degeneration. Mol Vis. 1999;5(26):b1. - PubMed
    1. Lamoureux EL, Mitchell P, Rees G, et al. Impact of early and late age-related macular degeneration on vision-specific functioning. Br J Ophthalmol. 2010bjo. 2010.185207. - PubMed
    1. Flamendorf J, Agrón E, Wong WT, et al. Impairments in dark adaptation are associated with age-related macular degeneration severity and reticular pseudodrusen. Ophthalmology. 2015;122(10):2053–2062. - PMC - PubMed
    1. Steinberg JS, Fitzke FW, Fimmers R, Fleckenstein M, Holz FG, Schmitz-Valckenberg S. Scotopic and photopic microperimetry in patients with reticular drusen and age-related macular degeneration. JAMA Ophthalmol. 2015;133(6):690–697. - PubMed

MeSH terms