. 2017 Apr 1;174(4):349-361.
doi: 10.1176/appi.ajp.2016.16030333. Epub 2016 Oct 31.

The Origins of Cognitive Deficits in Victimized Children: Implications for Neuroscientists and Clinicians

Affiliations

The Origins of Cognitive Deficits in Victimized Children: Implications for Neuroscientists and Clinicians

Andrea Danese et al. Am J Psychiatry. .

Abstract

Objective: Individuals reporting a history of childhood violence victimization have impaired brain function. However, the clinical significance, reproducibility, and causality of these findings are disputed. The authors used data from two large cohort studies to address these research questions directly.

Method: The authors tested the association between prospectively collected measures of childhood violence victimization and cognitive functions in childhood, adolescence, and adulthood among 2,232 members of the U.K. E-Risk Study and 1,037 members of the New Zealand Dunedin Study who were followed up from birth until ages 18 and 38 years, respectively. Multiple measures of victimization and cognition were used, and comparisons were made of cognitive scores for twins discordant for victimization.

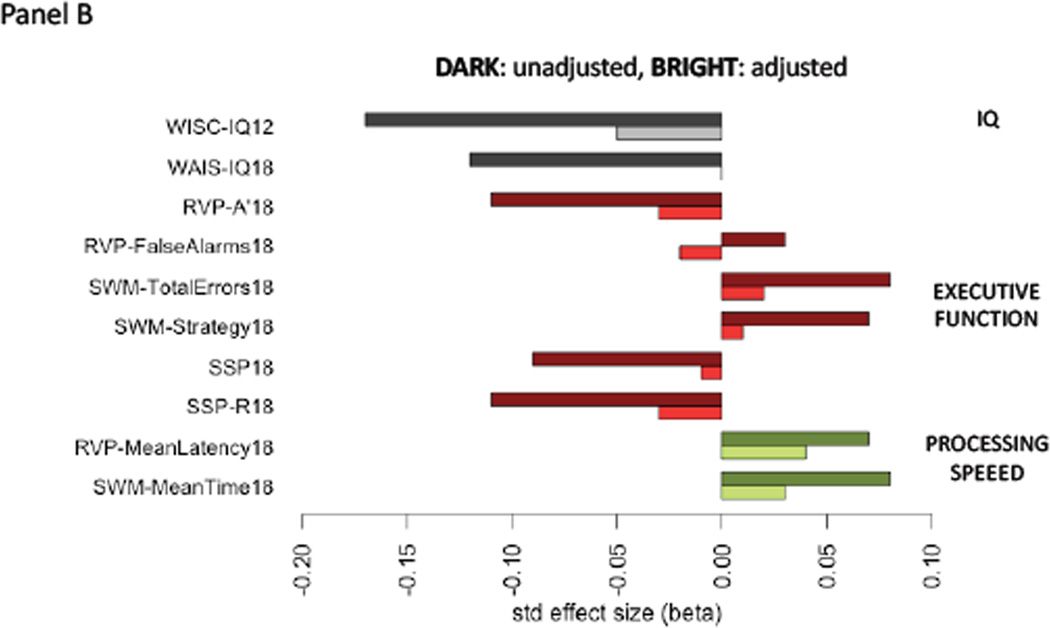
Results: Individuals exposed to childhood victimization had pervasive impairments in clinically relevant cognitive functions, including general intelligence, executive function, processing speed, memory, perceptual reasoning, and verbal comprehension in adolescence and adulthood. However, the observed cognitive deficits in victimized individuals were largely explained by cognitive deficits that predated childhood victimization and by confounding genetic and environmental risks.

Conclusions: Findings from two population-representative birth cohorts totaling more than 3,000 individuals and born 20 years and 20,000 km apart suggest that the association between childhood violence victimization and later cognition is largely noncausal, in contrast to conventional interpretations. These findings support the adoption of a more circumspect approach to causal inference in the neuroscience of stress. Clinically, cognitive deficits should be conceptualized as individual risk factors for victimization as well as potential complicating features during treatment.

Keywords: Child Maltreatment; Cognition; Executive Function; IQ; Stress; Victimization.


Figures

Figure 1
Figure 1
Timeline for the assessment of childhood victimization and cognitive functioning in the E-Risk Study and the Dunedin Study. CTQ=Childhood Trauma Questionnaire; *executive function (CANTAB), processing speed (CANTAB); **executive function (CANTAB, WAIS-IV, WMS-III, Trail-B), processing speed (CANTAB, WAIS-IV), memory (CANTAB, WMS-III, Rey AVL), perceptual reasoning (WAIS-IV), verbal comprehension (WAIS-IV)
Figure 2
Figure 2
The association between childhood victimization and cognitive functioning in the E-Risk Study (Panels A, B) and the Dunedin Study (Panels C, D) The association between childhood victimization and cognitive functioning in two birth cohorts. Panel A: Heat-map displaying the absolute values of correlations across cognitive functions in the E-Risk Study. Dark blue pixels display strong positive absolute values of correlations and light / white pixels display weak correlations. Exact correlation values are reported in Supplementary Table 7. Panel B. Standardized effect sizes (betas) for the association between childhood victimization and different cognitive functions in the E-Risk Study. Dark bars display unadjusted associations. Bright bars of the same color display associations adjusted for cognitive functioning prior to the observational period for victimization (i.e., IQ at 5 years). Panel C: Heat-map displaying the absolute values of correlations across cognitive functions in the Dunedin Study. Dark blue pixels display strong positive absolute values of correlations and light / white pixels display weak correlations. Exact correlation values are reported in Supplementary Table 8. Panel D. Standardized effect sizes (betas) for the association between childhood victimization and different cognitive functions in the Dunedin Study. Dark bars display unadjusted associations. Bright bars of the same color display associations adjusted for cognitive functioning prior to the observational period for victimization (i.e., maternal IQ and Peabody test at 3 years). E-Risk Study. WPPSI-IQ5= IQ from Wechsler Preschool and Primary Scale of Intelligence-Revised at 5 years; WISC-IQ12= IQ from Wechsler Intelligence Scale for Children-Revised at 12; WAIS-IQ18=IQ from Wechsler Adult Intelligence Scale-IV at 18; RVP-A’18= CANTAB Rapid Visual Processing A-prime at 18; RVP-FalseAlarms18= CANTAB Rapid Visual Processing Total False Alarms at 18; SWM-TotalErrors18= CANTAB Spatial Working Memory Total Errors at 18; SWM-Strategy18= CANTAB Spatial Working Memory Strategy at 18; SSP18= CANTAB Spatial Span at 18; SSP-R18= CANTAB Spatial Span Reverse at 18; RVP-MeanLatency18= CANTAB Rapid Visual Processing Mean Latency at 18; SWM-MeanTime18= CANTAB Spatial Working Memory Mean Time at 18 Dunedin Study. Maternal-IQ= maternal IQ from the Thurstone SRA Test when study members were 3 years old; Peabody-IQ3=IQ from Peabody Picture Vocabulary Test at 3 years; WISC-IQ1113= average IQ from Wechsler Intelligence Scale for Children-Revised at 11 and 13; WAIS-IQ38=IQ from Wechsler Adult Intelligence Scale-IV at 38; RVP-A’38= CANTAB Rapid Visual Processing A-prime at 38; RVP-FalseAlarms38= CANTAB Rapid Visual Processing Total False Alarms at 38; WAIS-WMI38= WAIS Working Memory Index at 38; WMS-MBT38= Wechsler Memory Scale-III Months of the Year Backwards Test at 38; Trail-B38= Trail-B test at 38; RVP-MeanLatency38= CANTAB Rapid Visual Processing Mean Latency at 38; ReactionTime38= CANTAB Reaction Time at 38; WAIS-PSI38= WAIS Processing Speed Index at 38; PAL-FirstTrial38= CANTAB Paired Associates Learning First Trial at 38; PAL-TotalErrors38= CANTAB Paired Associates Learning Total Errors at 38; WMS-VPAtotal38= Wechsler Memory Scale-III Verbal Paired Associates Total Recall at 38; WMS-VPAdelayed38= Wechsler Memory Scale-III Verbal Paired Associates Delayed Recall at 38; RAVLT-total38= Rey Auditory Verbal Learning Test Total Recall at 38; RAVLT-delayed38= Rey Auditory Verbal Learning Test Delayed Recall at 38; WAIS-PRI38= WAIS Perceptual Reasoning Index at 38; WAIS-VCI38= WAIS Verbal Comprehension Index at 38.
Figure 2
Figure 2
The association between childhood victimization and cognitive functioning in the E-Risk Study (Panels A, B) and the Dunedin Study (Panels C, D) The association between childhood victimization and cognitive functioning in two birth cohorts. Panel A: Heat-map displaying the absolute values of correlations across cognitive functions in the E-Risk Study. Dark blue pixels display strong positive absolute values of correlations and light / white pixels display weak correlations. Exact correlation values are reported in Supplementary Table 7. Panel B. Standardized effect sizes (betas) for the association between childhood victimization and different cognitive functions in the E-Risk Study. Dark bars display unadjusted associations. Bright bars of the same color display associations adjusted for cognitive functioning prior to the observational period for victimization (i.e., IQ at 5 years). Panel C: Heat-map displaying the absolute values of correlations across cognitive functions in the Dunedin Study. Dark blue pixels display strong positive absolute values of correlations and light / white pixels display weak correlations. Exact correlation values are reported in Supplementary Table 8. Panel D. Standardized effect sizes (betas) for the association between childhood victimization and different cognitive functions in the Dunedin Study. Dark bars display unadjusted associations. Bright bars of the same color display associations adjusted for cognitive functioning prior to the observational period for victimization (i.e., maternal IQ and Peabody test at 3 years). E-Risk Study. WPPSI-IQ5= IQ from Wechsler Preschool and Primary Scale of Intelligence-Revised at 5 years; WISC-IQ12= IQ from Wechsler Intelligence Scale for Children-Revised at 12; WAIS-IQ18=IQ from Wechsler Adult Intelligence Scale-IV at 18; RVP-A’18= CANTAB Rapid Visual Processing A-prime at 18; RVP-FalseAlarms18= CANTAB Rapid Visual Processing Total False Alarms at 18; SWM-TotalErrors18= CANTAB Spatial Working Memory Total Errors at 18; SWM-Strategy18= CANTAB Spatial Working Memory Strategy at 18; SSP18= CANTAB Spatial Span at 18; SSP-R18= CANTAB Spatial Span Reverse at 18; RVP-MeanLatency18= CANTAB Rapid Visual Processing Mean Latency at 18; SWM-MeanTime18= CANTAB Spatial Working Memory Mean Time at 18 Dunedin Study. Maternal-IQ= maternal IQ from the Thurstone SRA Test when study members were 3 years old; Peabody-IQ3=IQ from Peabody Picture Vocabulary Test at 3 years; WISC-IQ1113= average IQ from Wechsler Intelligence Scale for Children-Revised at 11 and 13; WAIS-IQ38=IQ from Wechsler Adult Intelligence Scale-IV at 38; RVP-A’38= CANTAB Rapid Visual Processing A-prime at 38; RVP-FalseAlarms38= CANTAB Rapid Visual Processing Total False Alarms at 38; WAIS-WMI38= WAIS Working Memory Index at 38; WMS-MBT38= Wechsler Memory Scale-III Months of the Year Backwards Test at 38; Trail-B38= Trail-B test at 38; RVP-MeanLatency38= CANTAB Rapid Visual Processing Mean Latency at 38; ReactionTime38= CANTAB Reaction Time at 38; WAIS-PSI38= WAIS Processing Speed Index at 38; PAL-FirstTrial38= CANTAB Paired Associates Learning First Trial at 38; PAL-TotalErrors38= CANTAB Paired Associates Learning Total Errors at 38; WMS-VPAtotal38= Wechsler Memory Scale-III Verbal Paired Associates Total Recall at 38; WMS-VPAdelayed38= Wechsler Memory Scale-III Verbal Paired Associates Delayed Recall at 38; RAVLT-total38= Rey Auditory Verbal Learning Test Total Recall at 38; RAVLT-delayed38= Rey Auditory Verbal Learning Test Delayed Recall at 38; WAIS-PRI38= WAIS Perceptual Reasoning Index at 38; WAIS-VCI38= WAIS Verbal Comprehension Index at 38.

Comment in

  • Post Hoc, Ergo Propter Hoc.
    Costello EJ. Costello EJ. Am J Psychiatry. 2017 Apr 1;174(4):305-306. doi: 10.1176/appi.ajp.2016.16111320. Am J Psychiatry. 2017. PMID: 28366086 No abstract available.

References

    1. Danese A, McEwen BS. Adverse childhood experiences, allostasis, allostatic load, and age-related disease. Physiol. Behav. 2012;106:29–39. - PubMed
    1. McCrory E, De Brito SA, Viding E. Research review: the neurobiology and genetics of maltreatment and adversity. J Child Psychol Psychiatry. 2010;51:1079–1095. - PubMed
    1. Moffitt TE. Klaus-Grawe 2012 Think Tank: Childhood exposure to violence and lifelong health: clinical intervention science and stress-biology research join forces. Dev. Psychopathol. 2013;25:1619–1634. - PMC - PubMed
    1. Lim L, Radua J, Rubia K. Gray matter abnormalities in childhood maltreatment: a voxel-wise meta-analysis. Am J Psychiatry. 2014;171:854–863. - PubMed
    1. Sapolsky RM. Why Stress Is Bad for Your Brain. Science. 1996;273:749–750. - PubMed

Publication types

MeSH terms

LinkOut - more resources