. 2016 Dec 16;91(1):e01866-16.
doi: 10.1128/JVI.01866-16. Print 2017 Jan 1.

Carbon Monoxide Inhibits Porcine Reproductive and Respiratory Syndrome Virus Replication by the Cyclic GMP/Protein Kinase G and NF-κB Signaling Pathway

Affiliations

Carbon Monoxide Inhibits Porcine Reproductive and Respiratory Syndrome Virus Replication by the Cyclic GMP/Protein Kinase G and NF-κB Signaling Pathway

Angke Zhang et al. J Virol. .

Abstract

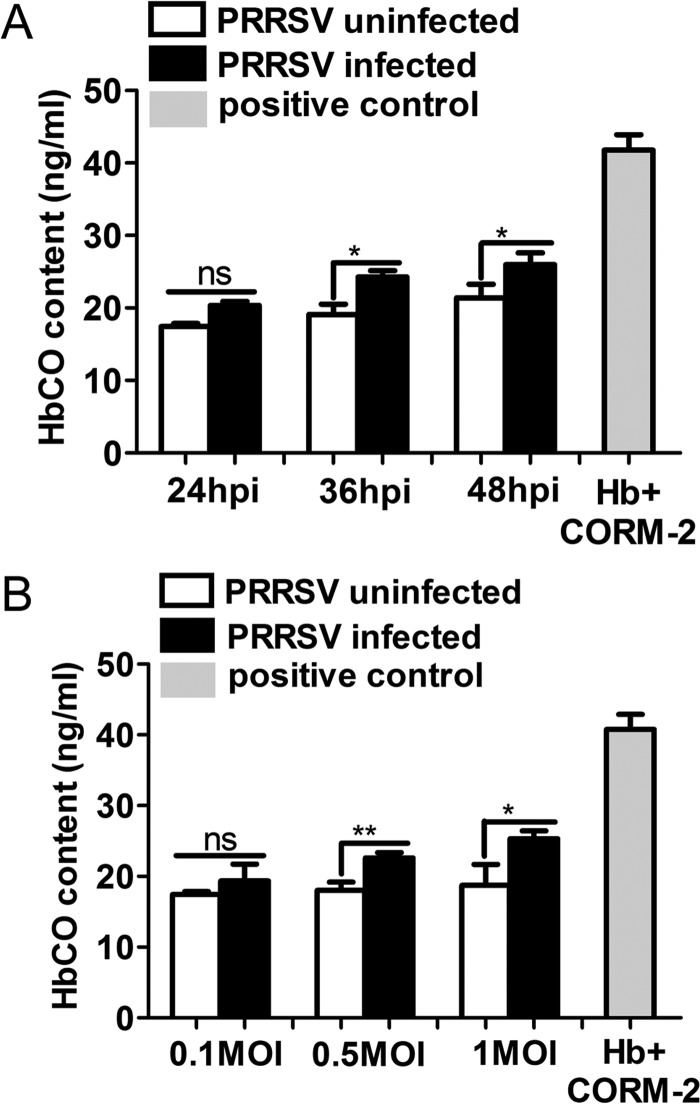
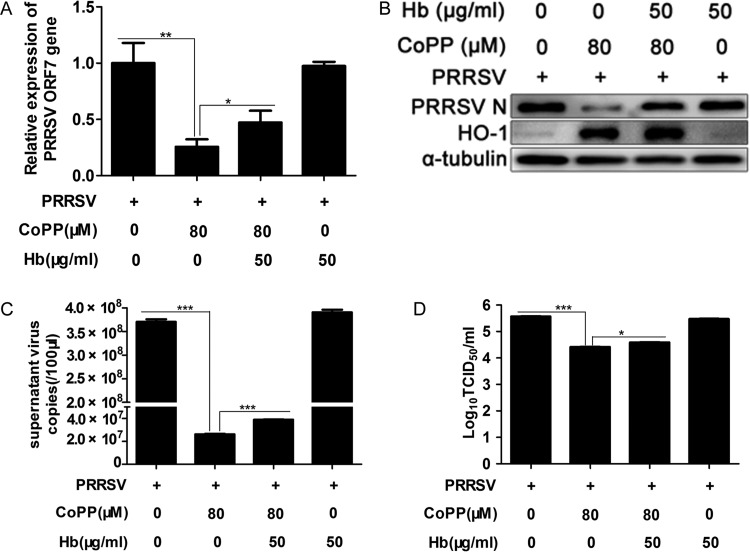
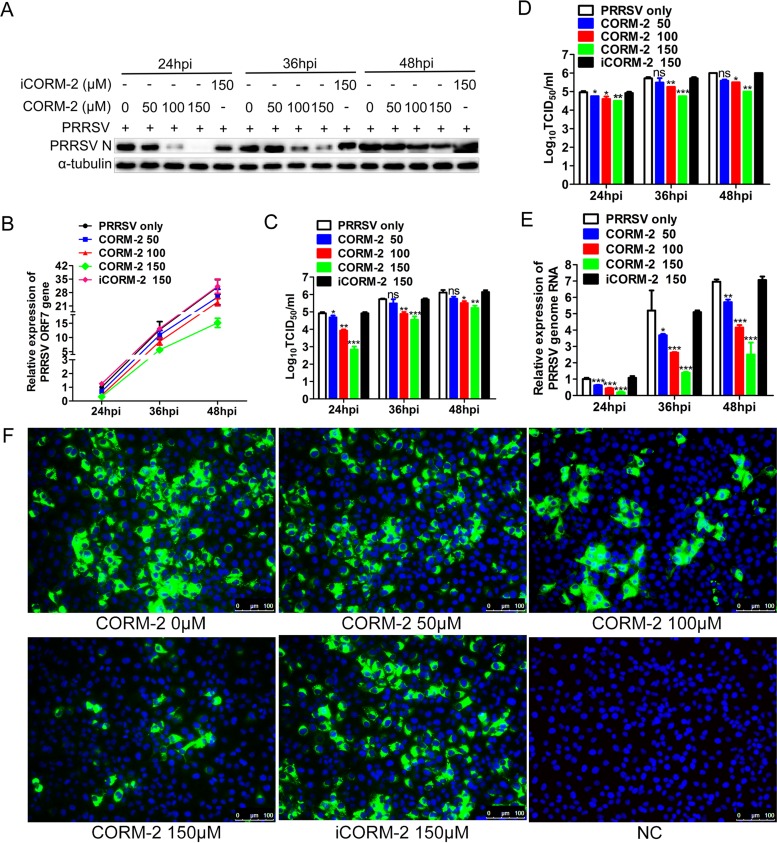
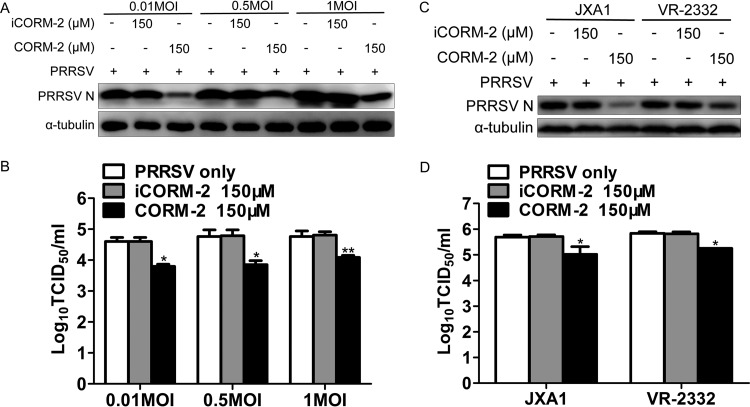
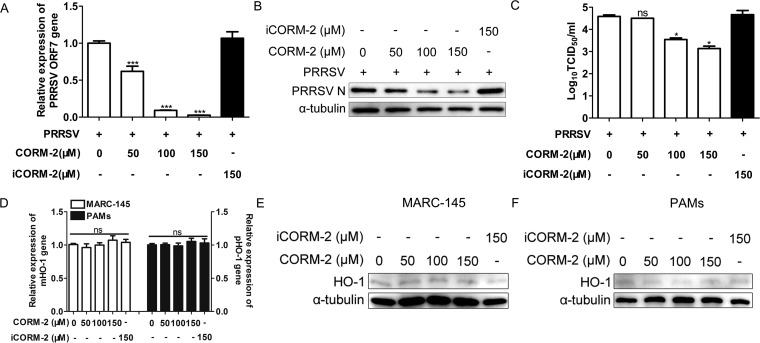
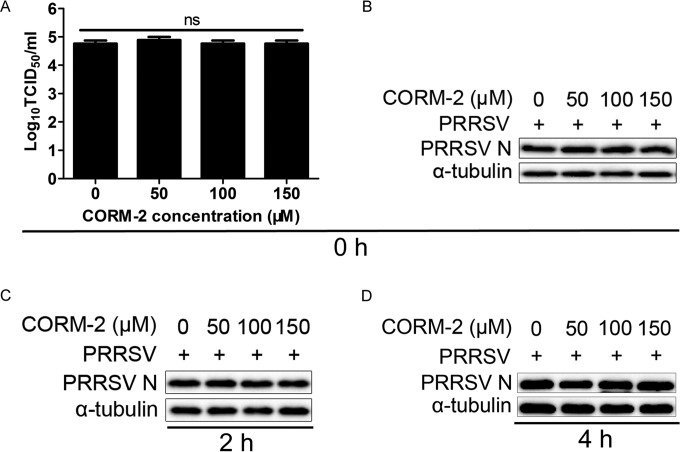
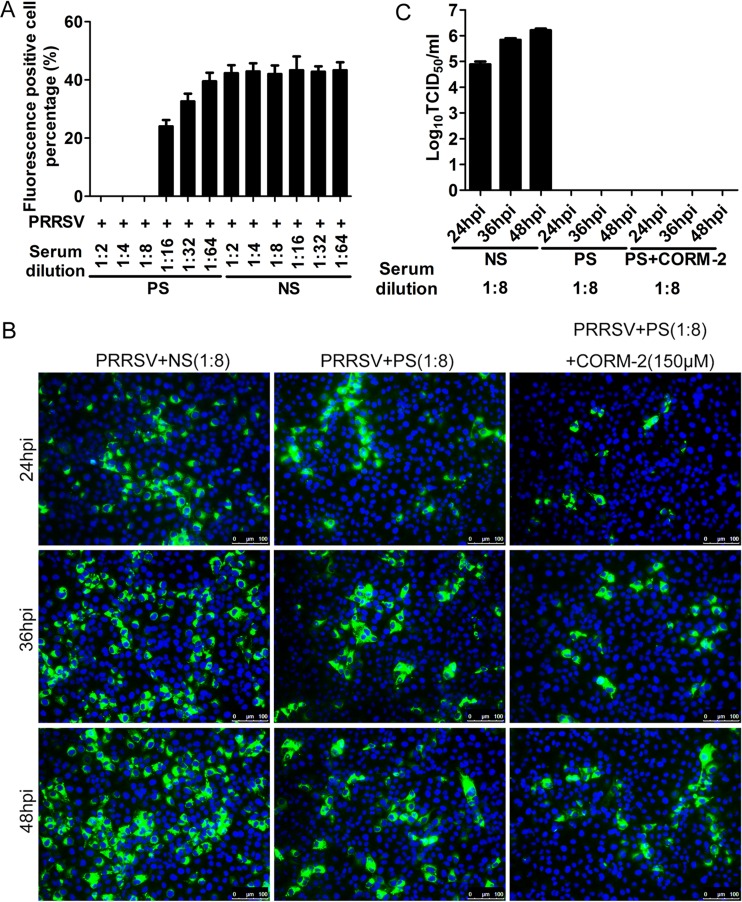
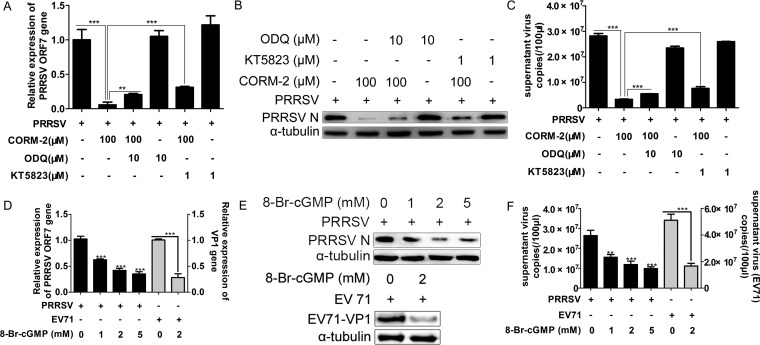
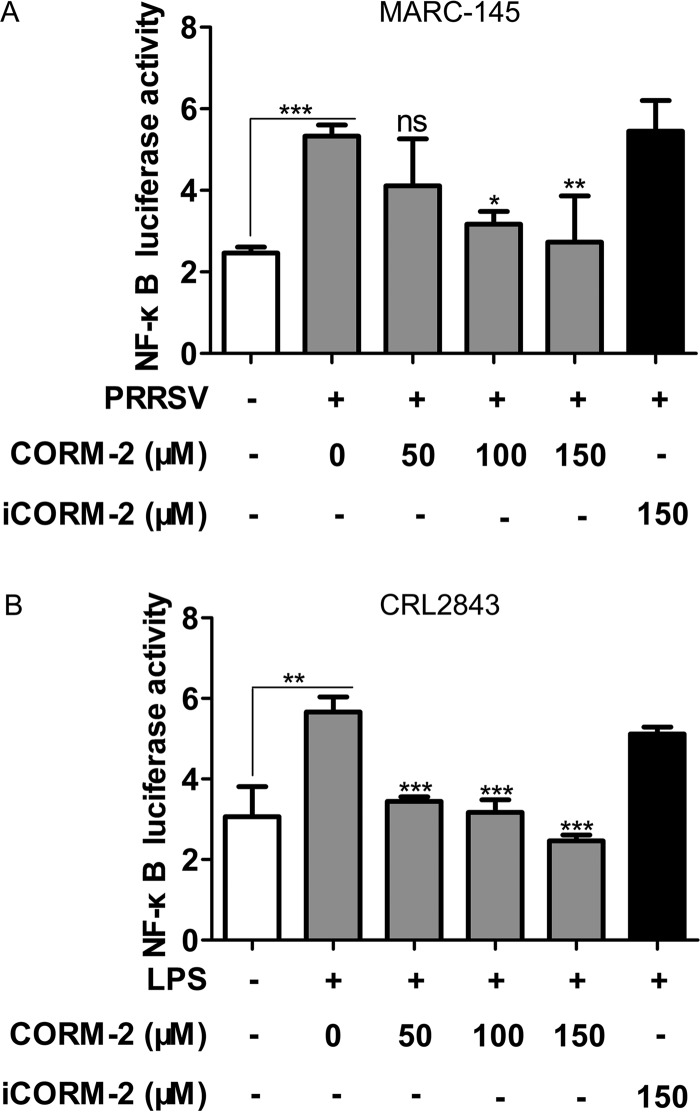
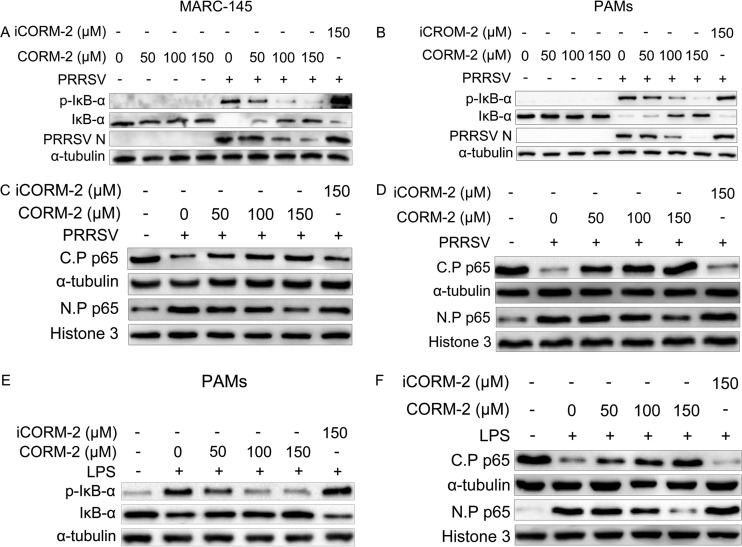
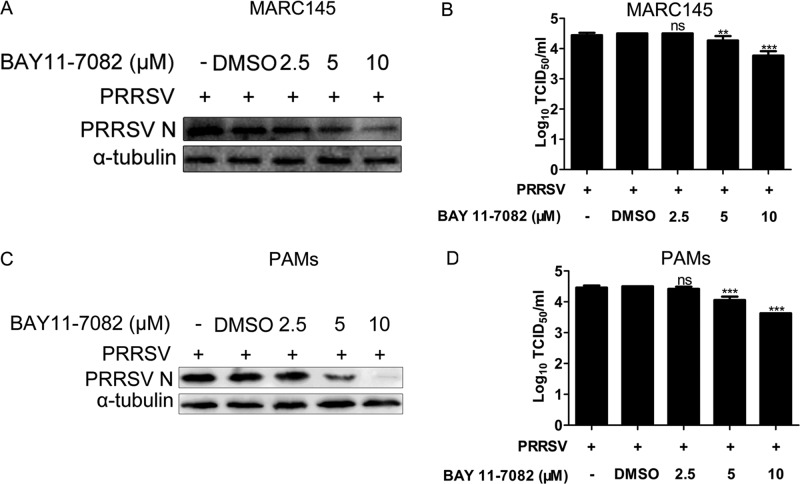
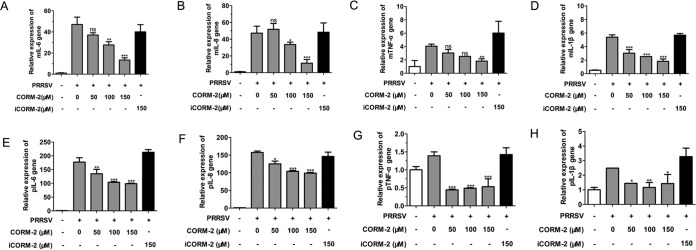
Porcine reproductive and respiratory syndrome virus (PRRSV) causes significant economic losses to the pork industry worldwide each year. Our previous research demonstrated that heme oxygenase-1 (HO-1) can suppress PRRSV replication via an unknown molecular mechanism. In this study, inhibition of PRRSV replication was demonstrated to be mediated by carbon monoxide (CO), a downstream metabolite of HO-1. Using several approaches, we demonstrate that CO significantly inhibited PRRSV replication in both a PRRSV permissive cell line, MARC-145, and the predominant cell type targeted during in vivo PRRSV infection, porcine alveolar macrophages (PAMs). Our results showed that CO inhibited intercellular spread of PRRSV; however, it did not affect PRRSV entry into host cells. Furthermore, CO was found to suppress PRRSV replication via the activation of the cyclic GMP/protein kinase G (cGMP/PKG) signaling pathway. CO significantly inhibits PRRSV-induced NF-κB activation, a required step for PRRSV replication. Moreover, CO significantly reduced PRRSV-induced proinflammatory cytokine mRNA levels. In conclusion, the present study demonstrates that CO exerts its anti-PRRSV effect by activating the cellular cGMP/PKG signaling pathway and by negatively regulating cellular NF-κB signaling. These findings not only provide new insights into the molecular mechanism of HO-1 inhibition of PRRSV replication but also suggest potential new control measures for future PRRSV outbreaks.

Importance: PRRSV causes great economic losses each year to the swine industry worldwide. Carbon monoxide (CO), a metabolite of HO-1, has been shown to have antimicrobial and antiviral activities in infected cells. Our previous research demonstrated that HO-1 can suppress PRRSV replication. Here we show that endogenous CO produced through HO-1 catalysis mediates the antiviral effect of HO-1. CO inhibits PRRSV replication by activating the cellular cGMP/PKG signaling pathway and by negatively regulating cellular NF-κB signaling. These findings not only provide new insights into the molecular mechanism of HO-1 inhibition of PRRSV replication but also suggest potential new control measures for future PRRSV outbreaks.

Keywords: HO-1; NF-κB; PRRSV; cGMP/PKG; carbon monoxide.


Figures

FIG 1
FIG 1
PRRSV infection promotes CO production. (A) MARC-145 cells infected with PRRSV at an MOI of 0.1 were treated with Hb (50 μg/ml) from 1 hpi onward. At 24, 36, and 48 hpi, cell culture supernatants were harvested for HbCO detection by ELISA to quantify HbCO levels as a measure of CO. MARC-145 cells mock infected with PRRSV were included as a control. (B) MARC-145 cells were infected with different doses of PRRSV (MOIs, 0.1, 0.5, and 1), and then the cells were incubated with 50 μg/ml Hb for 24 h. The HbCO contents in culture supernatants were determined by ELISA as a measure of CO. Uninfected MARC-145 cells were included in the analysis as a control. Hb (50 μg/ml) was coincubated with CORM-2 (150 μM) for 1 h, and then the contents of HbCO were detected simultaneously as a positive control (A and B). Data are expressed as the means ± standard deviations (SD) of the results of three independent experiments. P values were calculated using Student's t test. *, P < 0.05; **, P < 0.01; ns, not significant. White columns represent PRRSV-mock-infected MARC-145 cells, black columns represent PRRSV-infected MARC-145 cells, and gray columns represent the positive control.
FIG 2
FIG 2
CO produced by HO-1 catalysis mediates the inhibitory effect of HO-1 on PRRSV replication. MARC-145 cells were pretreated with the CO scavenger Hb (50 μg/ml) for 1 h, and after being washed with PBS three times, the cells were infected with PRRSV at an MOI of 0.1. One hour later, the virus solution was discarded and the cells were treated with 80 μM CoPP in the presence or absence of 50 μg/ml Hb. At 24 hpi, PRRSV ORF7 mRNA (A), N protein (B), extracellular viral RNA (C), and progeny virus production (D) were determined using qPCR, Western blotting, and TCID50 assay. Data are expressed as the means ± SD of the results of three independent experiments. P values were calculated using Student's t test. *, P < 0.05; **, P < 0.01; ***, P < 0.001.
FIG 3
FIG 3
CO inhibits PRRSV replication in MARC-145 cells in a dose-dependent and time duration manner. MARC-145 cells were infected with PRRSV at an MOI of 0.1, and then the cells were incubated with different concentrations of CORM-2 (50 to 150 μM) or iCORM-2 (150 μM) from 1 hpi onward. Cells and culture supernatants were collected at the indicated times; qPCR, Western blotting, and TCID50 assay were performed to determine the levels of viral ORF7 mRNA (B), N protein (A), and intracellular (C) and supernatant (D) virus production. After treatment as described above, cells were harvested at 24, 36, and 48 hpi, respectively. (E) Relative levels of PRRSV RNA were detected with qPCR, using PRRSV NSP2-specific primers; (F) the expression of N protein was determined by IFA at 24 hpi, with MARC-145 cells mock infected with PRRSV included as a control (NC). Data are expressed as the means ± SD of the results of three independent experiments. P values were calculated using analysis of variance (ANOVA). *, P < 0.05; **, P < 0.01; ***, P < 0.001.
FIG 4
FIG 4
The inhibition of viral replication by CO in MARC-145 cells is PRRSV titer and strain independent. (A and B) MARC-145 cells were infected with PRRSV at an MOI of either 0.01, 0.5, or 1 for 1 h and then treated with either CORM-2 (150 μM) or iCORM-2 (150 μM) for 24 h. The expression of intracellular PRRSV N protein and virus titers in supernatants were assayed by Western blotting (A) and TCID50 determination (B), respectively. (C and D) MARC-145 cells were incubated with either JXA1 or VR-2332, each at an MOI of 0.1, for 1 h, followed by treatment with a 150 μM concentration of either CORM-2 or iCORM-2. The expression of intracellular PRRSV N protein and virus titers in the supernatants were assayed by Western blotting (C) and TCID50 determination (D), respectively. Data are expressed as the means ± SD of the results of three independent experiments. P values were calculated using Student's t test. *, P < 0.05; **, P < 0.01.
FIG 5
FIG 5
CO suppresses PRRSV replication in PAMs, and its anti-PRRSV activity is independent of HO-1 induction. (A to C) PAMs were infected with PRRSV at an MOI of 0.1 for 1 h and then incubated in the presence or absence of the indicated concentrations of CORM-2 (50 to 150 μM) or iCORM-2 (150 μM) for 24 h. The levels of ORF7 mRNA (A), N protein (B), and virus titers (C) were assayed by qPCR, Western blotting, and TCID50 determination, respectively. (D to F) MARC-145 cells or PAMs were treated with various concentrations of CORM-2 (50 to 150 μM) or iCORM-2 (150 μM) for 24 h. The cells were then harvested, and the abundance of HO-1 mRNA was determined by qPCR (D) and the expression of HO-1 protein was detected by Western blotting (E and F). Data are expressed as the means ± SD of the results of three independent experiments. P values were calculated using ANOVA. *, P < 0.05; ***, P < 0.001; ns: not significant.
FIG 6
FIG 6
CO does not affect virus entry of the PRRSV life cycle. In the entry assay, the kinetics of the antiviral activity of CO against PRRSV were evaluated with time-of-addition assays. Cells were challenged with PRRSV (MOI of 0.1) for 3 h at 4°C and then incubated at 37°C in the presence of CORM-2 for 6 h. CORM-2 was added at 0, 2, or 4 h (the time point at which the cells were switched to 37°C was set to 0 h). The cells were then rinsed and incubated for another 24 h at 37°C. The inhibitory effects were determined when CORM-2 was added at 0 (A and B), 2 (C), or 4 h (D) after the cells were shifted to 37°C. Data are expressed as the means ± standard deviations of the results of three independent experiments. P values were calculated using ANOVA. ns, not significant.
FIG 7
FIG 7
CO inhibits PRRSV intercellular spread. (A) Standard virus-neutralizing assay. Hyperimmune serum from a PRRSV-infected pig was serially diluted and incubated with the virus for 1 h at 37°C; the virus-antibody complex was then added to the MARC-145 cells. At 24 hpi, the cells were stained with 6D10, and fluorescence-positive cells were counted under the fluorescence microscope. The percentage of fluorescence-positive cells was calculated. (B) CO suppresses the intercellular spread of PRRSV. MARC-145 cells were infected with PRRSV at an MOI of 0.1. At 3 hpi, the negative serum, a 1:8 dilution of the hyperimmune serum, or a 1:8 dilution of the hyperimmune serum plus CORM-2 (150 μM) was added to the infected cells. At 24, 36, or 48 hpi, IFA was performed to detect the expression of N protein. (C) Virus titers of culture supernatants from the experiment described for panel B. The virus titer of culture supernatants was determined by TCID50 assay. NS, negative-control serum from an uninfected pig; PS, hyperimmune serum from a PRRSV-infected pig.
FIG 8
FIG 8
CO inhibits PRRSV replication mediated via the cGMP/PKG signaling pathway. (A to C) MARC-145 cells were infected with PRRSV at an MOI of 0.1 for 1 h, and cells were then treated with either ODQ (10 μM) or KT5823 (1 μM) in the presence or absence of 100 μM CORM-2 for 36 h. The abundance of intracellular ORF7 mRNA and supernatant viral RNA copy numbers were analyzed by qPCR (A and C). Expression of N protein was determined by Western blotting (B). (D to F) MARC-145 cells were treated with various doses of 8-Br-cGMP (1, 2, 5 mM) from 1 hpi onward. Cells and culture supernatants were harvested at 36 hpi for further analysis. PRRSV replication was determined using qPCR for intracellular ORF7 mRNA (D) and supernatant virus copy numbers (F) and Western blotting for PRRSV N protein (E). SK-N-SH cells infected with EV71 (MOI of 0.1) were treated with 2 mM 8-Br-cGMP from 1 hpi onward. Cells were harvested at 24 hpi, and then EV71 VP1 mRNA (D) and supernatant progeny virus production (F) and VP1 protein expression (E) were determined by qPCR and Western blotting, respectively. Data are expressed as the means ± SD of the results of three independent experiments. P values were calculated using Student's t test. **, P < 0.01; ***, P < 0.001.
FIG 9
FIG 9
CO inhibits NF-κB-responsive promoter activity. MARC-145 and CRL2843 cells were transfected with 100 ng/well of pNF-κB-Luc and 50 ng/well of pRL-TK. (A) At 12 h posttransfection, MARC-145 cells were infected with PRRSV at an MOI of 0.1, followed by treatment with various concentrations of CORM-2 or 150 μM iCORM-2 from 1 hpi onward; 36 h after PRRSV infection, cells were lysed for luciferase activity detection. (B) CRL2843 cells were treated with LPS in the presence of various doses of CORM-2 or 150 μM iCORM-2 12 h after transfection. After treatment with LPS for 36 h, the cells were lysed and luciferase activity was measured. Data are expressed as the means ± standard deviations of the results of four independent experiments; P values were calculated using ANOVA. *, P < 0.05; **, P < 0.01; ***, P < 0.001.
FIG 10
FIG 10
CO inhibits PRRSV-induced NF-κB activation. (A and B) MARC-145 cells (A) or PAMs (B) were mock infected or infected with PRRSV (MOI of 0.1) in the presence of CORM-2 (50, 100, and 150 μM) or iCORM-2 (150 μM). At 36 hpi, the cells were harvested and IκB-α, p-IκB-α, and N protein were determined by Western blotting. (C and D) MARC-145 cells (C) or PAMs (D) were mock infected or infected with PRRSV (MOI of 0.1) in the presence or absence of CORM-2 (50, 100, and 150 μM) or iCORM-2 (150 μM) for 36 h. Total cell lysates were separated into nuclear protein (N.P) and cytoplasmic protein (C.P) fractions for detecting the distribution of p65. Histone 3 and α-tubulin were used as nuclear and cytoplasmic controls, respectively. (E) PAMs were treated with LPS in the presence of CORM-2 (50, 100, and 150 μM) or iCORM-2 (150 μM) for 24 h. The cells were harvested, and IκB-α and p-IκB-α were determined by Western blotting. (F) PAMs were treated with LPS in the presence of CORM-2 (50, 100, and 150 μM) or iCORM-2 (150 μM) for 24 h. Total cell lysates were separated into nuclear protein and cytoplasmic protein fractions to detect the distribution of p65. Histone 3 and α-tubulin were used as nuclear and cytoplasmic controls, respectively.
FIG 11
FIG 11
Relationship between NF-κB activity and PRRSV replication. MARC-145 cells and PAMs were pretreated with BAY11-7082 or DMSO for 1 h prior to PRRSV infection. At 36 h postinfection, cells and supernatants were collected for Western blot detection of N protein and TCID50 detection of progeny virus production. Data are expressed as the means ± standard deviations of the results of three independent experiments; P values were calculated using ANOVA. **, P < 0.01; ***, P < 0.001.
FIG 12
FIG 12
CO reduces the inflammatory cytokine mRNA levels in PRRSV-infected MARC-145 cells and PAMs. (A to D) MARC-145 cells were infected with PRRSV (MOI of 0.1) and incubated in the presence or absence of various doses of CORM-2 or iCORM-2. Total RNA was extracted from cell lysates at 24 hpi. The relative expression levels of IL-6 mRNA (A), IL-8 mRNA (B), TNF-α mRNA (C), and IL-1β mRNA (D) were assessed by qPCR. Values were normalized to the internal control β-actin. (E to H) PAMs were treated as described above. The relative expression levels of IL-6 mRNA (E), IL-8 mRNA (F), TNF-α mRNA (G), and IL-1β mRNA (H) were each assessed by qPCR. Values were normalized to the internal control β-actin. The data are representative of three independent experiments performed in triplicate and are shown as the means ± SD. Statistical analysis was performed using ANOVA.*, P < 0.05; **, P < 0.01; ***, P < 0.001.

References

    1. Albina E. 1997. Epidemiology of porcine reproductive and respiratory syndrome (PRRS): an overview. Vet Microbiol 55:309–316. doi: 10.1016/S0378-1135(96)01322-3. - DOI - PubMed
    1. Cavanagh D. 1997. Nidovirales: a new order comprising Coronaviridae and Arteriviridae. Arch Virol 142:629–633. - PubMed
    1. Pejsak Z, Stadejek T, Markowska-Daniel I. 1997. Clinical signs and economic losses caused by porcine reproductive and respiratory syndrome virus in a large breeding farm. Vet Microbiol 55:317–322. doi: 10.1016/S0378-1135(96)01326-0. - DOI - PubMed
    1. Darwich L, Diaz I, Mateu E. 2010. Certainties, doubts and hypotheses in porcine reproductive and respiratory syndrome virus immunobiology. Virus Res 154:123–132. doi: 10.1016/j.virusres.2010.07.017. - DOI - PubMed
    1. Meng XJ. 2000. Heterogeneity of porcine reproductive and respiratory syndrome virus: implications for current vaccine efficacy and future vaccine development. Vet Microbiol 74:309–329. doi: 10.1016/S0378-1135(00)00196-6. - DOI - PMC - PubMed

MeSH terms