. 2016 Oct 31:7:13195.
doi: 10.1038/ncomms13195.

Evolution of heterogeneous genome differentiation across multiple contact zones in a crow species complex

Affiliations

Evolution of heterogeneous genome differentiation across multiple contact zones in a crow species complex

Nagarjun Vijay et al. Nat Commun. .

Abstract

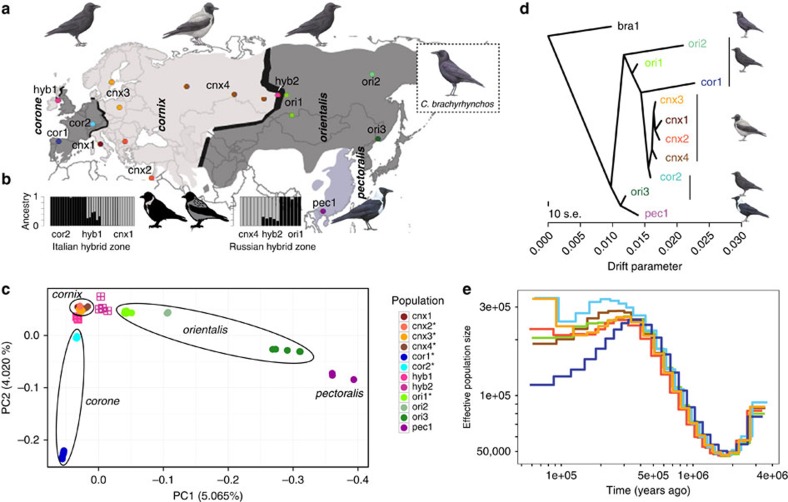
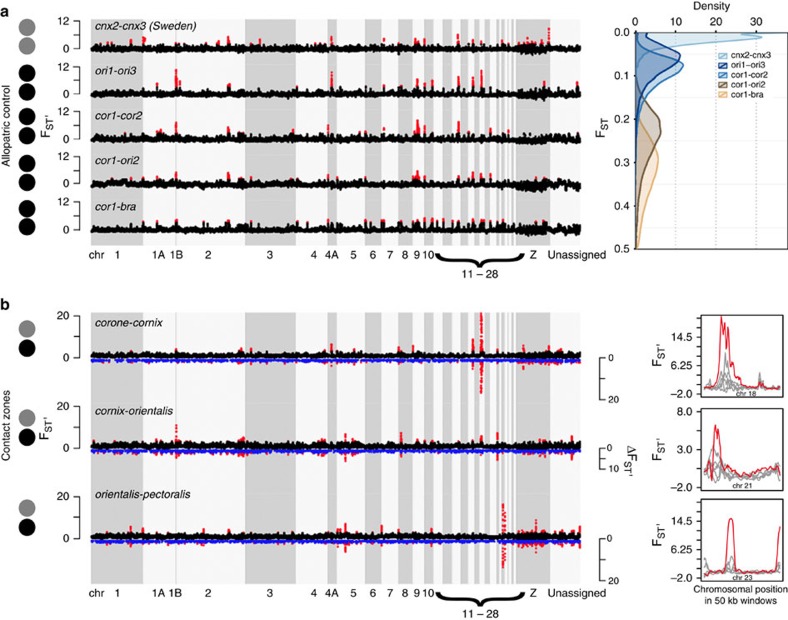
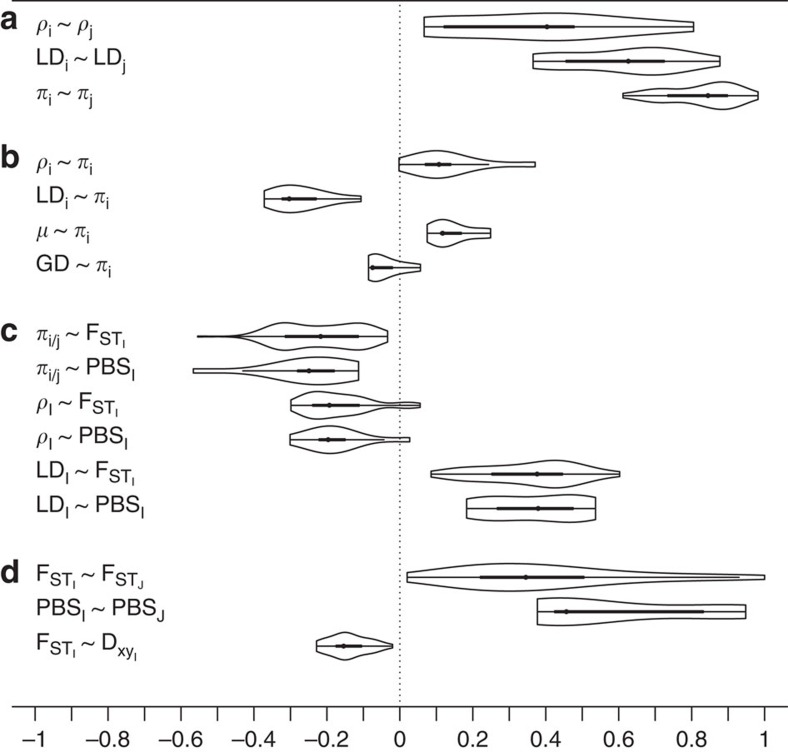
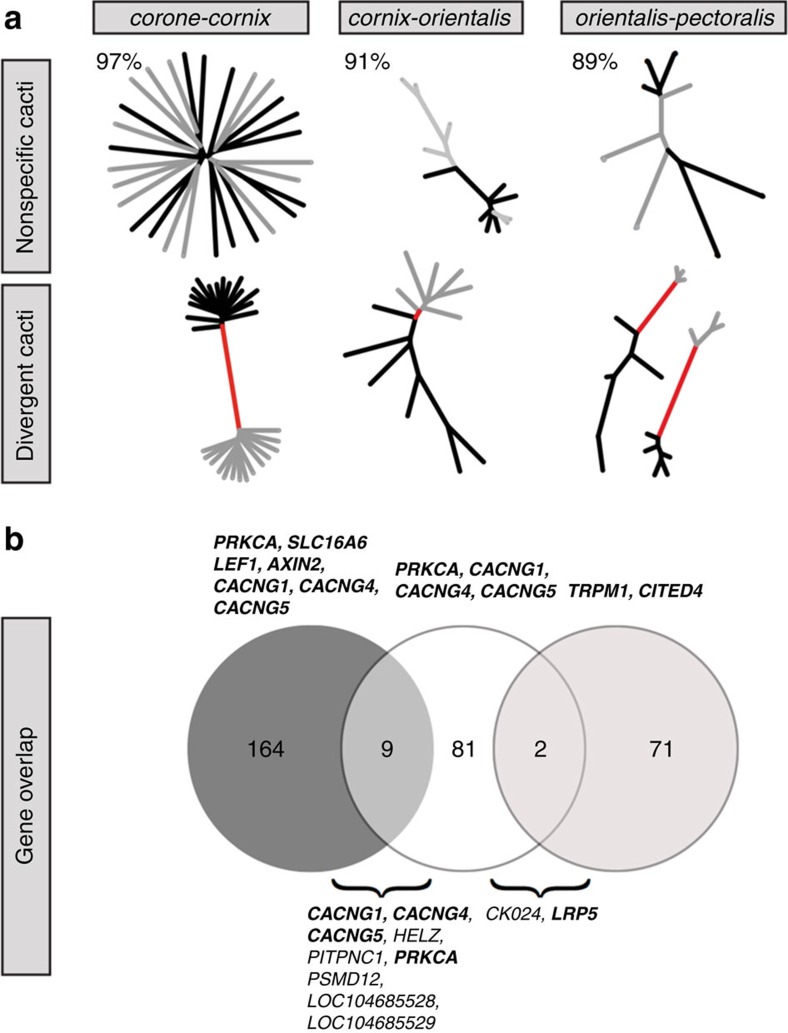
Uncovering the genetic basis of species diversification is a central goal in evolutionary biology. Yet, the link between the accumulation of genomic changes during population divergence and the evolutionary forces promoting reproductive isolation is poorly understood. Here, we analysed 124 genomes of crow populations with various degrees of genome-wide differentiation, with parallelism of a sexually selected plumage phenotype, and ongoing hybridization. Overall, heterogeneity in genetic differentiation along the genome was best explained by linked selection exposed on a shared genome architecture. Superimposed on this common background, we identified genomic regions with signatures of selection specific to independent phenotypic contact zones. Candidate pigmentation genes with evidence for divergent selection were only partly shared, suggesting context-dependent selection on a multigenic trait architecture and parallelism by pathway rather than by repeated single-gene effects. This study provides insight into how various forms of selection shape genome-wide patterns of genomic differentiation as populations diverge.


Figures

Figure 1
Figure 1. Population structure and demographic history.
(a) Distribution map of the Corvus (corone) spp. species complex displaying sampling location, taxon name and phenotype (area shading: light-grey=hooded, grey=collared, dark-grey=all-black). Well-characterized hybrid zones are shown as black solid lines. The all-black American crow C. brachyrhynchos is confined to North America. Abbreviations and colours indicating population units are maintained throughout: cor=C. (c.) corone; cnx=C. (c.) cornix, ori=C. (c.) orientalis, pec=C. (c.) pectoralis, bra=C. brachyrhynchos. Crow drawings courtesy of Dan Zetterström. See Supplementary Methods for map details. (b) Ancestry coefficients of hybrids and individuals of adjacent parental populations. Genetic clusters are coloured in correspondence to the phenotype of parental populations (black=all-black, grey=hooded). Interspersed are representative images of hybrid phenotypes. (c) Main principle component axes partitioning genetic variation of 16.6 million single-nucleotide variants segregating across all populations. PC1 explained 5.0% of the genetic variation mainly separating corone/cornix, orientalis and pectoralis, PC2 (4%) mainly accounted for variation due to the Spanish corone population. (d) Evolutionary relationships as inferred by TreeMix rooted with the American Crow. (e) Changes in effective population size (Ne) through time as inferred by multiple sequential Markovian coalescent analyses shown for representative individuals from a subset of populations (marked with a star in c).
Figure 2
Figure 2. Heterogeneous genomic landscapes of genetic differentiation.
(a) Left: standardized genetic differentiation FST' in 50 kb windows across the genome between a set of five control population comparisons of the same colour phenotype. The y-axis represents s.d.'s of a standard normal distribution. Right: population comparisons span a broad range of absolute genetic differentiation FST. (b) Left: standardized genetic differentiation FST' (black, positive axis) and net genetic differentiation ΔFST' (blue, mirrored to the negative axis) in 50 kb windows across the genome between target population comparisons across contact zones (Fig. 1a). Genomic regions of extreme differentiation (>99th percentile) are shown in red for both FST' and ΔFST'. Note that the y-axis is drawn to scale for a and b. Right: examples of outlier regions with the most extreme amplitudes in any of the three comparisons (grey: control, red: target comparisons). Note the different scale on the y-axis.
Figure 3
Figure 3. Evidence for linked selection shared among populations.
Distribution of correlation coefficients (Pearson's r) for population summary statistics shown as box plots with kernel densities drawn on each side. Note that the vast majority of correlations do not overlap zero. Correlations are shown for intra-population summary statistics (a) between populations, (b) within populations, (c) in comparison with inter-population (differentiation) statistics and (d) for inter-populations statistics of population pairs (comparing differentiation/divergence landscapes). Box margins indicate the interquartile range between 25 and 75% quantiles, whiskers extend to 1.5-times the interquartile range encompassing 99.3% of the distribution. Subscripts ‘i, j' symbolize all possible combinations between two populations i=1...n and j=i+1....n for within-populations measures; Capital letters ‘I, J' symbolize inter-population statistics. Correlations exclude pseudo-replicated population comparisons (for example, I=ori1,cnx1, J=ori1,pec).
Figure 4
Figure 4. Localized phylogenetic patterns and candidate gene overlap.
(a) Illustration of HMM-SOM local phylogenetic reconstructions (‘cacti') across each of the target zones of contact and phenotypic transition. Most of segregating variation across the genome (indicated in percentage) is represented by ‘non-specific cacti' holding no information on population provenance (grey tips: hooded phenotype, black tips: all-black crows). Much rarer ‘divergent cacti' separate individuals by population and phenotype (red branches). (b) Venn diagrams illustrating the number of candidate outlier genes for each specific contact zone (in the same order as in a) and the degree of overlap between population pairs. Melanogenesis outlier genes are listed for the contact zones; for the overlap all genes are listed by name with those involved in melanogenesis shown in bold.

References

    1. Wolf J. B. W., Lindell J. & Backstrom N. Speciation genetics: current status and evolving approaches. Philos. Trans. R. Soc. B Biol. Sci. 365, 1717–1733 (2010). - PMC - PubMed
    1. Seehausen O. et al.. Genomics and the origin of species. Nat. Rev. Genet. 15, 176–192 (2014). - PubMed
    1. Ellegren H. et al.. The genomic landscape of species divergence in Ficedula flycatchers. Nature 491, 756–760 (2012). - PubMed
    1. Renaut S. et al.. Genomic islands of divergence are not affected by geography of speciation in sunflowers. Nat. Commun. 4, 1827 (2013). - PubMed
    1. Kronforst M. R. et al.. Hybridization reveals the evolving genomic architecture of speciation. Cell Rep. 5, 666–677 (2013). - PMC - PubMed

Publication types

LinkOut - more resources