. 2016 Oct 31:7:13307.
doi: 10.1038/ncomms13307.

EGFR oligomerization organizes kinase-active dimers into competent signalling platforms

Affiliations

EGFR oligomerization organizes kinase-active dimers into competent signalling platforms

Sarah R Needham et al. Nat Commun. .

Abstract

Epidermal growth factor receptor (EGFR) signalling is activated by ligand-induced receptor dimerization. Notably, ligand binding also induces EGFR oligomerization, but the structures and functions of the oligomers are poorly understood. Here, we use fluorophore localization imaging with photobleaching to probe the structure of EGFR oligomers. We find that at physiological epidermal growth factor (EGF) concentrations, EGFR assembles into oligomers, as indicated by pairwise distances of receptor-bound fluorophore-conjugated EGF ligands. The pairwise ligand distances correspond well with the predictions of our structural model of the oligomers constructed from molecular dynamics simulations. The model suggests that oligomerization is mediated extracellularly by unoccupied ligand-binding sites and that oligomerization organizes kinase-active dimers in ways optimal for auto-phosphorylation in trans between neighbouring dimers. We argue that ligand-induced oligomerization is essential to the regulation of EGFR signalling.


Figures

Figure 1
Figure 1. FLImP measurement of pairwise EGF separations.
(a) Cartoon of an EGFR monomer, a two-ligand active dimer, and an EGFR sequence diagram. (b) Steps to determine EGF separations using FLImP: (1) TIRF images are collected from intact cells; (2) spots from individual complexes are tracked to derive intensity time courses; and (3) a spot image of a complex containing two fluorophore-conjugated EGF ligands (red dots) features two intensity levels and decays to zero in two bleaching steps; when one fluorophore bleaches, the centroid position shifts. If more than two steps occur, the lowest two are analysed. (4) A global least-squares seven-parameter-fit is used to identify the best intensity, x-y positions and the full-width at half-maximum of the point spread function for each fluorophore, from which their separation formula image 
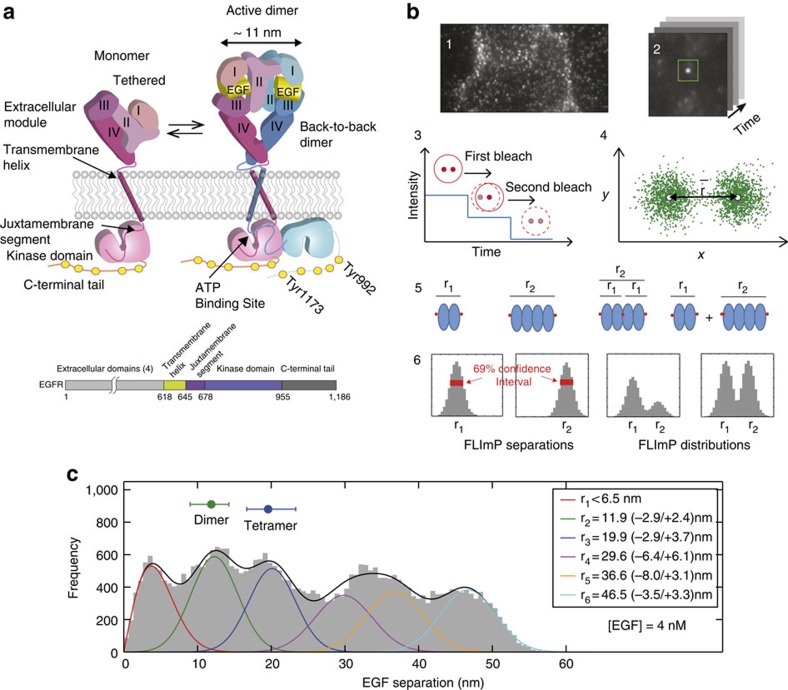
is calculated with a precision determined by the localization error; (5) Example systems of a two-ligand dimer and tetramer, a three-ligand tetramer, and a mixture of a dimer and a tetramer. (6) The empirical posterior distributions (or FLImP measurement) of pairwise ligand separations obtained for each example system with their 69% confidence intervals highlighted. The size of the latter depends on the combined localization errors of the two molecules. FLImP measurements with confidence intervals smaller than the required resolution are retained in a histogram, generating a so-called FLImP distribution that is fitted by the sum of a discrete number of Rician peaks (Supplementary Fig. 3a). (c) FLImP distribution (grey) of CF640R fluorophore-conjugated EGF on CHO cells (∼105 copies of wild-type EGFR per cell) treated with 4 nM EGF at 4 °C with chemical fixation, compiled from 30 FLImP measurements with confidence intervals <4.8 nm. The distribution is decomposed into a sum of six Rician peaks. Positions and error estimates are shown in the inset. (Details in Supplementary Methods.) The peak positions (and error bars) reflecting the expected dimers and tetramers are marked above the plot. The optimal number of peak components (colour lines) and the best-fit (black line) were determined using a Bayesian information criterion and Bayesian parameter estimation (Supplementary Figs 3b and 4a, and Supplementary Methods).
Figure 2
Figure 2. The structural model of EGFR tetramers.
(a) Key steps in constructing the model of a ligand-bound EGFR tetramer: (1) an initial EGFR dimer model generated using a crystal structure of a HER3 dimer as a template; (2) a face-to-face dimer produced by simulation of the initial dimer model, in which the interaction interface remained unchanged but domains I–III in each monomer departed from the tethered conformation for the conformation seen in the active dimer; (3) domains IV are manually modelled to mimic the conformation of monomers in an active dimer; and (4) a tetramer model constructed by adding two-ligand-bound monomers in back-to-back interactions with the previous dimer. In addition to the ribbons generated using atomic coordinates, cartoon figures are used to illustrate the modeling procedure. (b) The site for the face-to-face interaction (purple) and the outline of the largely overlapping EGF binding site at domains I and III. (c) A diagram illustrating the open-ended oligomerization scheme for EGFR extracellular domains based on repeating the back-to-back and the face-to-face interactions. (d) The full-length structural model of an EGFR tetramer as a dimer of active dimers assembled by the face-to-face interactions. The predicted separation between the N-termini of the two EGF ligands and the average EGF-membrane distance are marked. The coordinates of the model are available in Supplementary Data. (e) The arrangement of the two intracellular active kinase dimers in the tetramer model, by which the phosphorylation site Tyr992 (green) of one receptor is positioned in the proximity of the active site (red) of a kinase domain from the neighbouring dimer.
Figure 3
Figure 3. Pairwise EGF separations in three EGFR deletion mutants.
(a) (left) FLImP distribution (grey) of pairwise EGF separations on CHO cells expressing ΔC-EGFR treated with 4 nM EGF. The distribution is fitted (black line) with a sum of four Rician peaks (colour lines). The number of peaks used was determined using a Bayesian information criterion. The best-fit positions of the peaks and error bars are shown in the inset. The errors in the fit were calculated as described in Supplementary Methods. (right) The FLImP distribution (grey) and the distributions (green or yellow) compiled from the FLImP measurements whose ranges of 69% confidence overlap with the ranges of EGF separations of the expected dimer (12.5±0.3 nm) or tetramer (19.6±0.5 nm), which are indicated by the vertical blue lines. (b) Similar to a for C'698 EGFR. (c) Similar to a for C'973 EGFR. Cells stably expressed each mutant at an expression level of ∼105 copies per cell. (d) Similar to a for the wild-type receptor respectively treated with 4 and 100 nM EGF. The numbers of FLImP measurements included in each distribution are 40 (ΔC-EGFR), 44 (c'698-EGFR), 33 (c'973-EGFR), 51 (wild type receptor at 4 nM EGF), and 37 (wild type receptor at 100 nM EGF); the confidence interval for each included FLImP measurement is 6 nm (d) or 7 nm (ac). (e) Relative populations of the dimers and the tetramers, determined from the FLImP measurements shown in ad, right hand panels. For each construct, the dimer percentage is estimated by the ratio of the green integral area to the integral area of all FLImP measurements whose 69% confidence overlaps with the dimer-tetramer region (0–20.1 nm). Tetramer populations are calculated in the same way, using the yellow instead of the green integral area. Error bars were calculated by bootstrap-resampling the data 1,000 times with replacement and repeating the analysis.
Figure 4
Figure 4. Dependence of EGFR phosphorylation and oligomerization-related structural parameters on ligand concentration.
(a) Western blot measurement of wild type total EGFR auto-phosphorylation in CHO cells exposed to increasing concentrations of EGF. The monoclonal pan-phosphotyrosine antibody 4G10 was used in the measurements. Data points and standard deviations are derived from the average of three independent measurements (examples western blot images shown in Supplementary Fig. 6c). (b) Similar to Fig. 3e, estimate of the relative population of EGFR dimers. The estimates are based on the wild-type FLImP distributions at varying EGF concentrations (Fig. 3e and Supplementary Fig. 7). Errors are calculated as in Fig. 3. (c) Western blot measurements of phosphorylation of Tyr1173 and Tyr992 in CHO cells exposed to increasing EGF concentrations. Data points and error bars (s.d.) are derived from the average of four independent measurements (examples shown in Supplementary Fig. 6a,b). For the Tyr992 data, P values were calculated using Student's t-test to determine whether measured phosphorylation at high EGF concentrations was significantly different from the maximum phosphorylation value measured at 100 nM EGF. P values are: 50 nM EGF, P=0.058; 200 nM EGF, P=0.173; 500 nM EGF, P=0.027; 1,000 nM EGF, P=0.014; 2,000 nM EGF, P=0.011; 5,000 nM EGF, P=0.009. (d) The DOCA between EGFR-bound EGF molecules and the membrane, derived from FRET measurements shown in Supplementary Fig. 8. DOCAs were obtained from 1,000 bootstrap data sets (that is, data sets resampled with replacement). The error bars are the standard deviations of the bootstrap means. Simulations of the tetramer (Fig. 2d and Supplementary Fig. 5c) and dimer (bottom left inset) predict a DOCA of ∼5 nm for oligomers and ∼7.5 nm for dimers.
Figure 5
Figure 5. Pairwise EGF separations and phosphorylation of R647C/V650C.
(a) FLImP distribution (grey) of pairwise EGF separations on CHO cells expressing the R647C/V650C-EGFR mutant at a level of ∼105 copies per cell. The separations whose confidence intervals overlap with the 12.5±0.3 nm (green) or 19.6±0.5 nm (yellow) expected dimer and tetramer interval are shown. The expected intervals are indicated by the vertical blue lines. The distribution includes data from 40 FLImP measurements with confidence intervals <6 nm. (b) Peak decomposition (colour lines) and best-fit (continuous black line) of the FLImP distribution. The optimal number of underlying peak components (colour lines) and the best-fit (black line) were determined using a Bayesian information criterion. The best-fit positions of the peaks and error bars are shown in the inset. (c) Similar to Fig. 3e, an estimate of the relative populations of dimers and tetramers. (d) Comparison of EGFR R647C/V650C and the wild-type receptor in terms of DOCA distances between receptor-bound EGF molecules and the membrane at 4 nM EGF derived from FRET measurements shown in Supplementary Fig. 8f. (e) Overall and (f) Tyr1173-specific phosphorylation of EGFR R647C/V650C compared with the wild type at 100 nM EGF. The data points and error bars (s.d.) are obtained from three independent measurements. An example is shown Supplementary Fig. 6d.
Figure 6
Figure 6. Membrane bending and EGFR oligomerization.
(a) Percentage of separations whose 69% confidence intervals overlap with the dimer/tetramer range (r<20.1 nm) or do not (r> 20.1 nm), estimated by the ratio of the integral area of interest (purple or salmon in FLImP distributions, Supplementary Fig. 7) to the integral area of the distribution. (b) FLImP distribution (grey) of pairwise separations of fluorophore-conjugated EGF on CHO cells expressing ∼105 copies of wild-type EGFR treated with 400 nM EGF (46 measurements). The distribution is fitted (black line) with a sum of five Rician peaks (colour lines). Best-fit positions and error bars shown in the inset. (c) (green) MSD plot from single-particle tracks of wild-type EGFR complexes on live CHO cells at 37 °C labelled with Alexa 488-conjugated EGF; (dark blue) MSD plot from single-particle tracks of PIP2 labelled with a PLCδ1-Pleckstrin homology (PH) domain (PH-eGFP) fusion construct which specifically binds PiP2 (ref. 75), transfected on CHO cells expressing wild-type EGFR. MSD plots include data from ∼>103 tracks and three biological repeats. Bootstrap-estimated errors (vertical line) are shown. Linear MSD plots suggest Brownian motion; concave-down MSD plots suggest confinement at the plasma membrane. (d) The negative curvature of the membrane local to an EGFR tetramer in simulation. The cartoon illustrates the membrane-bending effect of the N-terminal dimers of EGFR transmembrane helices as a hydrophobic wedge. (e) FLImP distribution (grey) of pairwise separations of fluorophore-conjugated EGF on the surface of CHO cells expressing ∼105 copies of wild-type EGFR pre-treated with 10 mM MβCD, exposed to 4 nM EGF (33 measurements). Best-fit positions and error bars are shown in the inset. (f) Membrane thickness (Y-axis) as a function of distance to the transmembrane helices (X-axis) in simulations of the wild-type active dimer and tetramer, and the palmitoylated R647C/V650C tetramer. The membrane thickness is indicated by the average separation between the two sheets of phosphorus atoms of the two lipid layers. The wild-type tetramer (red line) exhibited a more pronounced membrane-thinning effect. The data are plotted as averages and standard error of the mean over frames of the simulations.
Figure 7
Figure 7. The tethered ectodomain signature in FLImP distributions.
(a) FLImP distribution (grey) of pairwise separations of fluorophore-conjugated EGF bound to EGFR on CHO cells treated with 4 nM EGF (identical data as shown in Fig. 3d) and the distribution (yellow) compiled from all FLImP measurements whose 69% confidence interval overlaps with the range of 0–8 nm for the inactive dimers. (b) Similar to a, FLImP distribution of cells treated with 4 nM anti-EGFR Affibody. (c) Similar to b on cells pre-treated with 200 nM 9G8 nanobody and 4 nM Affibody. The distributions in b,c contain data from 37 and 33 FLImP measurements, respectively. The expected range of separations for dimers is indicated by the vertical blue lines. (d) Estimate of the relative population of the inactive dimers as indicated by ratio of the yellow integral area to the corresponding total grey integral area. Errors are calculated as described in Fig. 3.

References

    1. Lemmon M. A. & Schlessinger J. Cell signaling by receptor tyrosine kinases. Cell 141, 1117–1134 (2010). - PMC - PubMed
    1. Roskoski R. Jr The ErbB/HER family of protein-tyrosine kinases and cancer. Pharmacol. Res. 79, 34–74 (2014). - PubMed
    1. Hynes N. E. & Lane H. A. ERBB receptors and cancer: the complexity of targeted inhibitors. Nat. Rev. Cancer 5, 341–354 (2005). - PubMed
    1. Ullrich A. & Schlessinger J. Signal transduction by receptors with tyrosine kinase activity. Cell 61, 203–212 (1990). - PubMed
    1. Yarden Y. & Schlessinger J. Self-phosphorylation of epidermal growth-factor receptor - evidence for a model of intermolecular allosteric activation. Biochemistry 26, 1434–1442 (1987). - PubMed

Publication types