. 2016 Oct 31:7:13133.
doi: 10.1038/ncomms13133.

Hair cell force generation does not amplify or tune vibrations within the chicken basilar papilla

Affiliations

Hair cell force generation does not amplify or tune vibrations within the chicken basilar papilla

Anping Xia et al. Nat Commun. .

Abstract

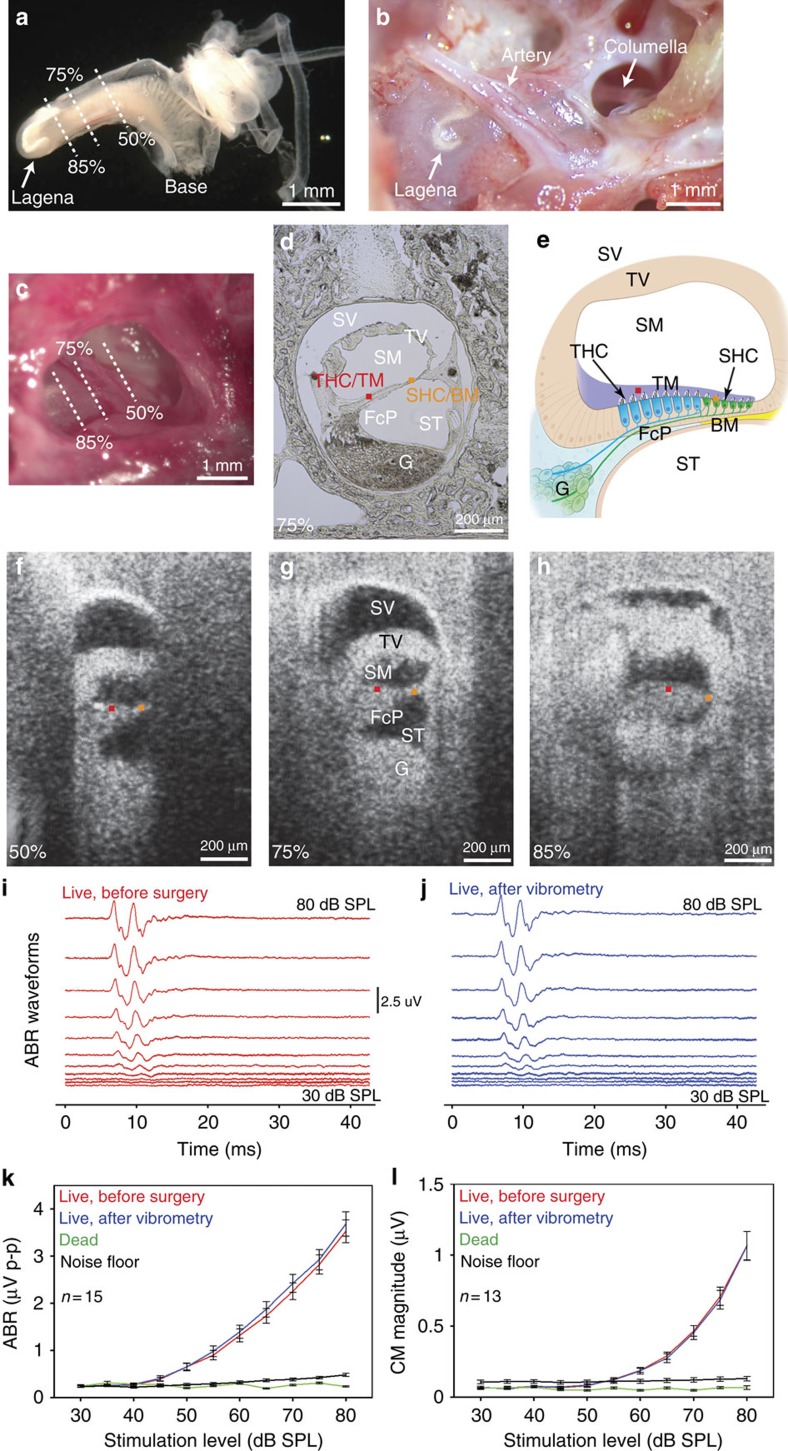
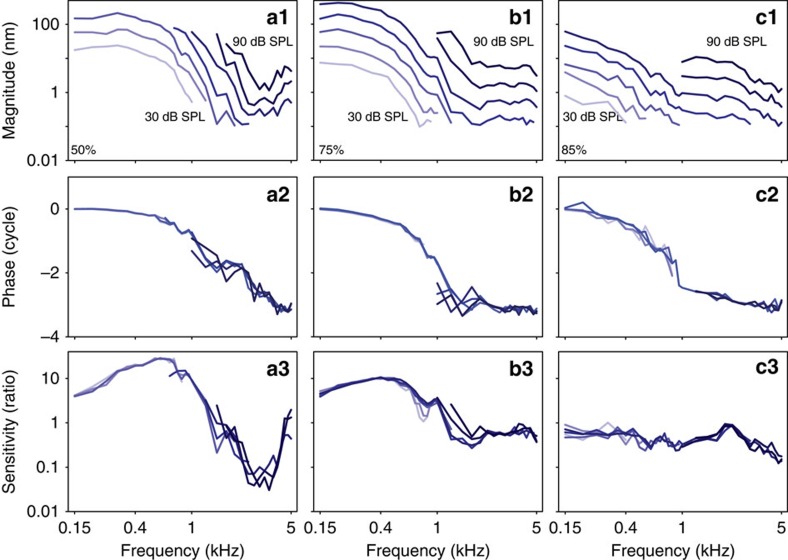
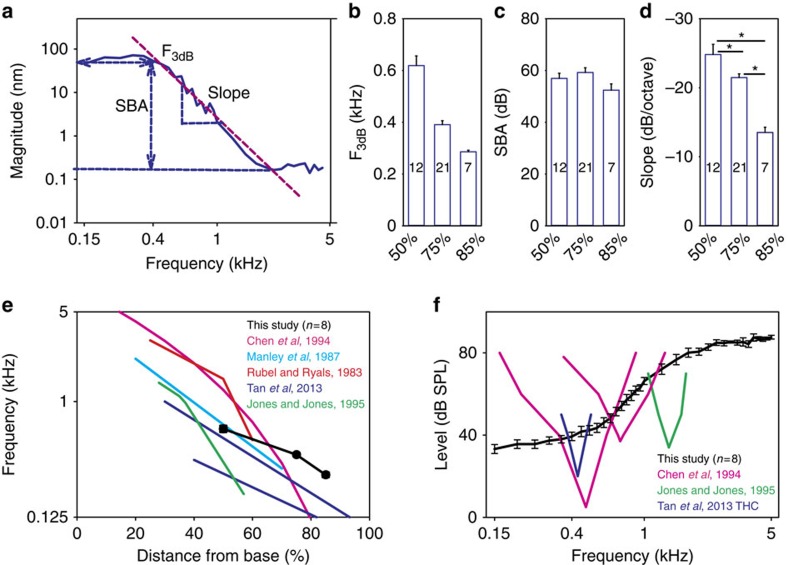
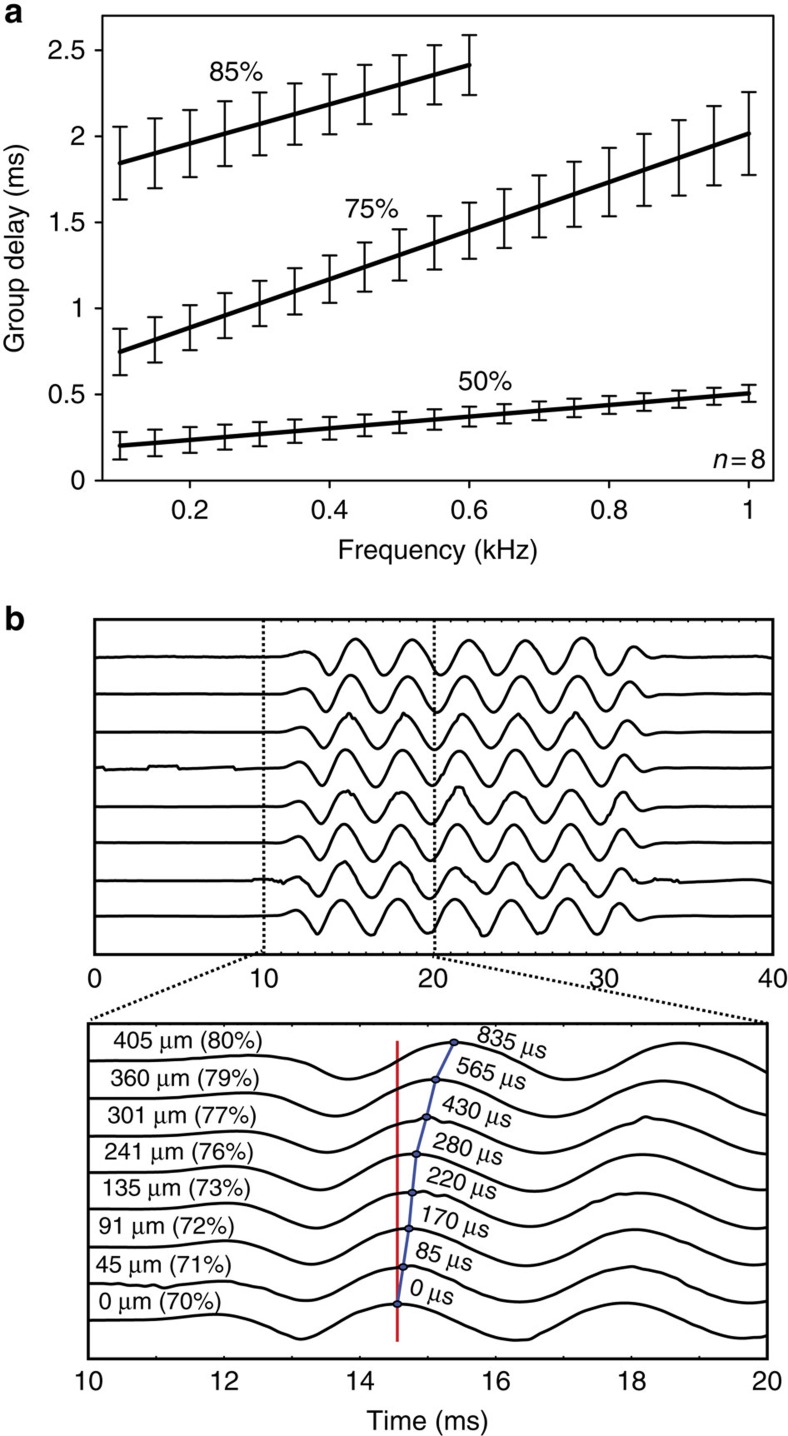
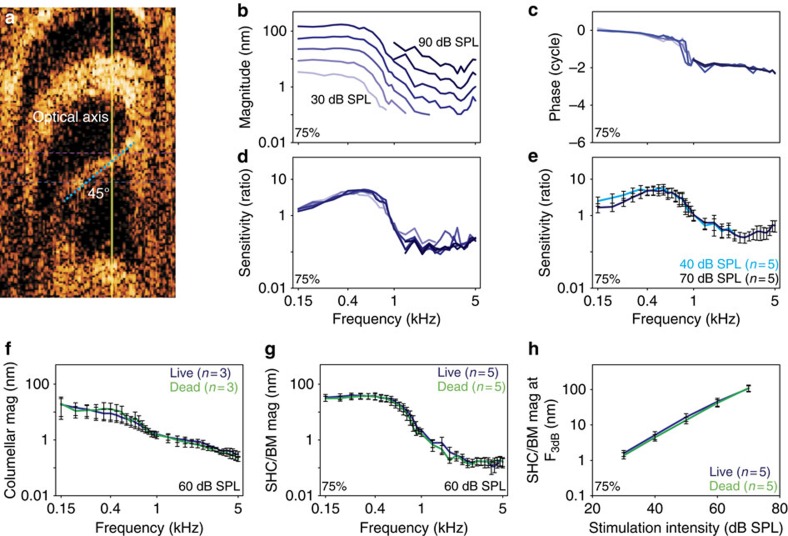
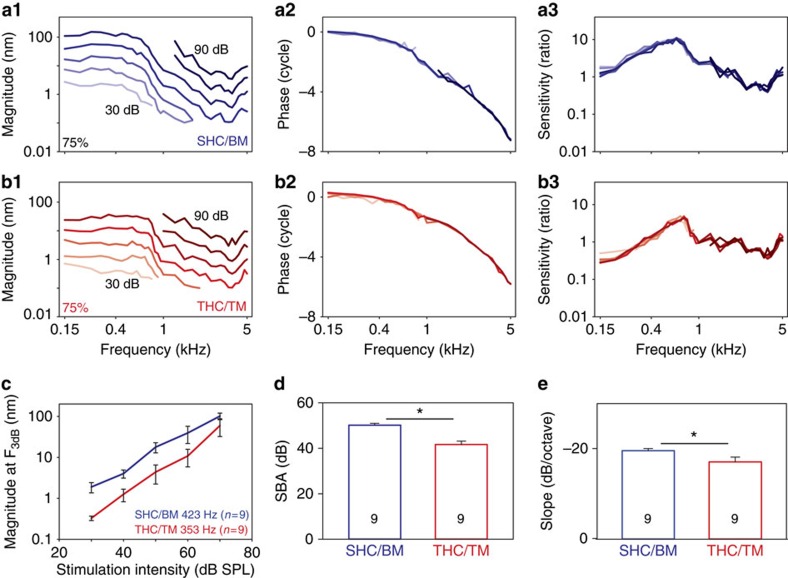
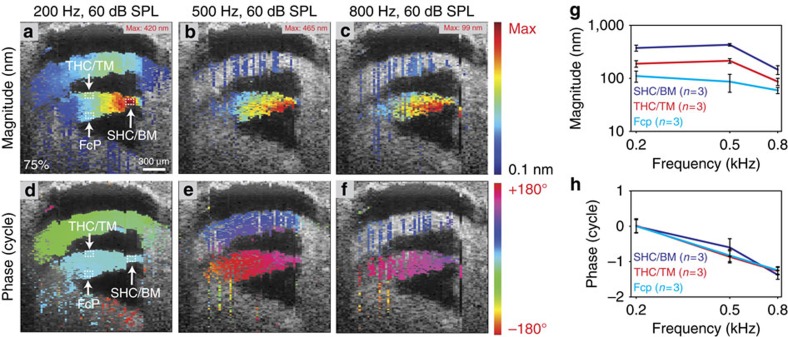
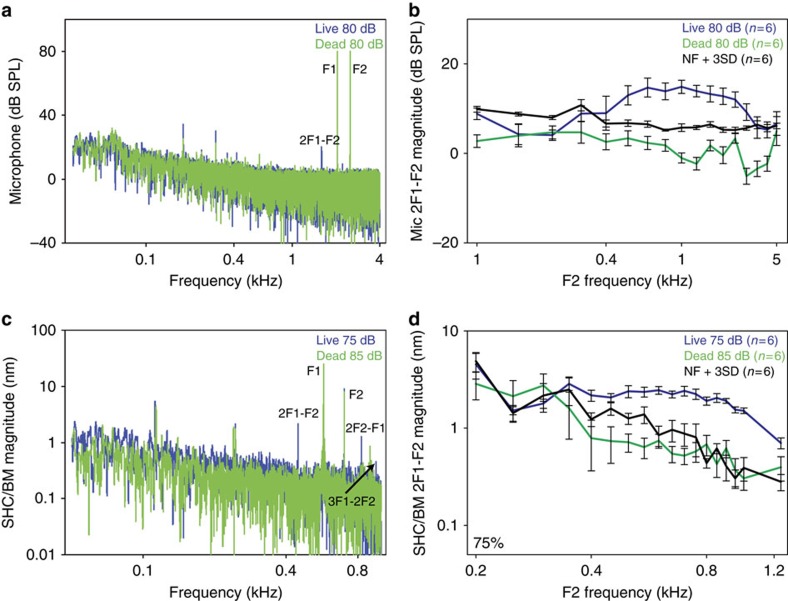
Frequency tuning within the auditory papilla of most non-mammalian species is electrical, deriving from ion-channel resonance within their sensory hair cells. In contrast, tuning within the mammalian cochlea is mechanical, stemming from active mechanisms within outer hair cells that amplify the basilar membrane travelling wave. Interestingly, hair cells in the avian basilar papilla demonstrate both electrical resonance and force-generation, making it unclear which mechanism creates sharp frequency tuning. Here, we measured sound-induced vibrations within the apical half of the chicken basilar papilla in vivo and found broadly-tuned travelling waves that were not amplified. However, distortion products were found in live but not dead chickens. These findings support the idea that avian hair cells do produce force, but that their effects on vibration are small and do not sharpen tuning. Therefore, frequency tuning within the apical avian basilar papilla is not mechanical, and likely derives from hair cell electrical resonance.


Figures

Figure 1
Figure 1. Representative experimental preparation of the P5-10 chicken basilar papilla.
(a) Microdissected inner ear tissues in which the surrounding otic capsule bone has been removed. The semicircular canals are the tubular structures to the right. The lagena is at the apical end of the basilar papilla. The three locations along the length of the basilar papilla that we imaged in vivo (50, 75 and 85% from the base) are highlighted. (b) View after opening the middle ear bulla widely in a post-mortem chicken. This involved removing about half of the tympanic membrane. The columella that connects the tympanic membrane to the base of the basilar papilla is seen. An artery angles over basilar papilla. (c) In vivo view. (d) Frozen section across the basilar papilla 75% from the base. Tuning curves were measured at the SHC/BM region (orange dot) and the THC/TM region (red dot). (e) Illustration of the chicken basilar papilla. Scala vestibuli (SV), scala media (SM), scala tympani (ST), tegmentum vasculosum (TV), fibrocartilage plate (FcP), auditory nerve ganglion cells (G). (fh) In vivo VOCTV images across the basilar papilla 50, 75 and 85% from the base. (i,j) ABR waveforms in one representative live chicken immediately after induction of anaesthesia, before surgery and repeated again after surgery to open the middle ear bulla and performing vibrometry experiments. There was no change in waveform morphology. The stimuli were clicks of intensity from 30 to 80 dB SPL in 5 dB steps. (k) Peak-to-peak responses from the ABR signals as a function of stimulus intensity. (l) CM magnitude responses to 2.75 kHz tones that ranged in intensity from 30 to 80 dB SPL in 5 dB steps. Error bars show the s.e.m.
Figure 2
Figure 2. Representative vibratory responses of the SHC/BM region.
(a) 50% from the base. (b) 75% from the base. (c) 85% from the base. (Top) The vibratory magnitude. Magnitude responses at high sound levels and at low frequencies were not shown due to saturation of our system (explained in Methods). (Middle) The phase normalized to columella phase. (Bottom) The sensitivity was the magnitude of BM vibration divided by the vibratory magnitude of the columella.
Figure 3
Figure 3. Mechanical responses do not match hair cell and auditory nerve responses.
(a) The vibratory responses were fit with a low-pass filter model to calculate the corner frequency (F3db,b), the stop-band attenuation (SBA, c), and the filter slope (slope, d). (e) The tonotopic map we estimate using the corner frequencies was similar to previously published maps of the chicken basilar papilla. (f) The sound level needed to produce a 30 nm magnitude vibration at the 75% location was not tuned, unlike the threshold plots from previously published measurements in auditory nerve fibres and hair cells. Error bars show the s.e.m. Asterisks in d represent statistical significance *P<0.05.
Figure 4
Figure 4. Group delay demonstrates the propagation of travelling waves.
(a) Representative group delay calculated from the phase curves from a cohort of eight chickens. The group delay was larger for more apical locations and for higher-frequency stimuli. Error bars show the s.e.m. (b) Vibration measurements for eight different locations along the length of the basilar papilla in another representative chicken. A 300 Hz stimulus was presented and the time differences were determined between the first vibratory peak at each location (blue line) referenced to the basal-most recording site (red line). All magnitudes were scaled to be identical to make it easier to assess for time delays, so the y axis is unlabelled. It took longer for more apical sites to begin vibrating, thus demonstrating delays associated with travelling wave propagation. The distance from the basal-most recording location, the percent distance from the base, and the time delay are provided for each measurement.
Figure 5
Figure 5. There is no detectable amplification in the transverse or radial directions.
(a) The chicken was rotated so that the BM (blue dotted line) was oriented at a 55° angle to the optical axis of the laser in this representative example (yellow line). The vibratory magnitude (b), phase (c) and sensitivity (d) measured from a representative chicken. (e) The sensitivity of the SHC/BM region to 40 and 70 dB SPL stimuli were similar, indication a lack of nonlinear gain. (f) The vibratory magnitude of the columella was the same in living and dead chicken. (g,h) The vibratory magnitude of the SHC/BM region was the same in living and dead chicken, indicating a lack of linear gain. Error bars show the s.e.m.
Figure 6
Figure 6. The THC/TM region vibrates in response to sound stimuli.
The vibratory magnitude, phase and sensitivity from the SHC/BM region (a) and the THC/TM region (b) from one representative chicken 75% from the base. (c) The THC/TM region vibrated with lower magnitudes than the adjacent SHC/BM region. (d,e) The stop-band attenuation and slope were reduced in the THC/TM region compared with the SHC/BM region. Error bars show the s.e.m. Asterisks represent statistical significance *P<0.01 (d) and *P<0.05 (e).
Figure 7
Figure 7. The vibratory pattern has a single mode that is centred upon the BM.
(ac) Representative vibratory magnitudes across the basilar papilla 75% from the base to 200, 500 and 800 Hz, 60 dB SPL stimuli. The magnitude is plotted in pseudocolour with the maximum vibration given in the upper right corner of each image. The largest vibration magnitudes occurred at the SHC/BM region, but the FcP and the THC/TM region also demonstrated vibration. (df) Vibratory phases to the same stimuli in the same chicken plotted in pseudocolour. There was little variation across the sensory epithelium, indicating a single vibratory mode was present. (g) Quantification of the magnitude demonstrated differences between the three different regions. (h) There was no phase variation between the three regions. Error bars show the s.e.m.
Figure 8
Figure 8. Distortion products emanate from the sensory epithelium.
(a) A representative Fourier transform of a recording from a microphone near the tympanic membrane from a chicken in response to two pure tones (F1, F2). In the live animal, a DPOAE could be detected (2F1-F2). This was not found post-mortem. The other peaks in the frequency spectrum were caused by speaker distortions and were present in both the living and post-mortem conditions. (b) 2F1-F2 DPOAEs were found in live but not dead chickens. (c) A representative Fourier transform of a vibratory recording from the SHC/BM region 75% from the base from a chicken in response to two pure tones (F1, F2). In the live animal, distortion products could be detected (2F1-F2, 2F2-F1, and 3F1-2F2) that were not found post-mortem. The other peaks in the frequency spectrum were caused by speaker distortions and were present in both the living and post-mortem conditions. (d) 2F1-F2 distortion products in the vibratory responses were found in live but not dead chickens. Error bars show the s.e.m.

Similar articles

Cited by

References

    1. Howard J. & Hudspeth A. J. Compliance of the hair bundle associated with gating of mechanoelectrical transduction channels in the bullfrog's saccular hair cell. Neuron 1, 189–199 (1988). - PubMed
    1. Hudspeth A. J. Integrating the active process of hair cells with cochlear function. Nat. Rev. Neurosci. 15, 600–614 (2014). - PubMed
    1. Ricci A. J., Crawford A. C. & Fettiplace R. Mechanisms of active hair bundle motion in auditory hair cells. J. Neurosci. 22, 44–52 (2002). - PMC - PubMed
    1. Fettiplace R. & Kim K. X. The physiology of mechanoelectrical transduction channels in hearing. Physiol. Rev. 94, 951–986 (2014). - PMC - PubMed
    1. Bormuth V., Barral J., Joanny J.-F., Jülicher F. & Martin P. Transduction channels' gating can control friction on vibrating hair-cell bundles in the ear. Proc. Natl Acad. Sci. USA 111, 7185–7190 (2014). - PMC - PubMed

Publication types

LinkOut - more resources