. 2016 Oct 31:6:36068.
doi: 10.1038/srep36068.

Conformity cannot be identified based on population-level signatures

Affiliations

Conformity cannot be identified based on population-level signatures

Alberto Acerbi et al. Sci Rep. .

Abstract

Conformist transmission, defined as a disproportionate likelihood to copy the majority, is considered a potent mechanism underlying the emergence and stabilization of cultural diversity. However, ambiguity within and across disciplines remains as to how to identify conformist transmission empirically. In most studies, a population level outcome has been taken as the benchmark to evidence conformist transmission: a sigmoidal relation between individuals' probability to copy the majority and the proportional majority size. Using an individual-based model, we show that, under ecologically plausible conditions, this sigmoidal relation can also be detected without equipping individuals with a conformist bias. Situations in which individuals copy randomly from a fixed subset of demonstrators in the population, or in which they have a preference for one of the possible variants, yield similar sigmoidal patterns as a conformist bias would. Our findings warrant a revisiting of studies that base their conformist transmission conclusions solely on the sigmoidal curve. More generally, our results indicate that population level outcomes interpreted as conformist transmission could potentially be explained by other individual-level strategies, and that more empirical support is needed to prove the existence of an individual-level conformist bias in human and other animals.


Figures

Figure 1
Figure 1. Conformist transmission rules producing sigmoid curves.
(a) Individuals have a disproportionate tendency to copy the majority, and they know the variant distribution across the entire population (condition Implicit knowledge) or (b) individuals sample a subset of individuals of the population and copy the majority (condition Rule of 3s; s = 3). Copying probability is plotted against frequency of the variant in the population.
Figure 2
Figure 2. Conditions with better linear than sigmoid fit.
(a) Random copying (Δ AIC = −393.51), (b) Copiers Subgroup (Δ AIC = −67.08, Cp = 50), (c) Copy or not (Δ AIC = −372.55, pC = 0.5), (d) Family bias (Δ AIC = −243.36, S = 5), (e) Information retention (Δ AIC = −34.12, m = 3), (f) Increasing conservatism (Δ AIC = −360.3512, d = 0.1). Copying probability is plotted against frequency of the variant in the population.
Figure 3
Figure 3. Conditions with better sigmoid than linear fit.
Individuals (a) copy only a fixed subset of the population (condition Demonstrators subgroup; Dm = 5) or (b) individuals have a lower preference for one of the two variants (condition Variant Preference; pLess = 0.2). Copying probability is plotted against frequency of the variant in the population.
Figure 4
Figure 4. Sigmoid fit is more evident in small populations in the condition Demonstrators subgroup.
The plot shows the relation between the proportional size of the subset of the population being copied (Dm) and the difference between AICs for sigmoid and linear fittings (positive values indicate that the sigmoid fitting is better). Simulations are run for N = 100 (the original set-up), and for smaller (N = 20) and bigger (N = 200) populations. Each data point represents the average of 10 experiments (each of them composed by 1,000 repetitions of the simulation). Errors bars show standard deviation.
Figure 5
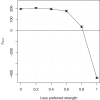
Figure 5. Sigmoid fit for various strengths of preferences in the condition Variant preference.
Relation between the strength of the preference for the less preferred variant (pLess) –the preferred variant is always copied–and the difference between AICs for sigmoid and linear fittings (positive values indicate that the sigmoid fit is better). Each data point represents the average of 10 experiments (each of them composed by 1,000 repetitions of the simulation). Errors bars show standard deviation.

Comment in

References

    1. Boyd R. & Richerson P. J. Culture and the Evolutionary Process. (University of Chicago Press, 1985).
    1. Henrich J. & Boyd R. The Evolution of Conformist Transmission and the Emergence of Between-Group Differences. Evol. Hum. Behav. 19, 215–241 (1998).
    1. Bell A. V., Richerson P. J. & McElreath R. Culture rather than genes provides greater scope for the evolution of large-scale human prosociality. Proc. Natl. Acad. Sci. USA 106, 17671–17674 (2009). - PMC - PubMed
    1. Bowles S. & Gintis H. Homo reciprocans. Nature 415, 125–128 (2002). - PubMed
    1. Boyd R. & Richerson P. J. Culture and the evolution of human cooperation. Philos. Trans. R. Soc. Lond. B. Biol. Sci. 364, 3281–3288 (2009). - PMC - PubMed

Publication types

LinkOut - more resources