. 2017 Jan;133(1):25-42.
doi: 10.1007/s00401-016-1636-z. Epub 2016 Oct 27.

Slow expansion of multiple sclerosis iron rim lesions: pathology and 7 T magnetic resonance imaging

Affiliations

Slow expansion of multiple sclerosis iron rim lesions: pathology and 7 T magnetic resonance imaging

Assunta Dal-Bianco et al. Acta Neuropathol. 2017 Jan.

Abstract

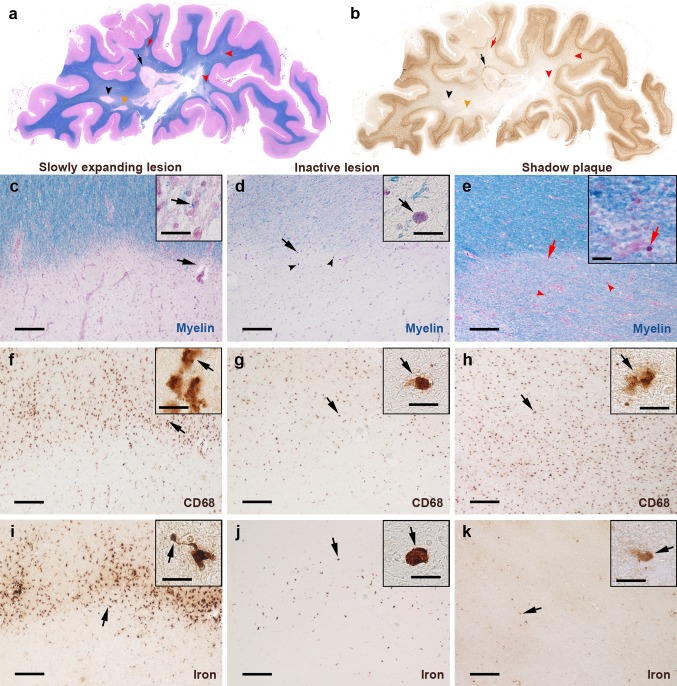
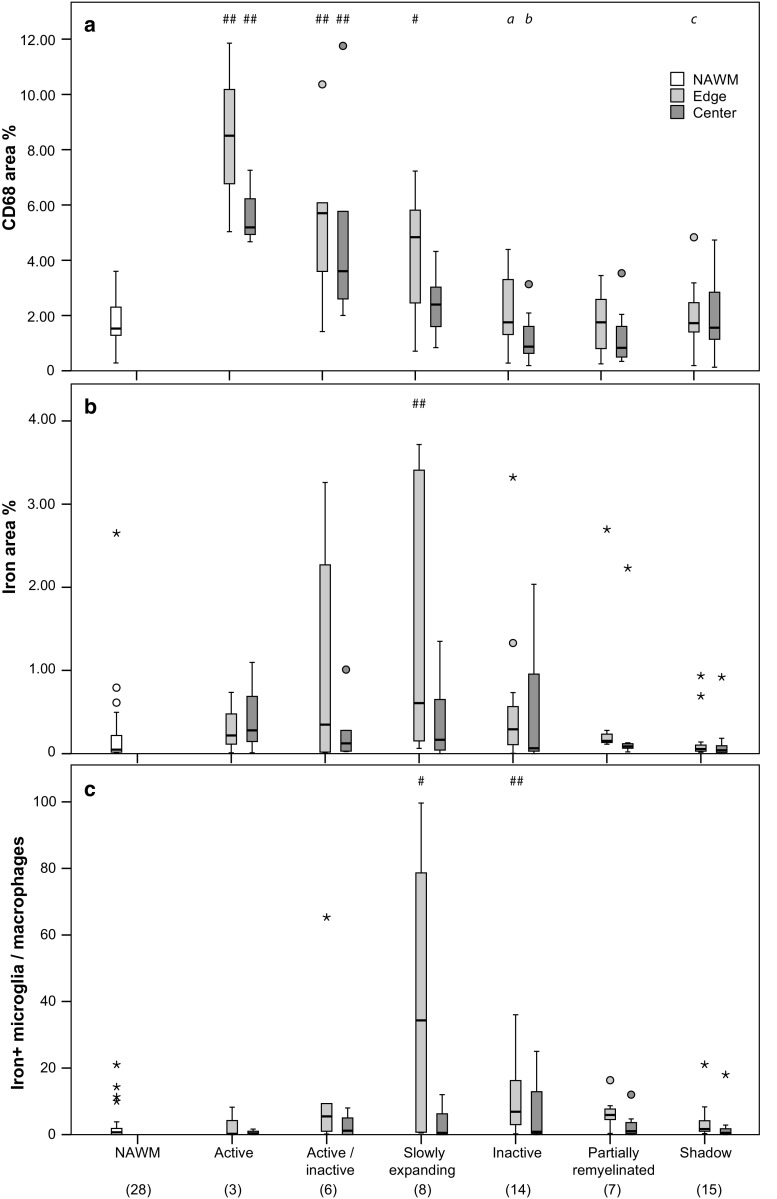
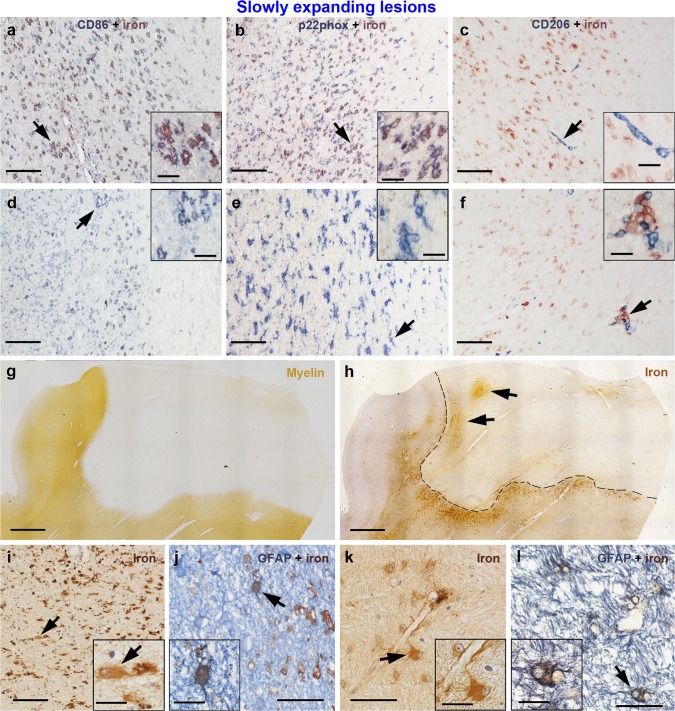
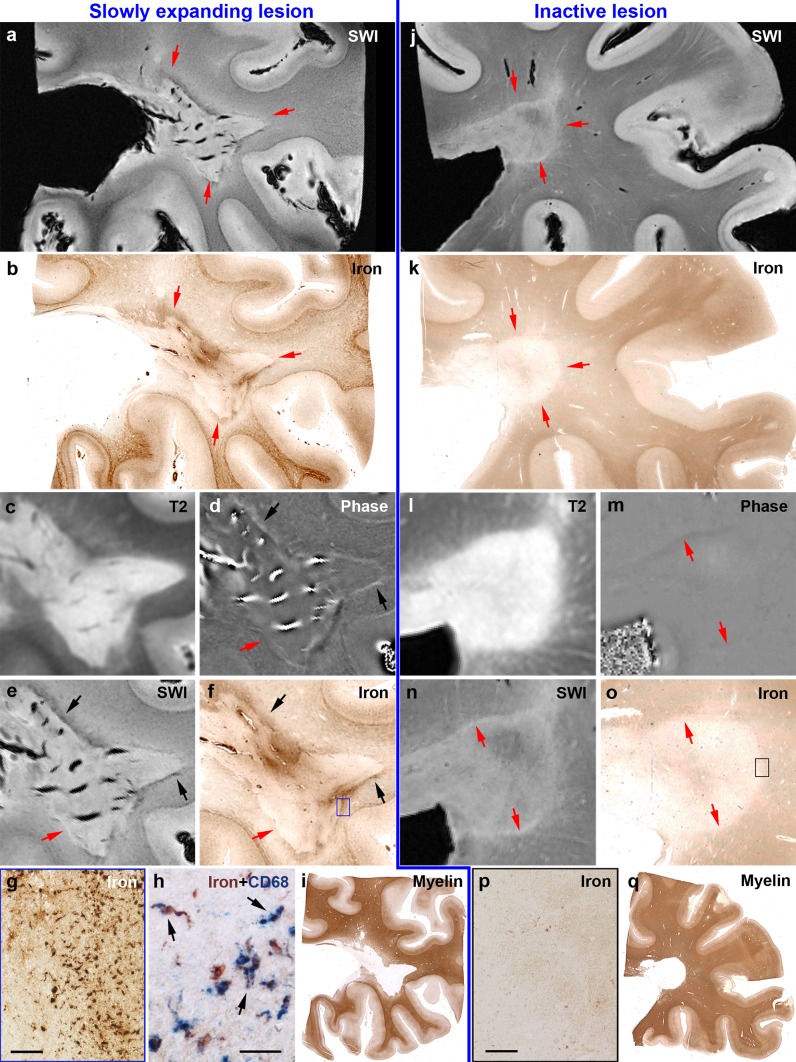
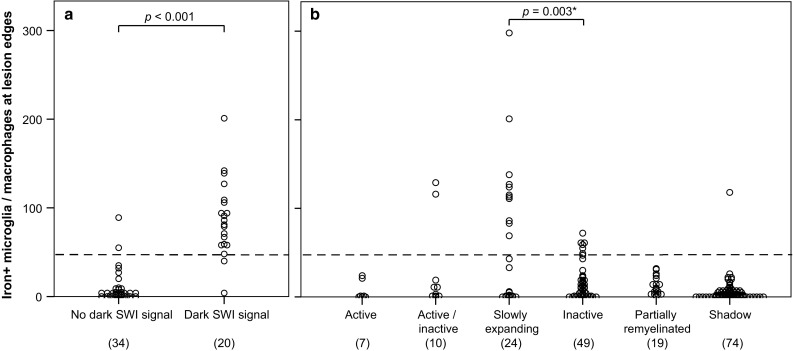
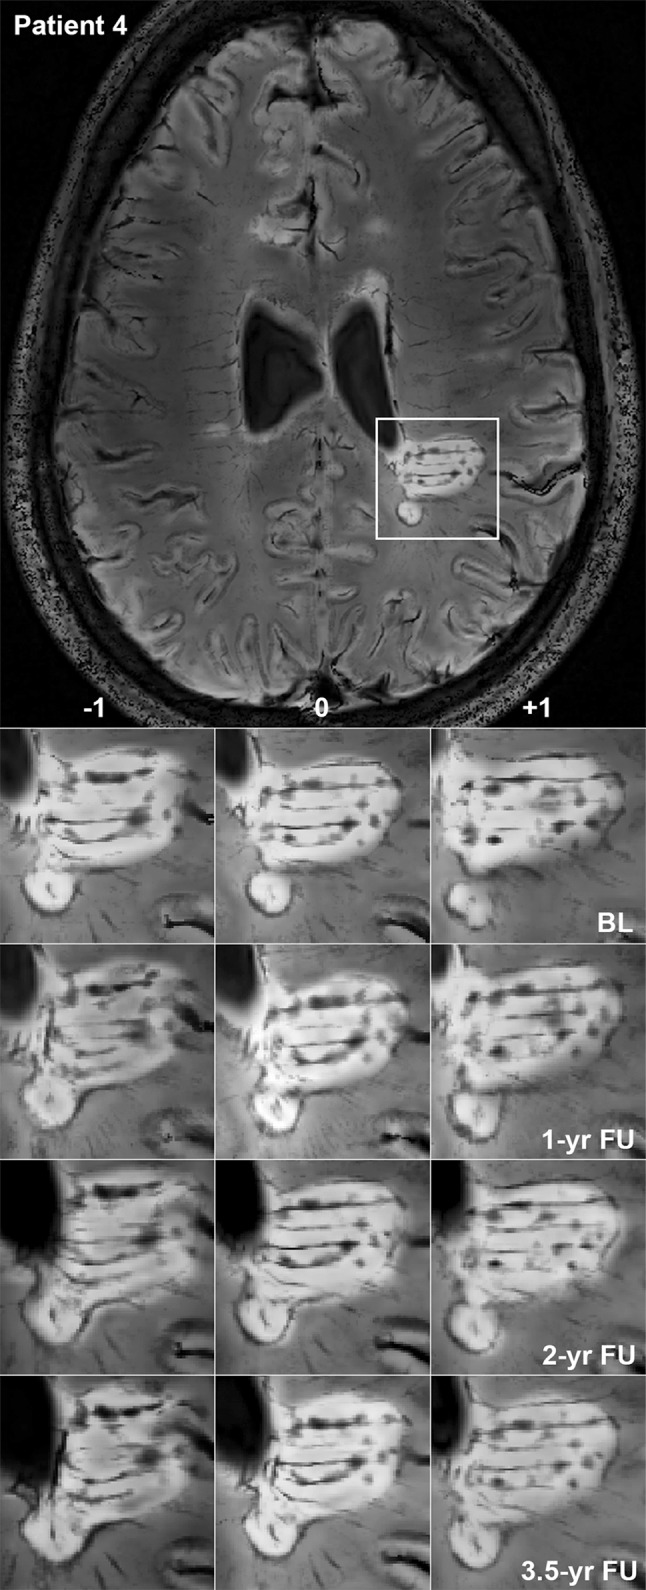
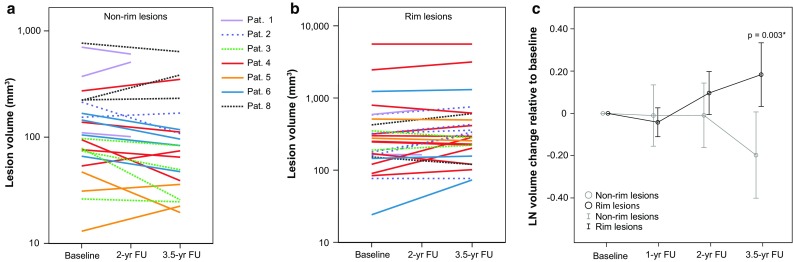
In multiple sclerosis (MS), iron accumulates inside activated microglia/macrophages at edges of some chronic demyelinated lesions, forming rims. In susceptibility-based magnetic resonance imaging at 7 T, iron-laden microglia/macrophages induce a rim of decreased signal at lesion edges and have been associated with slowly expanding lesions. We aimed to determine (1) what lesion types and stages are associated with iron accumulation at their edges, (2) what cells at the lesion edges accumulate iron and what is their activation status, (3) how reliably can iron accumulation at the lesion edge be detected by 7 T magnetic resonance imaging (MRI), and (4) if lesions with rims enlarge over time in vivo, when compared to lesions without rims. Double-hemispheric brain sections of 28 MS cases were stained for iron, myelin, and microglia/macrophages. Prior to histology, 4 of these 28 cases were imaged at 7 T using post-mortem susceptibility-weighted imaging. In vivo, seven MS patients underwent annual neurological examinations and 7 T MRI for 3.5 years, using a fluid attenuated inversion recovery/susceptibility-weighted imaging fusion sequence. Pathologically, we found iron rims around slowly expanding and some inactive lesions but hardly around remyelinated shadow plaques. Iron in rims was mainly present in microglia/macrophages with a pro-inflammatory activation status, but only very rarely in astrocytes. Histological validation of post-mortem susceptibility-weighted imaging revealed a quantitative threshold of iron-laden microglia when a rim was visible. Slowly expanding lesions significantly exceeded this threshold, when compared with inactive lesions (p = 0.003). We show for the first time that rim lesions significantly expanded in vivo after 3.5 years, compared to lesions without rims (p = 0.003). Thus, slow expansion of MS lesions with rims, which reflects chronic lesion activity, may, in the future, become an MRI marker for disease activity in MS.

Keywords: 7 T MRI; Iron rim; Multiple sclerosis; Phase; SWI.


Conflict of interest statement

Compliance with ethical standards The institutional review board of the Medical University in Vienna approved the post-mortem study (EK number 535/2004). No institutional review board was necessary at Vanderbilt University for the post-mortem study. The in vivo study was conducted in Vienna upon local institutional review board approval (EK number: 154/2009). Written informed consent in accordance with the 1964 declaration of Helsinki and its later amendments was obtained from all individual participants included in the study. Conflict of interest The authors declare no conflict of interest with respect to the study and data presented in this paper. Funding This work was supported by funds of the Oesterreichische Nationalbank (Anniversary Fund, project number 16153 to GG and SH and 15680 to ST) and the Austrian Science Fund (FWF project P27744-B27).

Figures

Fig. 1
Fig. 1
Iron-related pathology of slowly expanding and inactive lesions as well as shadow plaques. Rim-like iron accumulation was observed around a subset of demyelinated WM lesions but hardly around shadow plaques. a, b Hemispheric sections of the temporal lobe of SPMS case 13, stained for myelin (a, blue) and iron (b, brown), show several WM lesions. Black arrows/arrowheads indicate slowly expanding lesions, red arrows/arrowheads indicate shadow plaques, and orange arrowheads indicate an inactive lesion. One slowly expanding iron rim lesion is indicated by a black arrow, magnified in c, f, and i. Red arrow indicates the edge of a shadow plaque, magnified in e, h, and k. The micrographs depict a slowly expanding lesion from SPMS case 13, an inactive lesion from SPMS case 18, and a shadow plaque from case 13. ck The horizontal lesion edges divide micrographs into myelinated WM (top half) and lesion (bottom half). c Slowly expanding edge is characterized by intracellular LFB-positive myelin degradation products (arrows, inset). f Microglia/macrophages at the edge display activated morphology (arrows, inset) and are reduced in the center. i Iron rim is formed by iron-laden microglia/macrophages, which frequently shows dystrophic morphology, such as process swellings and buddings (arrows, inset). d This inactive edge contains macrophages with intracellular lipofuscin lipids (arrows, inset, arrowheads), suggesting remote demyelinating activity of the lesion. g Fewer microglia/macrophages (arrows, inset) at the edge, when compared with f, and loss of microglia/macrophages in the center. j Few iron-laden microglia/macrophages at this inactive edge, while iron content in individual macrophages (arrows, inset) is comparable to levels observed at slowly expanding edges. e No lipid-laden macrophages but corpora amylacea (red arrows, inset, red arrowheads) are found at this shadow plaque edge. h Maintained microglia/macrophage density (arrows, inset) across the shadow plaque edge and center, which contrasts microglia loss in chronically demyelinated centers. k No edge-contouring iron accumulation around this shadow plaque. Low iron content is observed in few cells (arrows, inset). Scale bars 200 µm; inset scale bars 20 µm
Fig. 2
Fig. 2
Quantitative pathological data of the first sample. Optical densities (area fraction) of CD68+ microglia/macrophages (a) and total non-heme iron (b) as well as manually counted iron-laden cells with microglia or macrophage morphology (c) within an area of 0.43 mm2. Hashes indicate significant differences compared with NAWM (#: p < 0.05, ##: p < 0.01). Data represent case-based averages of different lesion types. Numbers in brackets at the bottom indicate numbers of multiple sclerosis cases and data points contributing to the boxplots and statistical tests
Fig. 3
Fig. 3
Activation status of iron-laden microglia/macrophages and presence of iron-laden astrocytes in slowly expanding lesions of the second sample. (a, b) Many microglia/macrophages are iron-laden in this slowly expanding iron rim region, and virtually all of them express the pro-inflammatory markers CD86 (a) and p22phox (b). (d, e) In another region of the same rim with few iron-laden cells, still many microglia/macrophages express CD86 (d) and p22phox (e). (c) Only few microglia/macrophages were anti-inflammatory and CD206-positive. Most of them were located in perivascular spaces, and only a minority of CD206-positive cells was iron-laden (f). (g) Slowly expanding lesion is visible in the myelin (PLP) staining with a sharply demarcated border. (h) Adjacent section stained for iron. The border of this iron rim lesion is outlined by a dashed black line. Two black arrows indicate focal perivascular iron accumulation within the lesion core. The region indicated by the upper arrow is magnified in k and l. (i) Iron-laden astrocytes in the iron rim were sparse (arrows, inset) and showed weaker iron reactivity, when compared with surrounding microglia/macrophages. (j) Rare astrocytic iron accumulation in the rim was confirmed with double-labeling with GFAP (astrocyte marker). (k) Astrocyte (arrow, inset) with contact to a vessel wall shows moderate iron accumulation. Many iron-laden astrocytes are observed in this region of perivascular iron accumulation within the lesion. (l) Confirmation of astrocytic iron with double-labeling. The same region as k. Scale bars 100 µm (af, i), 2 mm (g, h), 50 µm (jl); inset scale bars 20 µm
Fig. 4
Fig. 4
Post-mortem validation of SWI and underlying phase images at 7 T for the sensitive and specific detection of iron rims around MS lesions. Left a Slowly expanding rim lesion (red arrows) of PPMS case 26 with hypointense portions along the lesion edge around a hyperintense lesion center. b Corresponding iron staining confirms iron accumulation at the lesion edge (red arrows). c Extent of the hyperintense lesion in the T2 image. Black arrows in (d, e, f) highlight portions of edge-related hyperintense phase and hypointense SWI, which correspond to iron accumulation. Red arrows in (d, e, f) highlight portions which lack hyperintense phase, hypointense SWI and iron accumulation. f The blue rectangle is magnified in (g) and shows iron-laden microglia/macrophages, which is confirmed by double-labeling with the microglia/macrophage marker CD68 (h). Arrows indicate double-labelled microglia/macrophages. i Extent of the demyelinated lesion in PLP staining for myelin. Right j inactive lesion (red arrows in j, k) of PPMS case 27 without edge-related hypointensities around the hyperintense lesion center. k Corresponding iron staining confirms lack of edge-related iron accumulation. l Extent of the hyperintense lesion in the T2 image. Red arrows in (m, n, o) indicate lesion edge devoid of hyperintense phase, hypointense SWI, and iron accumulation. o Black rectangle is magnified in (p), showing the absence of iron-loaded microglia/macrophages. q Extent of the demyelinated lesion in PLP staining for myelin. Scale bars = 100 µm (g, p) and 30 µm (h)
Fig. 5
Fig. 5
Iron-laden microglia/macrophages at edges of WM lesions of the first sample. a Establishment of a post-mortem threshold (dashed line) for manually counted iron-laden microglia/macrophages to induce a dark rim signal in SWI, based on four multiple sclerosis cases and four WM lesions with available post-mortem scans. Each data point represents one ROI. Numbers in brackets indicate numbers of ROIs. b Application of the threshold (dashed line) for the edges of all 183 WM lesions indicates that 2/10 active/inactive, 11/24 slowly expanding, 6/49 inactive lesions, and 1/74 shadow plaques exceeded this threshold. *P value of Chi-square test between slowly expanding and inactive lesion edges which were either below or above the threshold. Each data point represents the value of one lesion edge. Numbers in brackets indicate numbers of data points and individual lesions
Fig. 6
Fig. 6
Expansion of a rim lesion. Patient 4, a 29-year-old lady with relapsing-remitting multiple sclerosis lasting for 5 years, EDSS 2. 7 T FLAIR–SWI data show several WM hyperintense lesions typical for the disease. One large periventricular hyperintense lesion with an encircling hypointense rim is indicated by a white rectangle and magnified. Within this lesion, tubular hypointense structures suggestive of veins and circumscribed nodular hypointensities are visible. Images demonstrate a slow expansion of the posterior parts of this lesion over 3.5 years, leading to a fusion of initially separated lesion parts. Three contiguous imaging slices (−1, 0, +1) show that expansion and fusion are not due to willful slice sampling. Note the global brain atrophy of this patient over time, which is evident from the widening of the ventricles. BL baseline, FU follow-up, yr year
Fig. 7
Fig. 7
Volumetric longitudinal data of non-rim and rim lesions. Absolute lesional volumes of non-rim (a) and rim lesions (b) in mm3. Data points from baseline and last available follow-up of single lesion volumes are plotted on a logarithmic scale. c Logarithmically transformed lesion volume changes relative to baseline. Mean values (circles) are plotted with 95% confidence intervals (bars). After 3.5 years, rim lesion volumes showed significant expansion over time compared with non-rim lesions that on average shrink. *P value indicates significantly different volume developments between rim and non-rim lesions (mixed-model ANOVA, factor ‘rim*timepoint’). FU follow-up, yr year

References

    1. Absinta M, Sati P, Gaitan MI, Maggi P, Cortese IC, Filippi M, Reich DS. Seven-tesla phase imaging of acute multiple sclerosis lesions: a new window into the inflammatory process. Ann Neurol. 2013;74:669–678. doi: 10.1002/ana.23959. - DOI - PMC - PubMed
    1. Absinta M, Sati P, Reich DS. Advanced MRI and staging of multiple sclerosis lesions. Nature Rev Neurol. 2016;12:358–368. doi: 10.1038/nrneurol.2016.59. - DOI - PMC - PubMed
    1. Absinta M, Sati P, Schindler M, Leibovitch EC, Ohayon J, Wu T, Meani A, Filippi M, Jacobson S, Cortese IC et al (2016) Persistent 7-tesla phase rim predicts poor outcome in new multiple sclerosis patient lesions. J Clin Investig. doi:10.1172/JCI86198 - PMC - PubMed
    1. Babbe H, Roers A, Waisman A, Lassmann H, Goebels N, Hohlfeld R, Friese M, Schroder R, Deckert M, Schmidt S, et al. Clonal expansions of CD8(+) T cells dominate the T cell infiltrate in active multiple sclerosis lesions as shown by micromanipulation and single cell polymerase chain reaction. J Exp Med. 2000;192:393–404. doi: 10.1084/jem.192.3.393. - DOI - PMC - PubMed
    1. Bagnato F, Hametner S, Yao B, van Gelderen P, Merkle H, Cantor FK, Lassmann H, Duyn JH. Tracking iron in multiple sclerosis: a combined imaging and histopathological study at 7 Tesla. Brain: J Neurol. 2011;134:3602–3615. doi: 10.1093/brain/awr278. - DOI - PMC - PubMed

Publication types

MeSH terms