

The MMS22L-TONSL heterodimer directly promotes RAD51-dependent recombination upon replication stress
- PMID: 27797818
- PMCID: PMC5283591
- DOI: 10.15252/embj.201593132
The MMS22L-TONSL heterodimer directly promotes RAD51-dependent recombination upon replication stress
Abstract
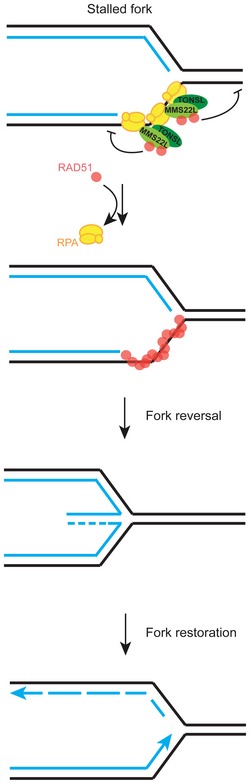
Homologous recombination (HR) is a key pathway that repairs DNA double-strand breaks (DSBs) and helps to restart stalled or collapsed replication forks. How HR supports replication upon genotoxic stress is not understood. Using in vivo and in vitro approaches, we show that the MMS22L-TONSL heterodimer localizes to replication forks under unperturbed conditions and its recruitment is increased during replication stress in human cells. MMS22L-TONSL associates with replication protein A (RPA)-coated ssDNA, and the MMS22L subunit directly interacts with the strand exchange protein RAD51. MMS22L is required for proper RAD51 assembly at DNA damage sites in vivo, and HR-mediated repair of stalled forks is abrogated in cells expressing a MMS22L mutant deficient in RAD51 interaction. Similar to the recombination mediator BRCA2, recombinant MMS22L-TONSL limits the assembly of RAD51 on dsDNA, which stimulates RAD51-ssDNA nucleoprotein filament formation and RAD51-dependent strand exchange activity in vitro Thus, by specifically regulating RAD51 activity at uncoupled replication forks, MMS22L-TONSL stabilizes perturbed replication forks by promoting replication fork reversal and stimulating their HR-mediated restart in vivo.
Keywords: DNA repair; DNA replication; DNA replication stress; homologous recombination.
© 2016 The Authors.
Figures
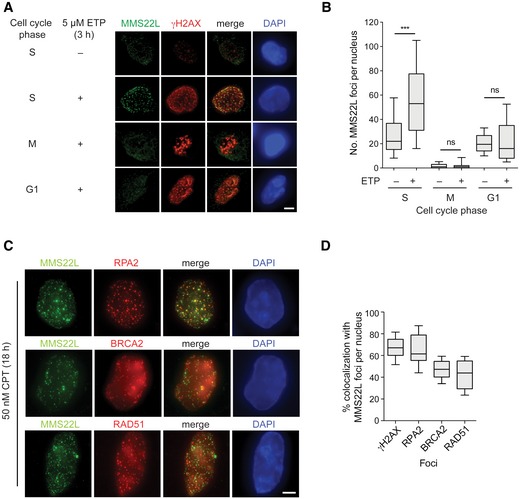
Immunofluorescence images of MMS22L foci formation at etoposide (ETP)‐induced DSBs during S, M, and G1 phases of the cell cycle in HeLa cells. Scale bar: 5 μm.
Quantification of a representative experiment from (A) shows number of MMS22L foci per nucleus during indicated cell cycle phases (n = 2; n nuclei ≥ 60).
Immunofluorescence images of CPT‐induced MMS22L, RPA2, BRCA2, and RAD51 foci in U2OS cells. Scale bar: 5 μm.
Quantification of a representative experiment (n = 3) from (C) shows percentage of γH2AX, RPA2, BRCA2, and RAD51 foci colocalizing with MMS22L foci (n nuclei = 30; nuclei with ≥ 25 MMS22L foci were analyzed).
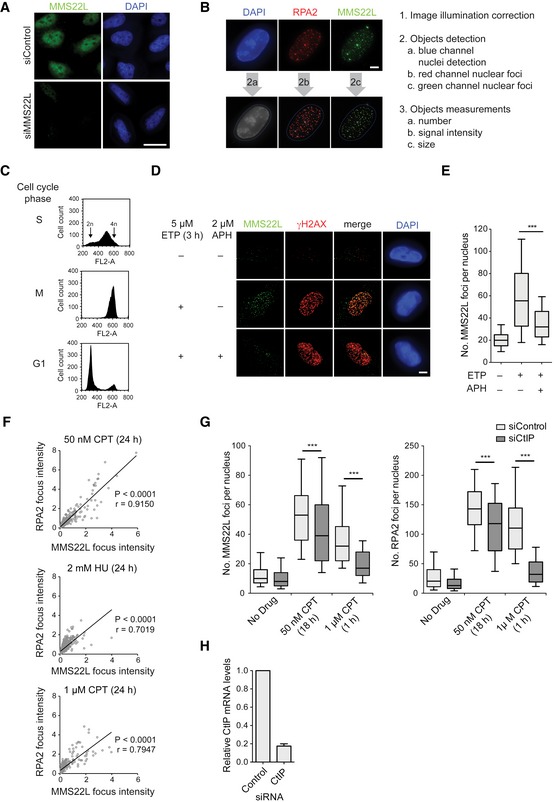
Immunofluorescence images of control and siMMS22L‐treated HeLa cells demonstrating specificity of anti‐MMS22L antibody. Scale bar: 20 μm.
Example images (left) and workflow (right) of the CellProfiler‐based automated image processing pipeline to quantify nuclear speckles from immunofluorescence microscopy images used in this study. Scale bar: 5 μm.
Related to the experiment in Fig 1A and B; DNA content analysis of synchronized HeLa cells using propidium iodide staining and flow cytometry.
Immunofluorescence images of MMS22L foci formation in S phase‐synchronized HeLa cells treated with or without ETP and APH. APH, polymerase‐alpha inhibitor aphidicolin. Scale bar: 5 μm.
Quantification of a representative experiment from (D); n = 2. Graph represents distribution of foci numbers per nuclei, n nuclei ≥ 177.
Graphs show the signal intensities of colocalizing MMS22L and RPA2 foci from U2OS cells treated with the indicated replication stress agents. Foci intensities were quantified using CellProfiler and their correlation assessed by the Pearson method. r, Pearson correlation coefficient; n = 3.
Graphs show dependence of MMS22L foci formation on CtIP‐mediated DNA end resection in U2OS cells treated with indicated replication stress agents. Immunofluorescence images were analyzed using CellProfiler, and cells were in silico enriched in S phase based on increased nuclear RPA2 signal intensity. Boxplots show quantifications of MMS22L and RPA2 foci from a representative experiment, n = 3.
Related to experiment in (G). qRT–PCR analysis demonstrating CtIP depletion efficiency; error bars, SEM. n = 3.
- A, B
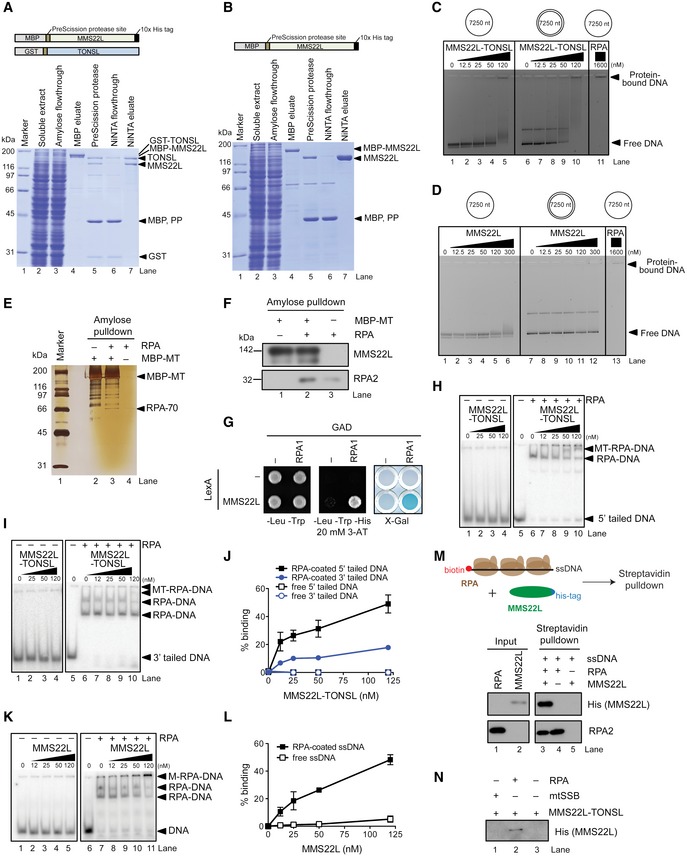
Schematic representation of the recombinant constructs (top) and polyacrylamide gels (bottom) showing samples from MMS22L–TONSL (A) and MMS22L (B) purifications. MBP, maltose‐binding protein; GST, glutathione S‐transferase; PP, PreScission protease.
- C, D
Indicated concentrations of the MMS22L–TONSL heterodimer (C) or MMS22L (D) were incubated with bacteriophage M13‐based DNA and the formed complexes were separated by agarose gel electrophoresis. The gels were stained with GelRed.
- E, F
Amylose pulldown of MBP‐tagged MMS22L–TONSL (MBP‐MT) and RPA. Proteins in the eluates were analyzed by silver staining (E) or Western blotting (F).
- G
Yeast two‐hybrid analysis of the interaction between MMS22L fused to LexA DNA‐binding domain and RPA1 fused to GAL4 activating domain (GAD) assessed by survival on media containing 3‐aminotriazole (3‐AT) in the absence of histidine and β‐galactosidase activity (X‐Gal) assays.
- H–J
Electrophoretic mobility shift assays with 5′‐tailed (H), 3′‐tailed DNA (I) and MMS22L–TONSL and/or RPA. The assays were quantified and shown as average (J), n = 2; error bars, SEM.
- K, L
Electrophoretic mobility shift assay with MMS22L and ssDNA, with or without RPA. Panel (K) shows a representative experiment. The assays were quantified and shown as average (L), n = 2; error bars, SEM.
- M
Schematic (top) and Western blot (bottom) of streptavidin pulldown of biotinylated ssDNA incubated with MMS22L and/or RPA.
- N
Streptavidin pulldown of biotinylated ssDNA pre‐incubated with either human mitochondrial SSB (mtSSB, 100 nM) or human RPA (100 nM) and subsequently incubated with MMS22L–TONSL.
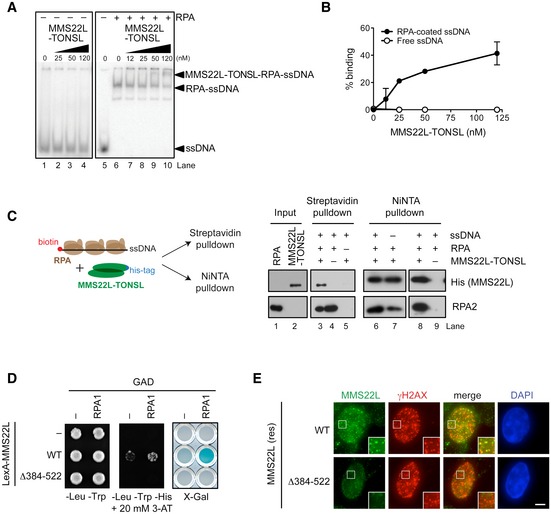
Electrophoretic mobility shift assay monitoring MMS22L–TONSL binding to ssDNA without RPA and with RPA‐coated ssDNA.
Quantification of data as in (A) shows percent MMS22L–TONSL binding to ssDNA with or without RPA (n = 2; error bars, SEM).
Schematic (left) and Western blots (right) of streptavidin and NiNTA pulldowns of His‐tagged MMS22L–TONSL, RPA, and biotinylated ssDNA.
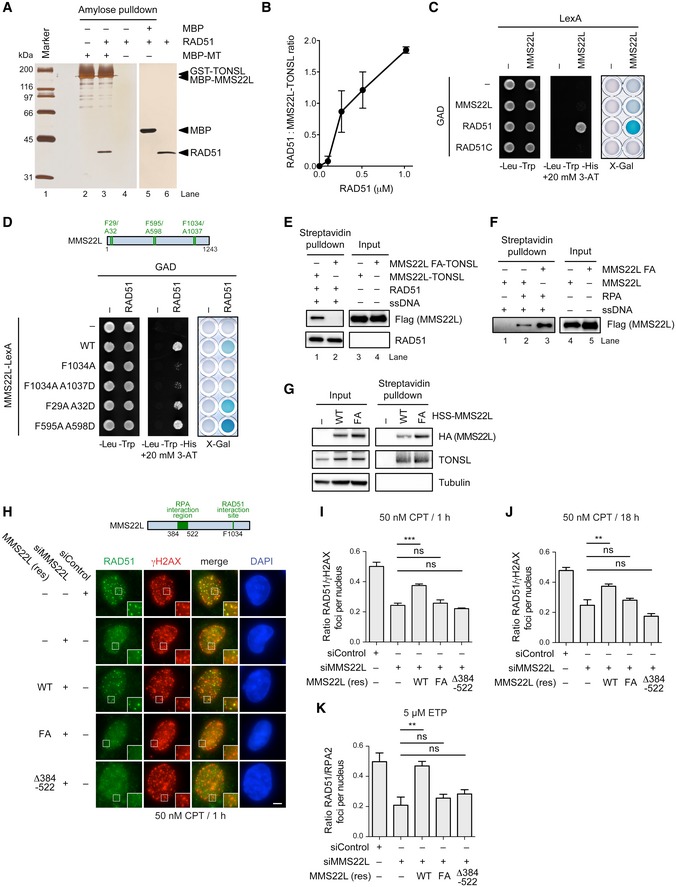
Yeast two‐hybrid analysis shows the effect of deletion of the amino acids 384–522 of MMS22L on the interaction with RPA. The interaction between indicated MMS22L variants fused to LexA DNA‐binding domain and RPA1 fused to GAL4‐activating domain (GAD) is assessed by survival on media containing 3‐aminotriazole (3‐AT) in the absence of histidine and by β‐galactosidase activity (X‐Gal) assays.
Images of MMS22L foci formed in U2OS cells stably expressing wild‐type (WT) or Δ384–522 variants of siRNA‐resistant HSS‐MMS22L, depleted of endogenous MMS22L by RNAi and treated with 50 nM CPT for 18 h. Scale bar: 5 μm.
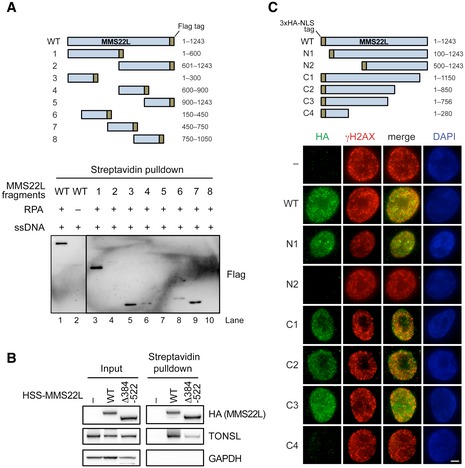
Schematic of recombinant truncated MMS22L constructs (top) used in streptavidin pulldowns (bottom) of RPA‐coated ssDNA. Various fragments of MMS22L were expressed as MBP and FLAG fusions. The MBP tag was cleaved, and the FLAG‐tagged constructs (50 nM) were incubated with biotinylated RPA‐coated ssDNA in a buffer containing 50 mM Tris–HCl (pH 7.5), 0.1% Triton X‐100, 0.1 mg/ml bovine serum albumin, 120 mM NaCl. The MMS22L fragments in the streptavidin pulldowns were detected by Western blotting using an anti‐FLAG antibody.
Streptavidin pulldown of HSS‐tagged MMS22L variants stably integrated and overexpressed in U2OS cells. Input and coprecipitated proteins were detected by immunoblotting.
Schematic (top) and representative immunofluorescence images (bottom) of MMS22L truncation constructs used to investigate recruitment to CPT‐induced DNA damage sites. HeLa cells were transiently transfected with the indicated constructs fused to the 3× HA tag and the SV40 NLS sequence (to assure nuclear localization). One day after DNA transfection, cells were treated with 50 nM CPT for 18 h, then subjected to pre‐extraction to analyze chromatin‐bound fraction, and processed for immunofluorescence staining using indicated antibodies. Fragments N2 and C4, which lack putative RPA‐binding region, are not recruited to CPT‐induced DNA damage sites (γH2AX foci). Scale bar: 5 μm
- A
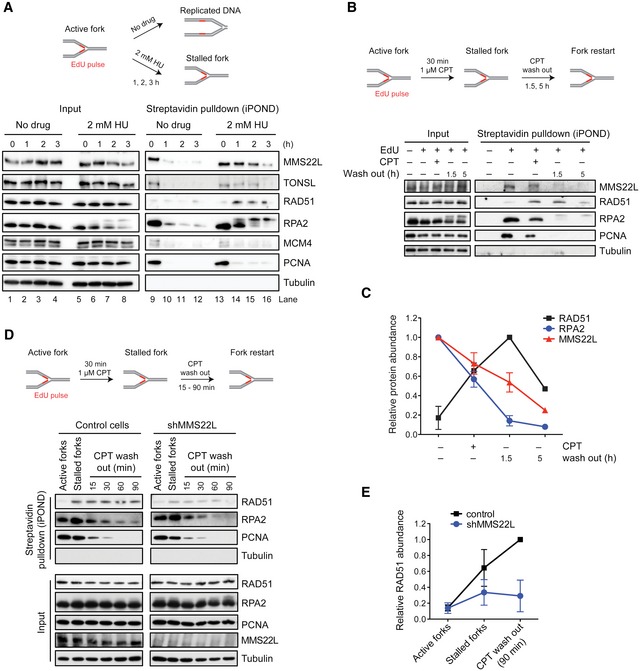
Abundance of MMS22L–TONSL at active and HU‐stalled replication forks, and fully replicated DNA.
- B, C
MMS22L dynamics at stalled replication forks. Quantification (C) shows average relative abundance of indicated proteins detected in immunoblots (n = 3 except at time point 5 h, n = 1; error bars, SEM).
- D, E
Effect of MMS22L depletion on RAD51 levels at stalled replication forks. Quantification (E) shows average relative RAD51 abundance (n = 2; error bars, SEM).
- A
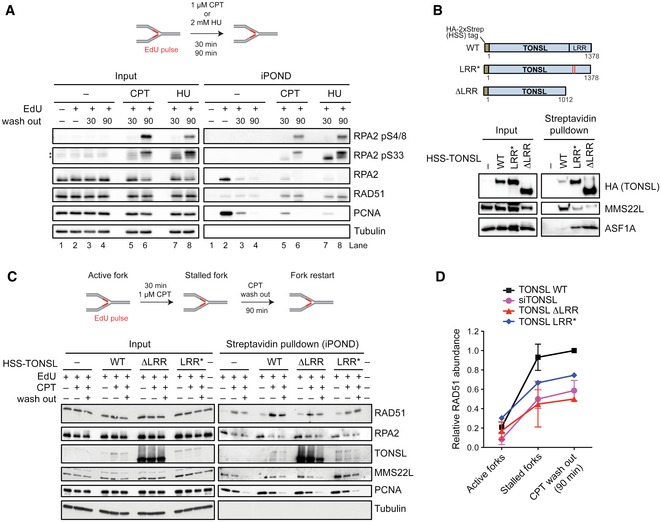
iPOND assay schematic (top) and immunoblots (bottom) show effects of CPT and HU treatments on the RPA2 phosphorylation status in HeLa cells. Note that 30‐min treatment with 1 μM CPT stalls forks without inducing fork breakage, as the phosphorylation status of RPA2 using specific antibodies indicates the presence of pS33 associated with ssDNA rather than pS4/8 associated with DSBs (induced at later time point; 90 min). Asterisks indicate cross‐reactive bands.
- B
Schematic representation (top) of TONSL, TONSL LRR*: E1089K and D1104N mutations within the LRR domain identified in ovarian cancer patient (COSMIC sample OCC06PT (Forbes et al, 2015)) and TONSL ΔLRR: C‐terminal TONSL truncation deleting the LRR domain; LRR, leucine‐rich repeats. Streptavidin pulldown (bottom) of indicated stably integrated HSS‐tagged‐TONSL variants overexpressed in HeLa cells. Input and coprecipitated proteins were detected by immunoblotting. ASF1A, known to interact with the N‐terminal region of TONSL (Duro et al, 2010; O'Donnell et al, 2010), was included as a control.
- C, D
The presence of the indicated proteins at replication forks was analyzed by the iPOND‐CPT‐release assay in cells expressing either HSS‐tagged wild‐type TONSL, or TONSL LRR* or TONSL ΔLRR mutants and depleted for endogenous TONSL by siRNA targeting 3′UTR. The experiments were quantified and shown as average; n = 2 except for LRR* n = 1; error bars, SEM. TONSL and its interaction with MMS22L are required for normal levels of RAD51 at stalled replication forks.

- A–C
Representative immunofluorescence images (A) and boxplots of endogenous MMS22L (B) and RPA2 (C) foci distribution in U2OS cells treated with the indicated replication stress‐inducing agents. Cells in silico enriched in S phase based on increased nuclear RPA2 signal were analyzed. Quantification of a representative experiment is shown; n = 3. Scale bar: 5 μm.
- D, E
Representative immunofluorescence images of MMS22L and RPA foci in U2OS cells upon collapse of HU‐stalled replication forks by treatment with the ATR inhibitor (ATRi). Cells in silico enriched in S phase based on increased nuclear RPA2 signal were analyzed. Scale bar: 5 μm. Statistical analysis: Mann–Whitney U‐test; ***P ≤ 0.0001. n = 2.
- F
Western blot analysis of cell extracts from cells used in the experiments described in Fig 4A and B. Tubulin serves as a loading control.
- G
Western blot analysis of cell extracts from cells used in a representative EM experiment described in Fig 4C–F. GAPDH serves as a loading control.
- A
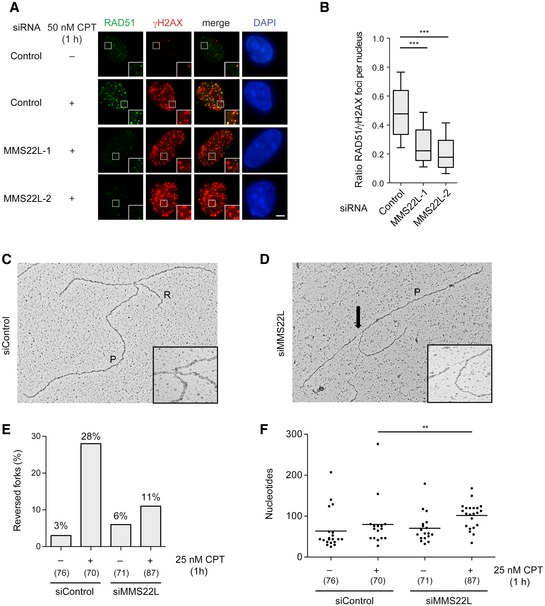
Representative immunofluorescence images of foci induced by short CPT treatment (50 nM, 1 h) in U2OS cells treated with indicated siRNAs showing the effect of MMS22L depletion on the RAD51 foci. Scale bar: 5 μm.
- B
Boxplot quantification of representative experiment in (A) (n = 3; n nuclei ≥ 78). Boxes indicate the 25–75 percentile and whiskers the 10–90 percentile; horizontal lines mark the medians. Nuclei with ≥ 25 γH2AX foci (marker of replication stress sites) were analyzed. Statistical analysis: Mann–Whitney U‐test; ***P ≤ 0.0001.
- C, D
Electron micrographs of a representative reversed fork (C) and a fork with extended ssDNA region at the junction (D) (arrow). P, parental duplex; R, regressed arm.
- E
Frequency of reversed replication forks detected by EM. Similar results were obtained in one independent experiment (n = 2). In brackets, the total number of analyzed molecules is given.
- F
Distribution of ssDNA length at replication forks isolated from U2OS cells transfected with the indicated siRNAs and treated with 25 nM CPT for 1 h. In brackets, the total number of analyzed molecules is given. Statistical analysis according to Mann–Whitney U‐test; **P ≤ 0.01, n = 2.
- A
Amylose pulldown of MBP (control) or MBP‐tagged MMS22L–TONSL and RAD51. Eluate proteins were detected by silver staining. MT: MBP‐MMS22L‐GST‐TONSL.
- B
Quantitative analysis of RAD51 binding to MMS22L–TONSL such as shown in Fig EV6A. Averages shown, n = 2; error bars, SEM.
- C, D
Yeast two‐hybrid analysis of interactions between LexA DNA‐binding domain‐tagged MMS22L and indicated proteins fused to GAL4‐activating domain (GAD) assessed by survival on media containing 3‐AT in the absence of histidine and by X‐Gal assays.
- E, F
Streptavidin pulldowns of indicated recombinant proteins and biotinylated ssDNA. The proteins in the input and eluates were detected by Western blotting.
- G
Streptavidin pulldown of HSS‐tagged MMS22L variants stably integrated and overexpressed in U2OS cells. Input and coprecipitated proteins were detected by immunoblotting.
- H
Representative immunofluorescence images of CPT‐induced foci in stable U2OS cell lines depleted of endogenous MMS22L and overexpressing indicated siRNA‐resistant variants of HSS‐MMS22L treated with 50 nM CPT for 1 h. Scale bar: 5 μm.
- I–K
Quantification of the effect of indicated MMS22L mutations on RAD51 foci in U2OS cells treated with 50 nM CPT for 1 h (I; n = 3), 50 nM CPT for 18 h (J; n = 3) or 5 μM ETP for 1 h followed by 3‐h incubation without the drug (K; n = 3). Graphs represent averaged median values; error bars indicate SEM. Statistical analysis according to one‐way ANOVA with Bonferroni post‐test; ***P ≤ 0.001; **P ≤ 0.01; ns, not significant. Representative immunofluorescence images are shown in (H), Fig EV6G and H, respectively.

- A
Quantitative analysis of RAD51 binding to MMS22L–TONSL. Proteins were mixed in the indicated ratio, the MMS22L–TONSL complex was retained on amylose beads, and proteins in the eluate were analyzed by silver staining. Lane 6, the same amount of RAD51 was used as in lane 5, but no MMS22L–TONSL (MT) was added to control for non‐specific binding of RAD51 to the resin.
- B
NiNTA pulldown of his‐tagged MMS22L and RAD51. Proteins in the eluate were detected by silver staining.
- C, D
Quantitative analysis of RAD51 binding to MMS22L. Proteins were mixed with the indicated ratio, MMS22L immobilized on NiNTA beads and the eluate analyzed by silver staining. Lane 6: the same amount of RAD51 was used as in lane 5, but no MMS22L (No M) was added to control for non‐specific binding of RAD51 to the resin. Proteins in the eluates were quantified by comparing with known amounts of MMS22L or RAD51, respectively. Averages shown, n = 2; error bars, SEM.
- E
Purification of the MMS22L FA‐TONSL complex. The MMS22L FA mutant was co‐expressed with TONSL and the complex purified from Sf9 cells using the same protocol as for wild‐type MMS22L–TONSL. Although wild‐type and mutant heterodimers purified with approximately 1:1 stoichiometry, the yield of the mutant heterodimer was dramatically lower.
- F–H
Representative microscopy images of DNA damage‐induced foci in stable U2OS cell lines depleted of endogenous MMS22L and overexpressing indicated siRNA‐resistant variants of HSS‐MMS22L treated with 50 nM CPT for 18 h (F, G) or 5 μM ETP for 1 h followed by 3‐h incubation without the drug (H). Proteins are stained using indicated antibodies. Scale bars: 5 μm.
- I, J
Western blot analysis of cell extracts from cells used in representative experiments described in Figs 2E, 5H–K and EV6F–H. Tubulin serves as a loading control.
- A
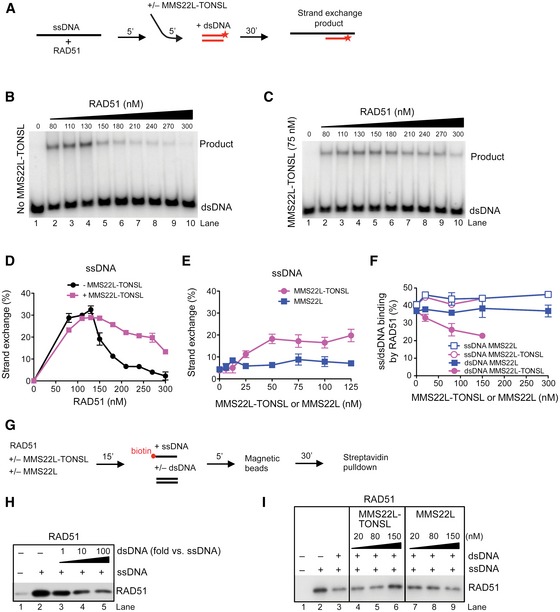
Schematic representation of the DNA strand exchange assay with ssDNA.
- B, C
Strand exchange assay with ssDNA and RAD51, and with (C) or without (B) the addition of MMS22L–TONSL (75 nM).
- D
Quantification of (B, C) shows averages, n = 2; error bars, SEM.
- E
Averages of quantified strand exchange assays with ssDNA, RAD51 (270 nM), and varying concentrations of MMS22L–TONSL or MMS22L. n = 2; error bars, SEM.
- F
Quantification of electrophoretic mobility shift assays with dsDNA or ssDNA, RAD51, and MMS22L–TONSL or MMS22L. Averages shown, n = 2; error bars, SEM.
- G
A scheme of streptavidin pulldown assay performed in (H, I).
- H
A representative immunoblot showing the effect of increasing amounts of dsDNA on RAD51 binding to ssDNA (1 nM).
- I
A representative immunoblot showing effects of MMS22L–TONSL and MMS22L titration into reactions containing RAD51, ssDNA (1 nM), and dsDNA (10 nM), as indicated.

- A–C
Quantification of DNA strand exchange with RAD51, with or without MMS22L–TONSL (75 nM) using a 3′‐tailed (A), 5′‐tailed (B), or gapped (C) DNA substrate. Averages are shown, n = 2; error bars, SEM.
- D
A representative DNA strand exchange experiment with ssDNA and RAD51, as indicated with or without ATP. See scheme in Fig 6A.
- E
A representative DNA strand exchange experiment with ssDNA, RAD51, MMS22L–TONSL (MT), as indicated with or without ATP. See scheme in Fig 6A.
- F, G
Representative DNA strand exchange experiments with a fixed concentration of RAD51 (270 nM) and varying concentrations of MMS22L–TONSL (F) or MMS22L (G). See scheme in Fig 6A.
- H, I
Representative electrophoretic mobility shift assays with MMS22L–TONSL, MMS22L, RAD51, and either dsDNA (H) or ssDNA (I). Note that MMS22L–TONSL reduces RAD51 binding to dsDNA, but does not affect binding of RAD51 to ssDNA.
- J
A representative DNA strand exchange experiment with RAD51 (120 nM), ssDNA, RPA (30 nM), and MMS22L–TONSL. Note that MMS22L–TONSL is not capable to alleviate the inhibitory effect of RPA on DNA strand exchange.
- K
MMS22L (50 nM), MMS22L–TONSL (50 nM), RAD51 (500 nM), and RPA (100 nM) were incubated with biotinylated ssDNA in a buffer containing 20 mM Tris–HCl (pH 7.5), 0.1% Triton X‐100, 0.1 mg/ml bovine serum albumin, 120 mM NaCl, 2 mM CaCl2, 10 mM magnesium acetate, 1 mM dithiothreitol with or without ATP (2 mM). MMS22L–TONSL, but not MMS22L, forms a ternary complex with ssDNA‐bound RAD51 in the presence of ATP.
- L
Similar assay as in (K), but in a buffer lacking calcium, magnesium, and ATP. Under conditions that do not favor RAD51 filament formation, MMS22L–TONSL preferentially binds RPA‐coated ssDNA.
References
Publication types
MeSH terms
Substances
Grants and funding
LinkOut - more resources
Full Text Sources
Other Literature Sources
Molecular Biology Databases
Research Materials
Miscellaneous
