

CLPP coordinates mitoribosomal assembly through the regulation of ERAL1 levels
- PMID: 27797820
- PMCID: PMC5283601
- DOI: 10.15252/embj.201694253
CLPP coordinates mitoribosomal assembly through the regulation of ERAL1 levels
Abstract
Despite being one of the most studied proteases in bacteria, very little is known about the role of ClpXP in mitochondria. We now present evidence that mammalian CLPP has an essential role in determining the rate of mitochondrial protein synthesis by regulating the level of mitoribosome assembly. Through a proteomic approach and the use of a catalytically inactive CLPP, we produced the first comprehensive list of possible mammalian ClpXP substrates involved in the regulation of mitochondrial translation, oxidative phosphorylation, and a number of metabolic pathways. We further show that the defect in mitoribosomal assembly is a consequence of the accumulation of ERAL1, a putative 12S rRNA chaperone, and novel ClpXP substrate. The presented data suggest that the timely removal of ERAL1 from the small ribosomal subunit is essential for the efficient maturation of the mitoribosome and a normal rate of mitochondrial translation.
Keywords: CLPP; ERAL1; OXPHOS deficiency; mitochondrial ribosome assembly.
© 2016 The Authors.
Figures

Targeting strategy for the conditional disruption of the Clpp gene. Map of the genomic locus region of the wild‐type Clpp gene (wild type), the targeting vector, the Clpp locus after homologous recombination (Targeted Allele) and targeted allele after Flp‐recombinase‐mediated excision of the PuroR cassette (Conditional KO Allele Clpp loxP), and the knocked‐out allele after Cre‐recombinase‐mediated excision of the exons 3–5 (Constitutive KO Allele Clpp − ). The position of primers used for genotyping is indicated by red arrows.
Southern blot analysis of targeted ES cells. Positions of wild‐type (WT, 14.7 kb) and targeted (loxP, 12.8 kb) alleles are indicated.
Genotyping analysis of wild‐type (Clpp +/+), heterozygous (Clpp +/−), and homozygous (Clpp −/−) Clpp knockout animals. DNA fragments corresponding to the wild‐type (WT, 199 bp) and knockout (KO, 273 bp) Clpp loci are indicated.
Analysis of Clpp transcript levels in heart (n = 4). Bars represent mean ± standard deviation (SD). Student's t‐test was used to determine the level of statistical difference.
Western blot analysis of CLPP protein levels in heart (He), quadriceps (Quad), liver (Li), kidney (Ki), lung (Lu), brain (Br), spleen (Sp), and pancreas (Pa). Tubulin and actin are used as loading controls. The arrowhead indicates position of CLPP, and the star indicates position of cross‐reacting bands.

- A
Correlation matrix of log2‐transformed label‐free quantification (LFQ) intensities for each biological replicate of Clpp knockout (KO) and wild‐type (WT) heart mitochondria. Reported values represent Pearson correlation coefficient.
- B
Western blot analysis of respiratory chain complexes in heart, skeletal muscle, and liver mitochondria separated by BN‐PAGE, of control (Clpp +/+) and Clpp knockout (Clpp −/−) mice. Immunoblotting was performed to detect subunits of C I (NDUFA9), C II (SDHA), C III (UQCRC1), C IV (COXI), and C V (ATP5A1). Presence of subcomplex of complex V that is likely the F1 part of the ATP synthase is indicated with an arrow.
- C, D
In‐gel activity of complex (C) I and (D) IV in heart and skeletal muscle mitochondria performed after BN‐PAGE. Position of supercomplexes (SC) and individual complexes (C I and C IV) is indicated.

Volcano plot of proteomic data reveals significant changes in proteins of the respiratory chain and factors involved in mitochondrial protein synthesis (FDR < 0.05).
Bar chart representing enriched Gene Ontology (GO) terms. FDR was calculated by Benjamini–Hochberg correction (n = 4).
Respiratory chain enzyme activities. Relative enzyme activities of respiratory chain enzyme C I (NADH coenzyme Q reductase), C I/III (NADH cytochrome c reductase), C II (succinate dehydrogenase), C II/III (succinate cytochrome c reductase), and C IV (cytochrome c oxidase) in mitochondrial extracts from wild‐type and Clpp knockout hearts (n = 5). Bars present mean levels ± SD. Statistical difference was calculated by Student's t‐test, and changes are presented in the figure (n = 5).
Substrate‐dependent oxygen consumption rates in isolated heart mitochondria. Complex I substrates (pyruvate, malate, glutamate); complex II substrate (succinate). State 3: ADP stimulated oxygen consumption rate; State 4: respiration rate after addition of oligomycin; Uncoupled: oxygen consumption rate in the presence of FCCP. Bars present mean levels ± SD. Student's t‐test was used to determine the level of statistical difference (n = 7).
Decrease in steady‐state levels of respiratory chain subunits in Clpp knockout hearts relative to wild type (set to 1). VDAC or TOMM20 was used as loading controls. Bars present mean levels ± SD. Student's t‐test was used to determine the level of statistical difference (n = 4).
Blue Native PAGE (BN‐PAGE) analysis of the respiratory chain supercomplexes followed by Western blot analysis using antibodies against C I (anti‐NDUFA9), C III (anti‐UQCRC1), and C IV (anti‐COX4A).

- A
Quantification of mtDNA levels after Southern blot analysis. Bars present mean levels ± SD (n = 4).
- B, C
Northern blot analysis and corresponding quantification of mitochondrial (B) rRNAs and mRNAs or (C) tRNAs. 18S rRNA is used as a loading control. Bars represent mean ± SD. Student's t‐test was used to determine the level of statistical difference (12S n = 5 and the rest of samples n = 4).
- D
Western blot analysis of LRPPRC levels. VDAC was used as a loading control.
- E
In organello transcription analysis upon 60 min labeling with α‐32P‐UTP.

De novo synthesized mitochondrial proteins were isolated after labeling with 35S‐methionine for 1 h. Positions of individual mitochondrial encoded proteins are indicated.
Western blot analysis of RC subunits in MEFs upon 48‐h treatment with actinonin, doxycycline, and chloramphenicol (+ antibiotic), followed by a 48‐h recovery period (− antibiotic). During both periods, proteins were isolated at 12, 24, and 48 h. Antibodies against subunits of C I (NDUFB6), C III (UQCRC1), C IV (COXI), MRPS35, and MRPL37 were used as indicated.
Quantitative analysis of the COXI recovery upon treatment with antibiotics (actinonin, doxycycline (DOXY), and chloramphenicol (CAP)) as in (B). The values represent ratios of recovered (48 h, − antibiotics) versus untreated (0 h) COXI levels. Bars represent mean ± SD. Student's t‐test was used to determine the level of statistical difference (actinonin and CAP n = 3, DOXY n = 4).
Sucrose density gradient sedimentation profile of ribosomal proteins and mtRNAs from heart mitochondria. The migration of ribosomal subunits (28S and 39S) and mitoribosome (55S) was detected by immunoblotting with antibodies against MRPS35 and MRPL12. The profile of a given mt‐RNA is calculated after qRT–PCR analysis of individual fractions and corrected for its abundance in the cell according to results from Northern blot analysis. Results of individual experiments are provided for 12S and 16S rRNA, and for mt‐mRNAs, results of distribution from two independent experiments using probes against ATP6, COXIII, and ND5 were combined. Bars represent mean ± SD. Student's t‐test was used to determine the level of statistical difference (n = 3).
Relative association of 12S rRNA, 16S rRNA, and mt‐mRNAs with mitoribosomes (55S) in Clpp knockout mitochondria comparing to wild type. Bars represent mean ± SD. Student's t‐test was used to determine the level of statistical difference (12S and 16S n = 3; mRNA n = 6).
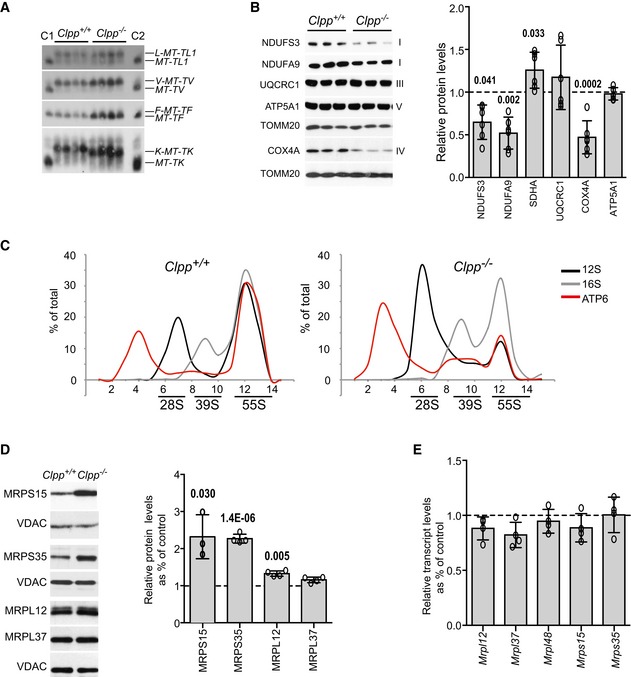
Aminoacylation assay for mitochondrial tRNA Leu1 , tRNA Val , tRNA Phe, and tRNA Lys in heart of wild‐type (Clpp +/+) and Clpp knockout (Clpp −/−) mice. Positions of charged (AA‐MT‐tRNA‐AA) and uncharged (MT‐tRNA‐AA) tRNAs are indicated. Deacylated tRNAs from wild‐type and Clpp knockout mice are used as controls (C1 and C2, respectively).
Western blot analysis and respective quantification of steady‐state levels of respiratory chain subunits from Clpp knockout MEFs (Clpp −/−) relative to wild type (Clpp +/+). Bars represent mean ± SD. Student's t‐test was used to determine the level of statistical difference (ATP5A1 n = 5; the rest n = 6).
Sucrose density gradient sedimentation profile of ribosomal transcripts from heart mitochondria. Individual mt‐RNAs were analyzed by qRT–PCR, and the abundance of RNA in each fraction is represented as percentage of the sum of the total abundance in all fractions (set to 100%).
Western blot analysis and respective quantification of steady‐state levels of mitochondrial 28S and 39S ribosomal subunits from Clpp knockout heart mitochondria relative to wild type (set to 1). Bars represent mean ± SD. Student's t‐test was used to determine the level of statistical difference (MRPS15 n = 3; the rest n = 4).
Quantitative PCR analysis of the transcript levels encoding mitochondrial 28S and 39S ribosomal subunits in Clpp knockout heart mitochondria relative to wild type (set to 1). Bars represent mean ± SD. Student's t‐test was used to determine the level of statistical difference (n = 4).

Strategy for identification of CLPP substrates and interactors in mammalian Clpp knockout (Clpp −/−) MEFs. Schemes for an empty expression plasmid or plasmids containing genes encoding the murine wild‐type (CLPPwt) and proteolytically inactive CLPP (CLPPS149A) are represented.
Assembly of the CLPP/CLPXP protease complex with the ectopically expressed wild‐type (CLPPwt) and catalytically inactive (CLPPS149A) CLPP in Clpp knockout (−/−) MEFs. Wild‐type (Clpp +/+) and Clpp knockout (Clpp −/−) MEFs were used as a control. Crude mitochondria lysed with digitonin (left panel) or whole cells lysed with Triton X‐100 (right panel) were subjected to BN‐PAGE followed by Western blot analysis.
Western blot analysis and subsequent quantification of protein levels in Clpp knockout MEFs (Clpp −/−) relative to wild‐type (Clpp +/+) cells. Tubulin is used as a loading control. Bars represent mean ± SD. Student's t‐test was used to determine the level of statistical difference (n = 6).
Western blot analysis and subsequent quantification of P32/C1QBP, PNPT1, and MRPP1 levels in Clpp knockout heart mitochondria (Clpp −/−) relative to wild type (Clpp +/+). Bars represent mean ± SD. Student's t‐test was used to determine the level of statistical difference (P32 n = 4; MRPP1 and PNPT1 n = 3). Arrowhead indicates position of the PNPT1 protein.
Cycloheximide (CHX) chase assay to determine the stability of P32/C1QBP, MRPP1, and PNPT1. Proteins are visualized by Western blot with respective antibodies. Proteins are isolated after 2, 4, 6, 8, 10, and 12 h after beginning of chase (0).

Network analysis of 66 potential CLPP substrates using only high confidence interactions (> 0.7). Known ClpXP substrates are shown in boxes with a green frame. Respiratory chain proteins and ribonucleoproteins are indicated in dark gray and orange, respectively.
Western blot analysis and subsequent quantification of ERAL1 and EFG1 levels from Clpp knockout (Clpp −/−) heart mitochondria relative to wild type (Clpp +/+). Bars represent mean ± SD. Student's t‐test was used to determine the level of statistical difference (n = 4). The arrowhead indicates positions of EFG1.
Expression levels of potential CLPP substrates from Clpp knockout (Clpp −/−) heart mitochondria relative to wild type (set to 1). Bars represent mean ± SD. Student's t‐test was used to determine the level of statistical difference (n = 4).
Cycloheximide (CHX) chase assay to determine the stability of ERAL1 and EFG1. Proteins are visualized by Western blot with respective antibodies. Proteins are isolated after 2, 4, 6, 8, 10, and 12 h after beginning of chase (0). The arrowhead indicates positions of ERAL1.
Western blot analysis and subsequent quantification of protein levels in wild‐type (C1, C2) and Clpp knockout (KO1, KO2) MEFs upon Clpx siRNA (Clpx) relative to untreated (Ctrl) wild type. Bars represent mean ± SD. Student's t‐test was used to determine the level of statistical difference (n = 6). The arrowhead indicates positions of either CLPX or ERAL1, and stars indicate position of cross‐reacting bands.

Cycloheximide (CHX) chase assay to determine the stability of NDUFV2 and NDUFS2. Proteins were visualized by Western blot with respective antibodies. Proteins were isolated after 2, 4, 6, 8, 10, and 12 h after beginning of chase (0). SDHA was used as a positive control for a putative ClpXP substrate.
Expression levels of different subunits of mitochondrial respiratory chain complexes from Clpp knockout (Clpp −/−) heart mitochondria relative to wild type (Clpp +/+, set to 1). Bars represent mean ± SD. Student's t‐test was used to determine the level of statistical difference (n = 4).
Western blot analysis and subsequent quantification of levels of putative CLPP substrates belonging to complex I (NDUFV2 and NDUFS2) or mitochondrial translation machinery (ERAL1 and EFG1) in Clpp knockout heart mitochondria (Clpp −/−) relative to wild type (Clpp +/+). Bars represent mean ± SD. Student's t‐test was used to determine the level of statistical difference (n = 4).

Sucrose density gradient sedimentation profile (“short gradients”) of ribosomal proteins and transcripts from control (Clpp +/+) and Clpp knockout (Clpp −/−) heart mitochondria. The migration of ribosomal subunits (28S and 39S) and mitoribosome (55S) was detected by immunoblotting with antibodies against MRPS35 and MRPL12. 12S rRNA was analyzed by Northern blot.
Sedimentation profiles of ERAL1, MRPS28, EFG1, CLPP, CLPX, EFTU, and MTIF2 in heart mitochondria as in (A).
Relative abundance of proteins bound to the 28S ribosomal subunit (fractions 3 and up). Bars represent mean ± SD. Student's t‐test was used to determine the level of statistical difference (ERAL1 n = 4; EFG1, CLPX, MTIF2 n = 3; EFTU n = 2).
Sucrose density gradient sedimentation profile (“long gradients” as in Fig 4D) of ERAL1, MRPS35, MRPL37, CLPX, and EFG1 from control (Clpp +/+) and Clpp knockout (Clpp −/−) heart mitochondria. The same amount of protein lysates was separated by the gradient, and the amount of each individual protein is estimated after Western blot analysis (Input). Only fractions 4–11 containing the 28S, 39S, and 55S ribosomal fractions were blotted to avoid high signals arising in free fractions (1–3).

Quantification of distribution of MRPS35 and MRPL12 on sucrose density gradient sedimentation profile of wild‐type (Clpp +/+) and Clpp knockout (Clpp −/−) heart mitochondria as in Fig 6A, presented as percentage of total. Fractions are divided into: unbound (“free”, 1–2); small ribosomal subunit (“28S”, 3–4); large ribosomal subunit (“39S”, 5–6); and assembled mitoribosomes (“55S”, 7–10). Bars represent mean ± SD. Student's t‐test was used to determine the level of statistical difference (n = 3). Statistical difference between specific fractions in wild‐type and Clpp knockout heart mitochondria is presented.
Sucrose density gradient sedimentation of MRPS35 and ERAL1 in heart mitochondria from wild‐type (Clpp +/+) and Clpp knockout (Clpp −/−) mice. In a parallel experiment, lysed mitochondria were treated with RNase A to disintegrate mitochondrial ribosomes.
Sucrose density gradient sedimentation of ERAL1 and mitoribosomal proteins upon Clpx siRNA in wild‐type (Clpp +/+) and Clpp knockout (Clpp −/−) MEFs. TOMM20 was used as a mitochondrial loading control.
Quantification of the Western blot determined steady‐state levels of respiratory chain subunits upon Clpx siRNA in a Clpp knockout (Clpp −/−) MEFs. Actin was used as loading control. Bars represent mean ± SD. Student's t‐test was used to determine the level of statistical difference (n = 3).
Western blot analysis and subsequent quantification of steady‐state levels of translational factors EFTU, MTIF2, MTIF3 in Clpp knockout heart mitochondria (Clpp −/−) relative to wild type (Clpp +/+; set to 1). Bars represent mean ± SD. Student's t‐test was used to determine the level of statistical difference (n = 4).

Coimmunoprecipitation analysis using antibodies raised against ERAL1 and CLPX proteins. Western blot analysis of input (I), control (C), and eluate (E) is shown. Asterisk indicates the cross‐reacting band.
Sucrose density gradient migration profile: association of ERAL1 with the 28S ribosomal subunit (MRPS35) upon Eral1 siRNA. TOMM20 was used as a loading control.
De novo synthesis of mitochondrial proteins in wild‐type (Clpp +/+) and Clpp knockout (Clpp −/−) MEFs upon Eral1 siRNA. Proteins were isolated after labeling with 35S‐methionine for 1 h from cells on control siRNA (Ctrl) or cells on Eral1 siRNA (Eral1). Positions of individual mitochondrial encoded proteins are indicated. Coomassie blue staining was used to ensure equal loading.
Quantification of Western blot analysis of respiratory chain subunits upon knockdown of Eral1. Levels relative to wild‐type cells treated with control siRNA (set to 1) are presented. Bars represent mean ± SD. Student's t‐test was used to determine the level of statistical difference (COXI n = 4; ATP5A1 n = 2; the rest n = 6). Combined results from 2 to 3 blots were used for quantification as only two samples of each condition are used in a single experiment. Numbers within bars represent statistical difference to control wild‐type cells, and numbers above bars represent difference in Clpp knockout cells upon Eral1 siRNA.
Western blot analysis of RC subunits upon Eral1 knockdown in MEFs. Cells (0) were treated with doxycycline for 48 h (T) and upon doxycycline removal allowed to recover for 24 h (R).
Quantification of the relative recovery of COXI and NDUFB6 upon Eral1 siRNA. The values are calculated as ratio between recovered (R) to doxycycline‐untreated (0) protein levels in Eral1 knockdown cells (Eral1) and compared to the same results obtained in control cells (Ctrl). Bars represent mean ± SD. Student's t‐test was used to determine the level of statistical difference (COXI n = 4; NDUFB6 n = 3). Numbers within bars represent statistical difference between control/Eral1 siRNA‐treated cells, and numbers above bars represent difference between +/+; Eral1 siRNA and −/−; Eral1 siRNA.

Sucrose density gradient sedimentation of ERAL1 and mitoribosomal proteins upon CAG::Eral1 overexpression (Eral1 OE) in wild‐type (Clpp +/+) MEFs compared to Clpp knockout (Clpp −/−) MEFs. TOMM20 was used as a mitochondrial loading control.
Western blot analysis of steady‐state levels of respiratory chain subunits in wild‐type (Clpp +/+; C1, C2) and Clpp knockout (Clpp −/−; KO1, KO2) MEFs upon Eral1 siRNA. TOMM20 was used as loading control.
Quantification of the steady‐state levels of ERAL1 upon Eral1 siRNA relative to wild‐type (Clpp +/+) MEFs treated with control siRNA. Bars represent mean ± SD. Student's t‐test was used to determine the level of statistical difference (n = 6).
BN‐PAGE analysis of the assembled respiratory chain super complexes in MEFs upon Eral1 siRNA. Western blot analysis was used to visualize C I (NDUFA9), C III (UQCRC1), and C V (ATP5A1).
Sucrose density gradient sedimentation of mitoribosomal proteins upon expression of wild‐type (Clpp WT) or catalytically inactive (Clpp S149A) CLPP protein in wild‐type (Clpp +/+) and Clpp knockout (Clpp −/−) MEFs. The position of ERAL1 is indicated by arrows and position of MRPS35 by arrowheads.
References
-
- Camara Y, Asin‐Cayuela J, Park CB, Metodiev MD, Shi Y, Ruzzenente B, Kukat C, Habermann B, Wibom R, Hultenby K, Franz T, Erdjument‐Bromage H, Tempst P, Hallberg BM, Gustafsson CM, Larsson NG (2011) MTERF4 regulates translation by targeting the methyltransferase NSUN4 to the mammalian mitochondrial ribosome. Cell Metab 13: 527–539 - PubMed
-
- Coenen MJ, Antonicka H, Ugalde C, Sasarman F, Rossi R, Heister JG, Newbold RF, Trijbels FJ, van den Heuvel LP, Shoubridge EA, Smeitink JA (2004) Mutant mitochondrial elongation factor G1 and combined oxidative phosphorylation deficiency. N Engl J Med 351: 2080–2086 - PubMed
-
- Cole A, Wang Z, Coyaud E, Voisin V, Gronda M, Jitkova Y, Mattson R, Hurren R, Babovic S, Maclean N, Restall I, Wang X, Jeyaraju DV, Sukhai MA, Prabha S, Bashir S, Ramakrishnan A, Leung E, Qia YH, Zhang N et al (2015) Inhibition of the mitochondrial protease ClpP as a therapeutic strategy for human acute myeloid leukemia. Cancer Cell 27: 864–876 - PMC - PubMed
Publication types
MeSH terms
Substances
Grants and funding
LinkOut - more resources
Full Text Sources
Other Literature Sources
Molecular Biology Databases
