Comparative Study
. 2016 Dec;26(12):4497-4512.
doi: 10.1093/cercor/bhw327. Epub 2016 Oct 25.

The Organization of Mouse and Human Cortico-Hippocampal Networks Estimated by Intrinsic Functional Connectivity

Affiliations
Comparative Study

The Organization of Mouse and Human Cortico-Hippocampal Networks Estimated by Intrinsic Functional Connectivity

Eyal Bergmann et al. Cereb Cortex. 2016 Dec.

Abstract

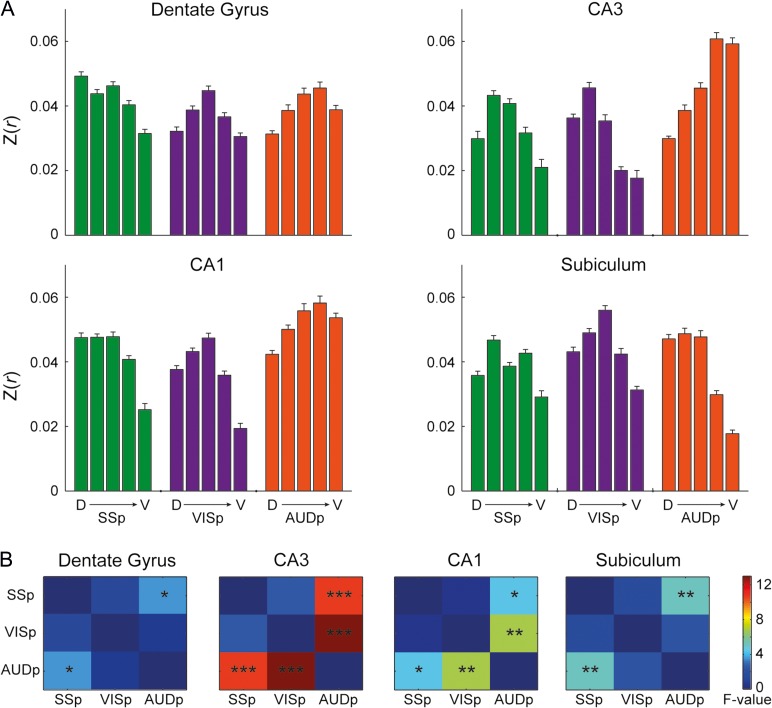
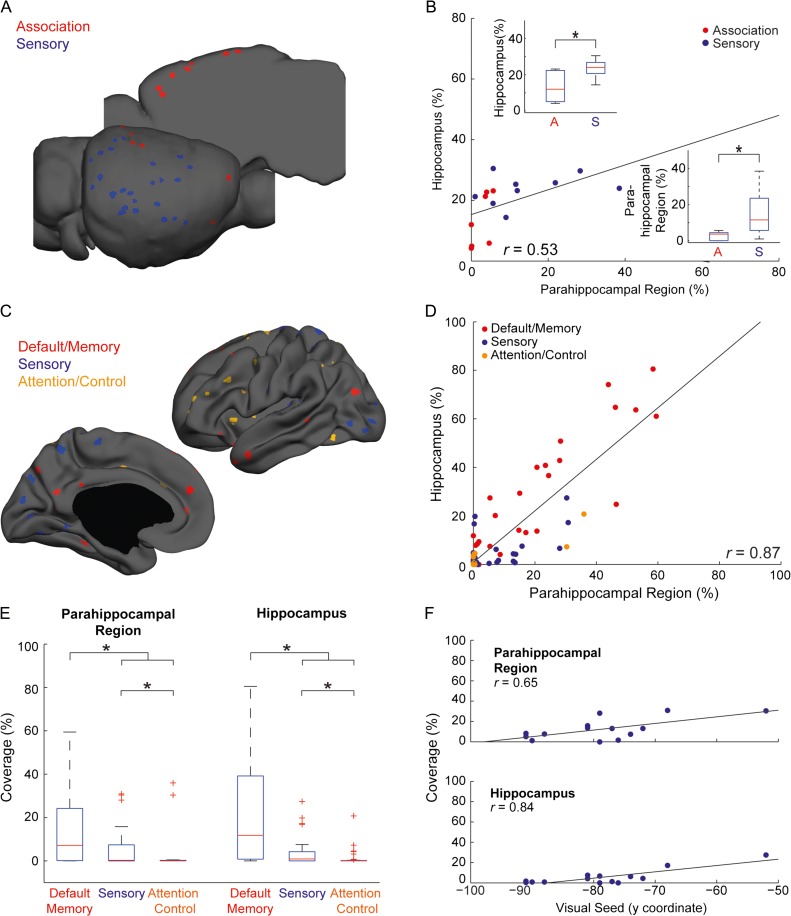
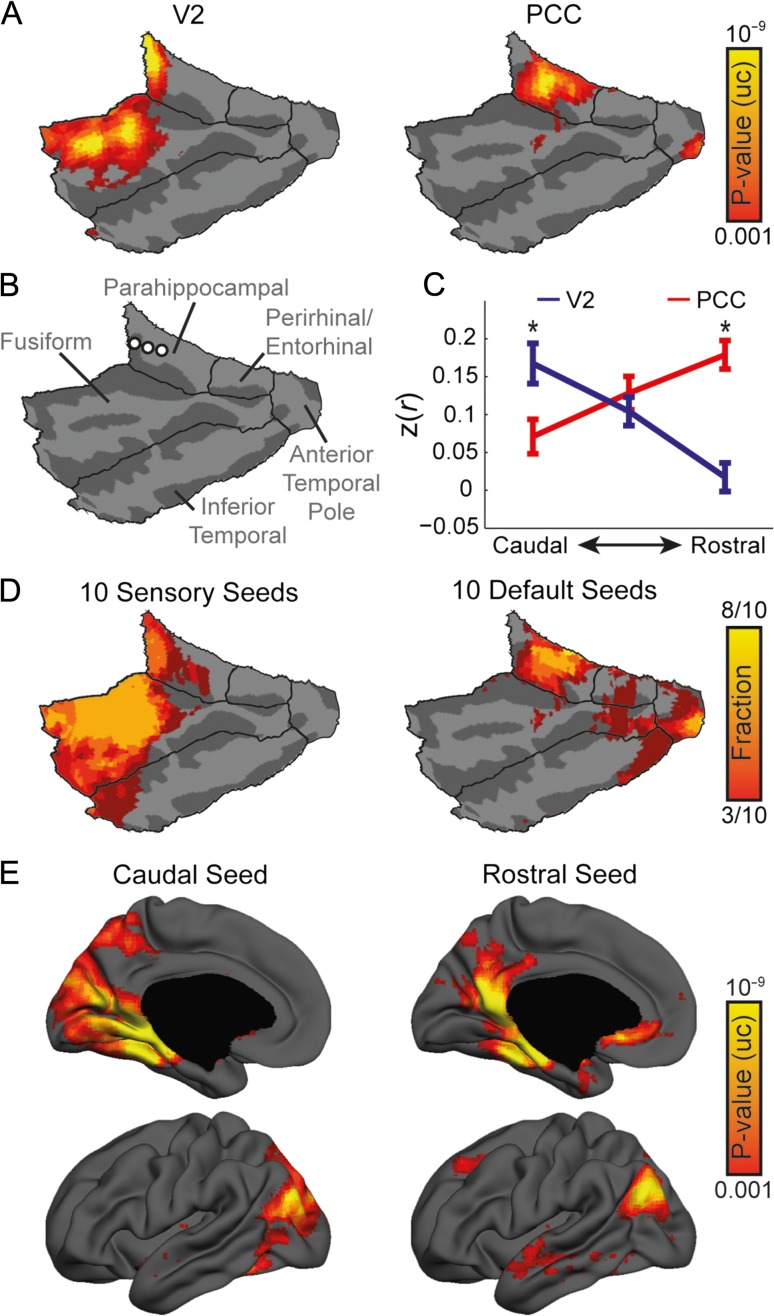
While the hippocampal memory system has been relatively conserved across mammals, the cerebral cortex has undergone massive expansion. A central question in brain evolution is how cortical development affected the nature of cortical inputs to the hippocampus. To address this question, we compared cortico-hippocampal connectivity using intrinsic functional connectivity MRI (fcMRI) in awake mice and humans. We found that fcMRI recapitulates anatomical connectivity, demonstrating sensory mapping within the mouse parahippocampal region. Moreover, we identified a similar topographical modality-specific organization along the longitudinal axis of the mouse hippocampus, indicating that sensory information arriving at the hippocampus is only partly integrated. Finally, comparing cortico-hippocampal connectivity across species, we discovered preferential hippocampal connectivity of sensory cortical networks in mice compared with preferential connectivity of association cortical networks in humans. Supporting this observation in humans but not in mice, sensory and association cortical networks are connected to spatially distinct subregions within the parahippocampal region. Collectively, these findings indicate that sensory cortical networks are coupled to the mouse but not the human hippocampal memory system, suggesting that the emergence of expanded and new association areas in humans resulted in the rerouting of cortical information flow and dissociation of primary sensory cortices from the hippocampus.

Keywords: hippocampus; mammalian brain evolution; mouse connectivity atlas; mouse fMRI; resting state.


Figures

Figure 1.
Figure 1.
Visualization of fMRI results in mice. (A) Experimental setup for awake mouse fMRI: custom-made 3D-printed cradle for fMRI in awake head-fixed mice (top); a head-fixed mouse is shown in the cradle with a 20 mm receive-only loop-coil located above the head (bottom). (B) Segmentation of the mouse parahippocampal region in the AMBC Atlas (left) and on a surface reconstruction of the mouse cortex (right). SNR map of the parahippocampal region is presented on the surface reconstruction showing high SNR in the PRC and POR, and attenuated SNR in the LEC due to susceptibility artifacts originating from the air–tissue interface near the ear canals. (C) AMBC Atlas derived segmentation of the hippocampus into subfields overlaid on the group average BOLD SE-EPI upsampled to 100 μm isotropic resolution. (D) Three-dimensional surface reconstruction of the right dentate gyrus (left) and flattened surface representation of the right dentate gyrus (right); colored segments show the relationships between the surfaces. Coordinates in the Atlas space are provided for the flattened representation, superior–inferior (S-I) relative to the dura and anterior–posterior (A-P) relative to bregma.
Figure 2.
Figure 2.
Structure–function relations in the mouse cortical somatosensory network. (A) A statistical parametric map (in red-yellow) of positive correlations of barrel-related primary somatosensory cortex (SSp-bfd) upsampled to AMBC Atlas at 100 μm3 resolution; P < 0.05, corrected for multiple comparisons using family-wise error rate correction for the whole mouse brain. (B) Anatomical connections (optical density, [OD] in blue-light blue) of SSp-bfd taken from the AMBC Atlas experiment #112951804, normalized OD > 0.1. (C) Overlap of functional and anatomical connectivity (purple) demonstrates a close agreement across the 2 modalities. (D) Estimation of reproducibility of functional connectivity demonstrates strong structure–function relations across animals. Average correlation maps were calculated for each animal; a binary threshold of 0.04 was used to estimate the overlap between animals. (E) Examination of the coverage of group-level statistically significant functional connectivity in individual animals as a function of the overlap with anatomical connectivity demonstrates higher reproducibility in overlapping voxels. (F) Within the somatosensory network, we quantified the coverage of the top 20 anatomical connections of SSp-bfd as a function of the rank-ordered SSp-bfd seed region's functional connections (purple) and region sizes (green). The graph indicates 19 out of 20 anatomical connections recapitulated by the functional connections (full results are detailed in Supplementary Table 4). AMBC Atlas labels with poor SNR (<7) or volume below the functional resolution acquisition (<0.05 mm3) were excluded from this analysis. (G) Distributions of the number of shuffled anatomical connections covered in rank-ordered functional array for the 13th (i) and 60th (ii) ranks compared to the number of veridical anatomical connections covered in functional and region-size arrays. (H, I) ROC curves demonstrate that functional connectivity is predicted by anatomical connectivity for both association (H) and sensory (I) cortices. (J) auROC curve is plotted for the 2 classes of cortical regions, revealing weaker structure–function relations in association relative to sensory cortices (central mark is the median, the edges of the box are the 25th and 75th percentiles, the whiskers extend to the most extreme data points not considered outliers, and outliers are plotted individually).
Figure 3.
Figure 3.
Convergence of sensory and association networks as opposed to spatially localized sensory mapping in the mouse parahippocampal region. (A) Functional connectivity of primary visual (VISp, left), auditory (AUDp, center) and barrel-related somatosensory (SSp-bfd, right) cortices and parahippocampal region, P < 0.05 corrected for multiple comparisons using family-wise error rate correction for the hippocampal memory system. (B) Anatomical connections between primary visual, auditory, and somatosensory cortices and the parahippocampal region. (C) Volume-based quantification of the average correlations (top) and normalized optical density (bottom) of different sensory modalities along the longitudinal axis of the parahippocampal region. Error bars indicate standard error of the mean. Functional (D) and anatomical connectivity (E) of the retorsplenial (RSP, left) and anterior cingulate (ACA, right) cortices in the parahippocampal region (similar to C, D). Functional (F) and anatomical (G) fractions of sensory (left) and association (right) regions cover the mouse parahippocampal region. In regions that contain several seeds, the functional and anatomical maps were averaged; same thresholds from (A, D) and (B, E) were used as binary thresholds for the functional and anatomical data, respectively.
Figure 4.
Figure 4.
Spatial specificity of sensory cortices mapping on the hippocampus. Statistical maps of barrel-related primary somatosensory (SSp-bfd, left), primary visual (VISp, center), and primary auditory (AUDp, right) cortices mounted on surface reconstructions of the right dentate gyrus, CA3, CA1 and subiculum reveal distinct topography (P < 0.05, corrected for multiple comparisons using family-wise error rate correction for the hippocampal memory system).
Figure 5.
Figure 5.
Preferential connectivity of sensory cortices along the hippocampal longitudinal axis. (A) Quantification of the correlations of primary sensory cortices to 5 segments along the longitudinal axis of the dentate gyrus, CA3, CA1, and subiculum demonstrates sensory mapping. We excluded the first dorsal-most and 4 ventral-most segments from the original segmentation and averaged the correlations in groups of 4 segments to create a total of 5 segments. Error bars indicate standard error of the mean. (B) Quantification of the interaction between pairs of seed regions and longitudinal axis along the hippocampal circuit. *P < 0.05, **P < 0.01, ***P < 0.001, corrected for multiple comparisons using the false-discovery rate method.
Figure 6.
Figure 6.
Comparative functional connectivity of the hippocampal memory system. (A) Seed locations in mouse cortex. (B) Quantification of the hippocampal versus parahippocampal functional connectivity to different regions in the mouse cortex reveals significant correlation and weaker functional connectivity of association cortices. The distributions of coverage for each category are shown in boxplots and demonstrate stronger representation of sensory compared to association cortices in the mouse parahippocampal region and hippocampus (P < 0.05). (C) Seed locations in the human cortex. (D) Quantification of hippocampal versus parahippocampal functional connectivity to different regions in the human cortex reveals corresponding correlations in these 2 structures. (E) Boxplots of hippocampal and parahippocampal representations of different cortical systems in humans reveal stronger representation of default/memory over sensory and attention/control cortices, as well as preferential connectivity of sensory over attention/control areas. Significant differences (P < 0.05) are marked with asterisks. (F) Quantification of hippocampal and parahippocampal functional connectivity versus seed location within the visual system reveals strong correlations that indicate hierarchical organization.
Figure 7.
Figure 7.
Divergence of sensory and association networks in the human parahippocampal region. (A) Cortico-parahippocampal analysis comparing human visual cortex (area V2) to PCC reveals divergence of sensory and association cortices in the human medial temporal lobe, specifically in PHC (P < 0.001, uncorrected). (B) Location of seeds along the rostro-caudal axis of the left PHC. See Supplementary Table 6 for coordinates in MNI space. (C) Correlation values of V2 and PCC to seeds along the rostro-caudal axis of PHC reveal differential connectivity. Asterisks represent significant differences between V2 and PCC correlations (P < 0.05). Error bars indicate standard error of the mean. (D) Statistically significant fractions of 10 sensory and default association seeds demonstrate consistent divergence within the parahippocampal region. (E) Whole-brain connectivity of seeds along the rostro-caudal axis of the parahippocampal region demonstrates transition of connectivity from visual to association networks (P < 0.001, uncorrected).

References

    1. Agster KL, Burwell RD. 2013. Hippocampal and subicular efferents and afferents of the perirhinal, postrhinal, and entorhinal cortices of the rat. Behav Brain Res. 254:50–64. - PMC - PubMed
    1. Allen TA, Fortin NJ. 2013. The evolution of episodic memory. Proc Natl Acad Sci USA. 110(Suppl):10379–10386. - PMC - PubMed
    1. Aronoff R, Matyas F, Mateo C, Ciron C, Schneider B, Petersen CCH. 2010. Long-range connectivity of mouse primary somatosensory barrel cortex. Eur J Neurosci. 31:2221–2233. - PubMed
    1. Baldassano C, Beck DM, Fei-Fei L. 2013. Differential connectivity within the parahippocampal place area. Neuroimage. 75:228–237. - PMC - PubMed
    1. Beaudin SA, Singh T, Agster KL, Burwell RD. 2013. Borders and comparative cytoarchitecture of the perirhinal and postrhinal cortices in an F1 hybrid mouse. Cereb Cortex. 23:460–476. - PMC - PubMed

Publication types

MeSH terms