. 2016 Dec 31;8(11):3529-3544.
doi: 10.1093/gbe/evw252.

Expression Variations of miRNAs and mRNAs in Rice (Oryza sativa)

Affiliations

Expression Variations of miRNAs and mRNAs in Rice (Oryza sativa)

Ming Wen et al. Genome Biol Evol. .

Abstract

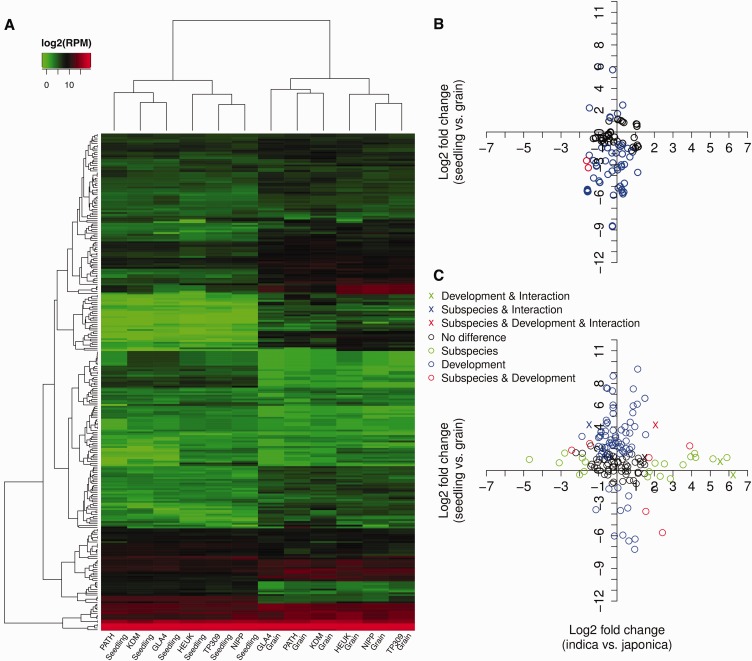
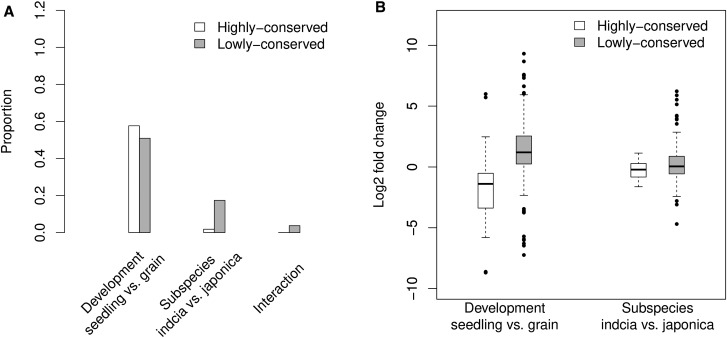
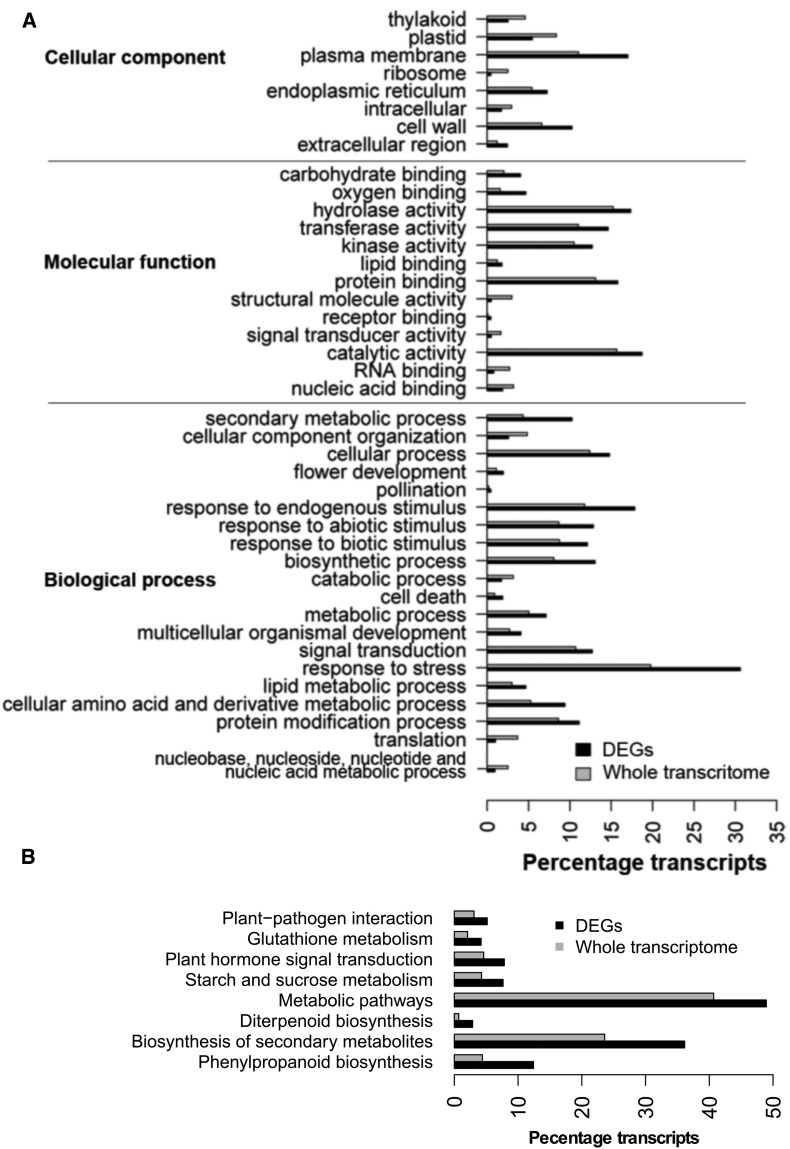
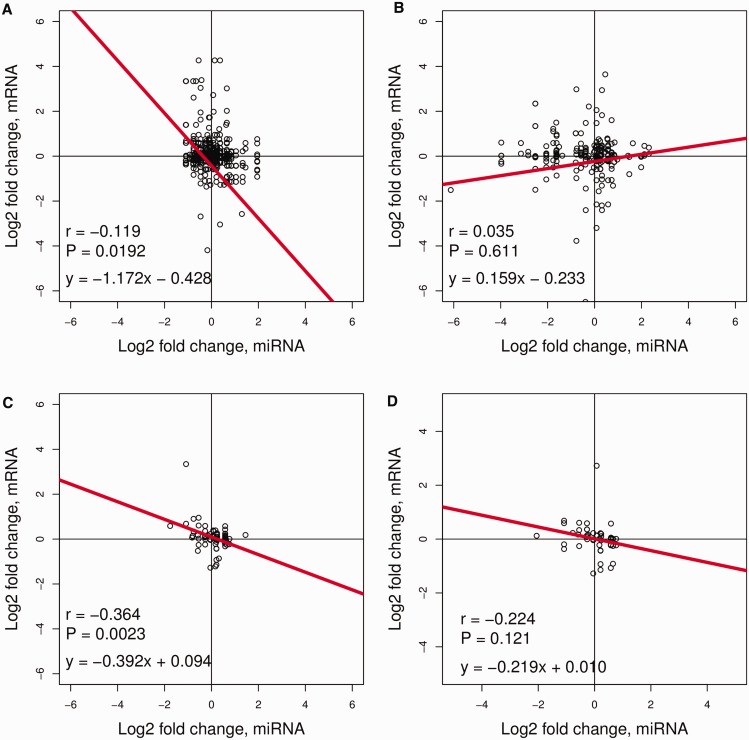
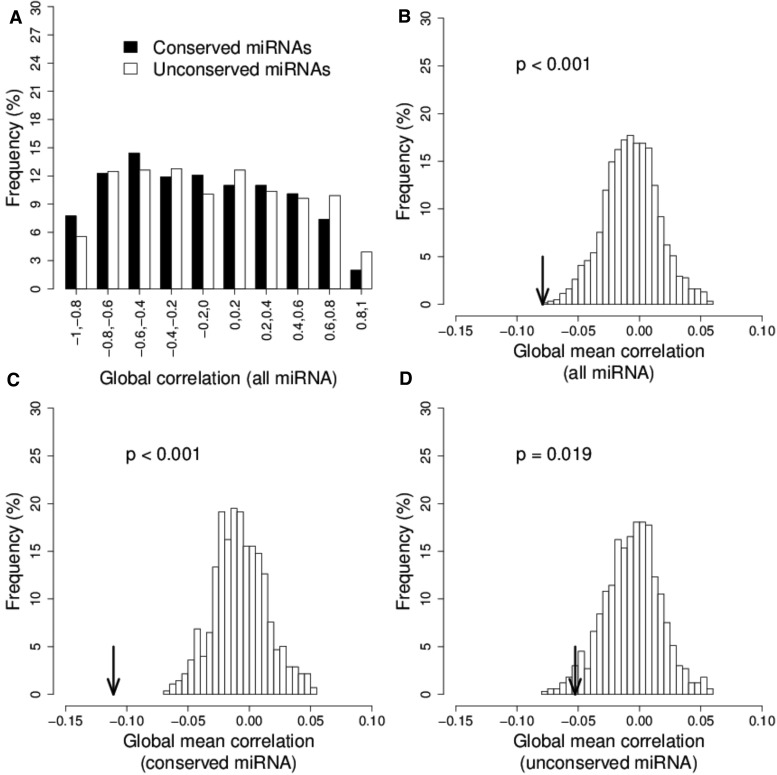
Differences in expression levels are an important source of phenotypic variation within and between populations. MicroRNAs (miRNAs) are key players in post-transcriptional gene regulation that are important for plant development and stress responses. We surveyed expression variation of miRNAs and mRNAs of six accessions from two rice subspecies Oryza sativa L. ssp. indica and Oryza sativa L. ssp. japonica using deep sequencing. While more than half (53.7%) of the mature miRNAs exhibit differential expression between grains and seedlings of rice, only 11.0% show expression differences between subspecies, with an additional 2.2% differentiated for the development-by-subspecies interaction. Expression variation is greater for lowly conserved miRNAs than highly conserved miRNAs, whereas the latter show stronger negative correlation with their targets in expression changes between subspecies. Using a permutation test, we identified 51 miRNA-mRNA pairs that correlate negatively or positively in expression level among cultivated rice. Genes involved in various metabolic processes and stress responses are enriched in the differentially expressed genes between rice indica and japonica subspecies. Our results indicate that stabilizing selection is the major force governing miRNA expression in cultivated rice, albeit positive selection may be responsible for much of the between-subspecies expression divergence.

Keywords: expression variation; mRNA; microRNA; rice.


Figures

<sc>Fig</sc>. 1.—
Fig. 1.—
Expression variation of known miRNAs in rice. (A) Heat map and unsupervised hierarchical clustering of known miRNA expression. The color key represented the scale of the relative expression levels of the miRNAs (log2 RPM). KDM: indica cv. Khal Dawk Mali 105; GLA4: indica cv. Guangluai 4; PATH: indica cv. Rathuwee; TP309: japonica cv. Taipei 309; HEUK: japonica cv.Heukgyeong; NIPP: japonica cv.Nipponbare. (B, C) Scatter plot of differentially expressed highly conserved (B) and lowly conserved (C) miRNAs. A generalized Poisson-regression linear model was used to identify the differentially expressed miRNAs for the factors of development, subspecies, and development-by-subspecies interaction. MiRNAs with fold change ≥ 2 and FDR ≤ 0.05 are denoted as significantly differentially expressed. Mature miRNAs that show no differential expression (black) or show significant differential expression between subspecies (green), developmental stage (blue) and both (red) are indicated by circles in different colors, while those with differential expression for the additional factor of development-by-subspecies interaction are indicated by crosses with the same color setting.
<sc>Fig</sc>. 2.—
Fig. 2.—
Expression variation of the highly conserved and lowly conserved miRNAs between subspecies or developmental stages. (A) The proportions of differentially expressed miRNAs in both sets of the highly conserved and lowly conserved miRNAs. A generalized Poisson-regression linear model was used to identify the differentially expressed miRNAs for the factors of development, subspecies, and development-by-subspecies interaction. MiRNAs with fold change ≥ 2 and FDR ≤ 0.05 are denoted as significantly differentially expressed. MiRNAs that show significantly differential expression between subspecies or interactions are enriched in the lowly conserved miRNAs (Fisher's Exact Test, P-value ≪ 0.01). (B) Fold changes in expression of the highly conserved and lowly conserved miRNAs between subspecies or developmental stages. The lowly conserved miRNAs exhibit significantly more variation in expression than the highly conserved miRNAs for both comparisons (Kolmogorov–Smirnov test, P-value ≪ 0.01).
<sc>Fig</sc>. 3.—
Fig. 3.—
Gene ontology (GO) and KEGG pathway enrichment analyses of DEGs. The DEGs (FDR ≤ 0.05) with a fold change larger than 2 or 1.5 were used for the enrichment analyses of GO terms and KEGG pathways, respectively. The significantly over-represented and under-represented GO terms (A) and KEGG pathways (B) with a FDR ≤ 0.05 were presented. Grey and black bars indicate the percentages of DEGs and the whole transcriptome that were classified into different functional annotations, respectively.
<sc>Fig</sc>. 4.—
Fig. 4.—
Correlation between the coexpressed miRNAs and their targets in seedlings. (A) highly conserved miRNAs and their predicted targets (390 pairs); (B) lowly conserved miRNAs and their predicted targets (219 pairs); (C) miRNAs and the degradome-verified targets in target set IV (Zhou et al. 2010) (68 pairs) and (D) miRNAs and the degradome-verified targets in target set II (Wu et al. 2009) (49 pairs). The log2 fold changes of miRNA or mRNA expression between rice indica and japonica subspecies in seedlings were used for Pearson’s correlation analysis.
<sc>Fig</sc>. 5.—
Fig. 5.—
Permutation of miRNA–mRNA target relationships at the lineage level. (A) The empirical distribution of the Pearson’s correlation coefficient values for 436 miRNA–mRNA pairs between expression levels of 96 miRNAs and those of their target mRNAs across 6 lineages. (B) The histogram plot represents the distribution of the global mean correlation values for the expression levels of all miRNA–mRNA pairs for 1,000 permutations, (C) for the highly conserved miRNAs and (D) for the lowly conserved miRNAs. The black arrowhead indicates the true value.

Similar articles

Cited by

References

    1. Alon U. 2007. Network motifs: theory and experimental approaches. Nat Rev Genet. 8(6):450–461. - PubMed
    1. Ashburner M, Ball CA, Blake JA, Botstein D, Butler H, et al. 2000. Gene Ontology: tool for the unification of biology. Nat Genet. 25(1):25–29. - PMC - PubMed
    1. Axtell MJ. 2013. Classification and comparison of small RNAs from plants. Annu Rev Plant Biol. 64:137–159. - PubMed
    1. Bari R, Datt Pant B, Stitt M, Scheible WR. 2006. PHO2, microRNA399, and PHR1 define a phosphate-signaling pathway in plants. Plant Physiol. 141(3):988–999. - PMC - PubMed
    1. Bartel D. 2004. MicroRNAs: genomics, biogenesis, mechanism, and function. Cell 116(2):281–297. - PubMed

Publication types

MeSH terms