. 2016 Oct 19;36(42):10853-10869.
doi: 10.1523/JNEUROSCI.1770-16.2016.

Conditional Deletion of the L-Type Calcium Channel Cav1.2 in Oligodendrocyte Progenitor Cells Affects Postnatal Myelination in Mice

Affiliations

Conditional Deletion of the L-Type Calcium Channel Cav1.2 in Oligodendrocyte Progenitor Cells Affects Postnatal Myelination in Mice

Veronica T Cheli et al. J Neurosci. .

Abstract

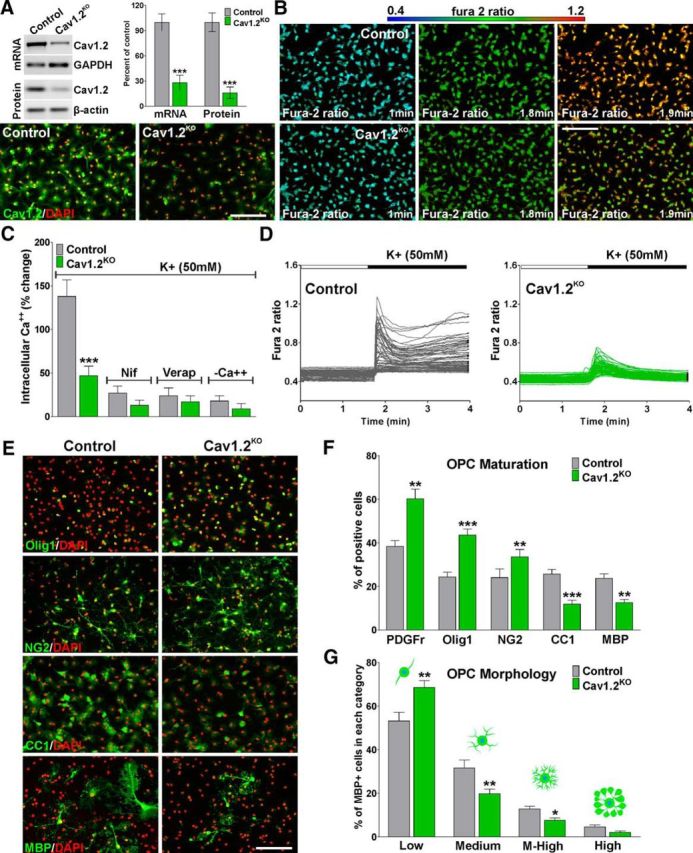
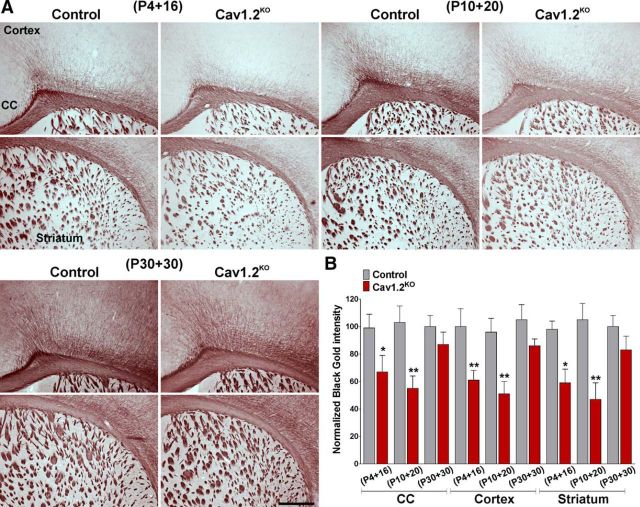
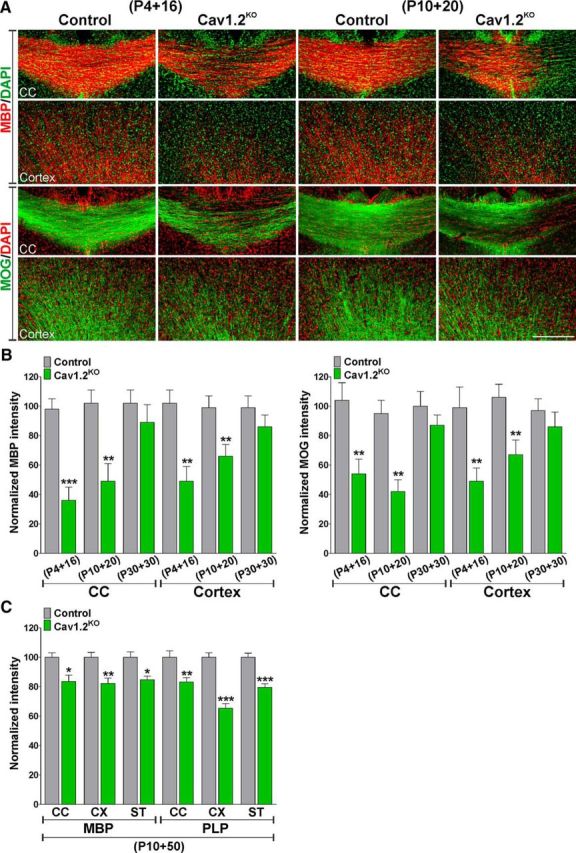
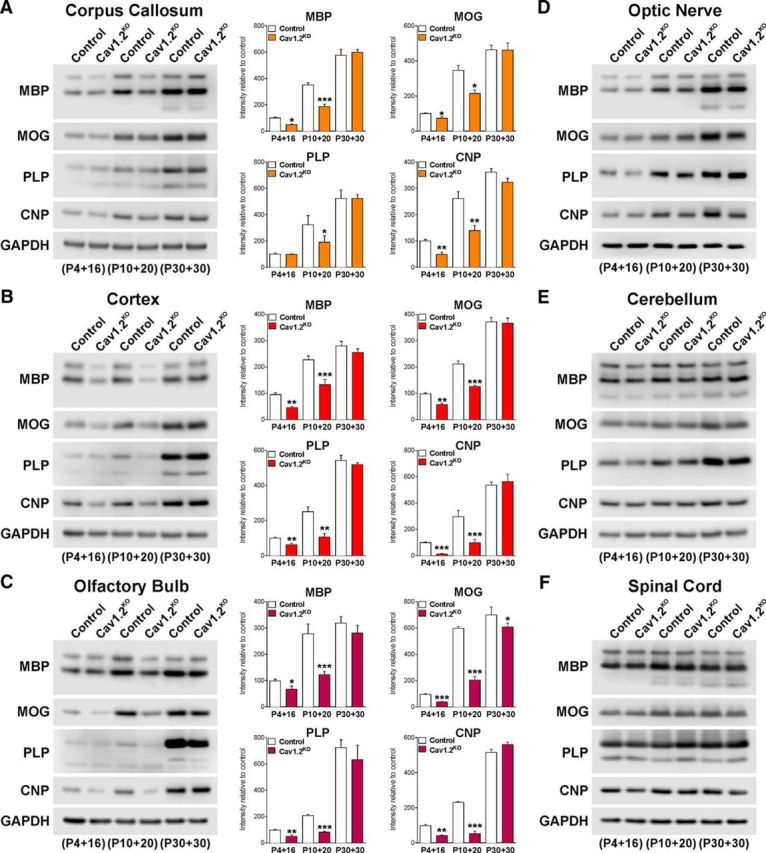
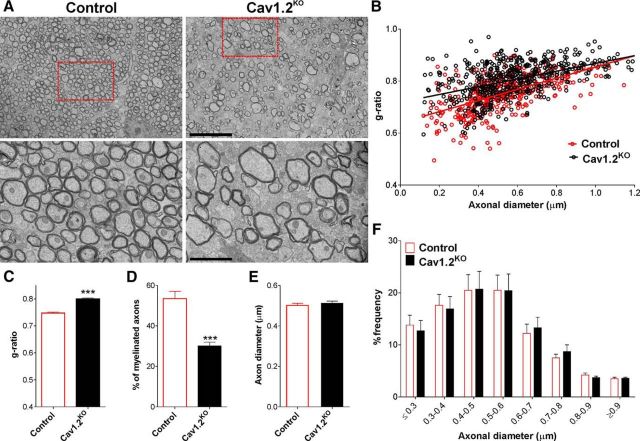
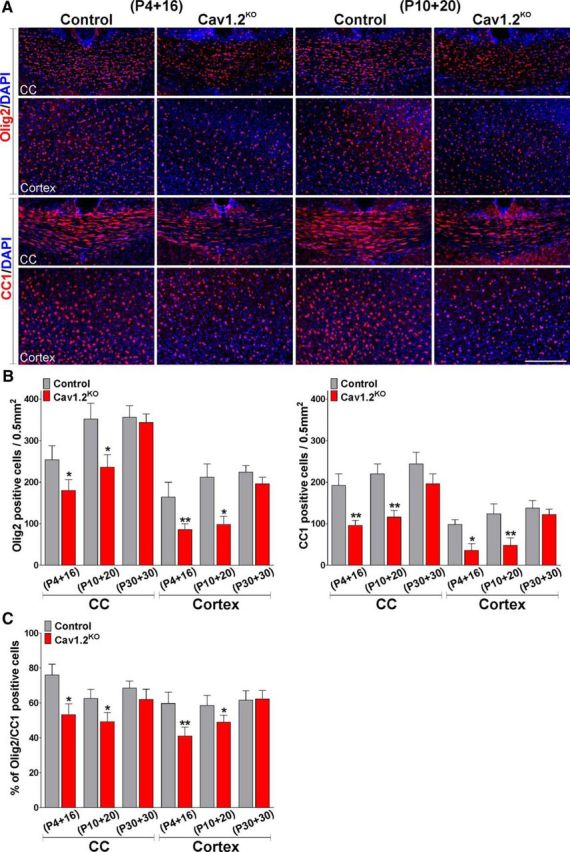
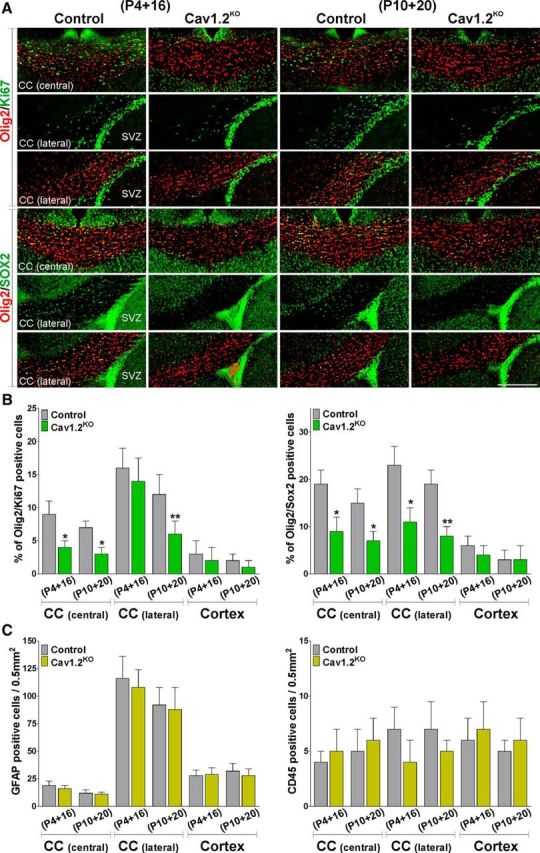
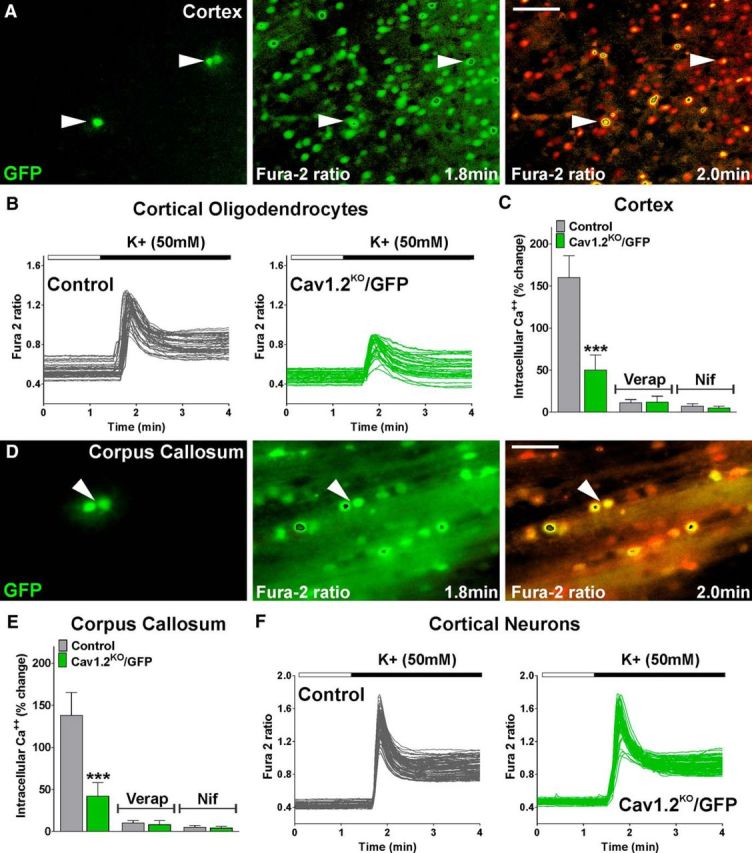
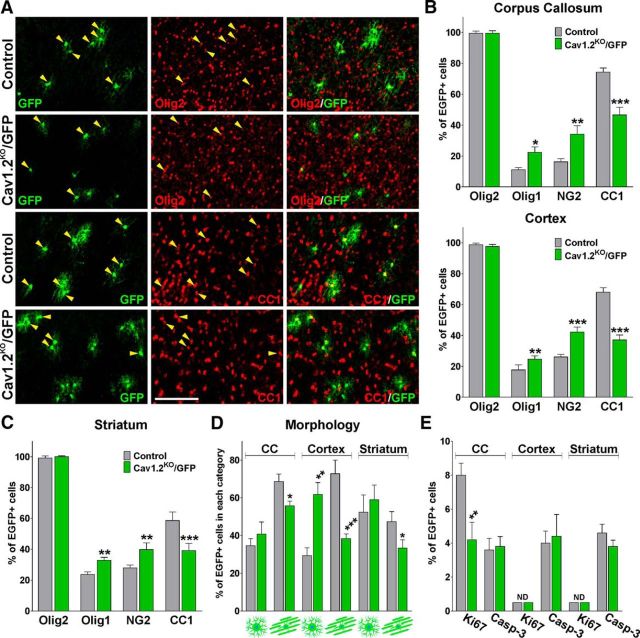
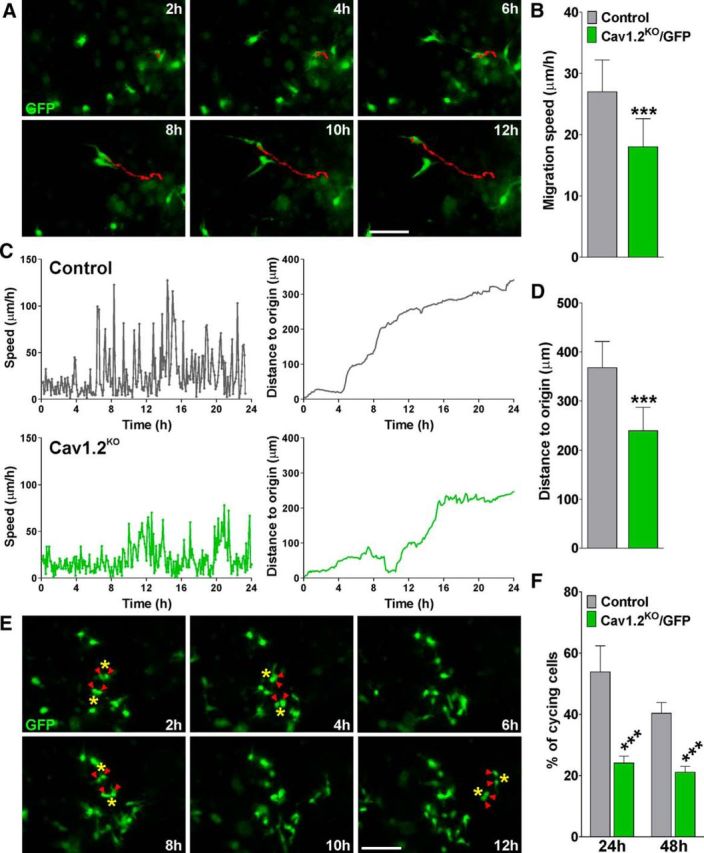
To determine whether L-type voltage-operated Ca2+ channels (L-VOCCs) are required for oligodendrocyte progenitor cell (OPC) development, we generated an inducible conditional knock-out mouse in which the L-VOCC isoform Cav1.2 was postnatally deleted in NG2-positive OPCs. A significant hypomyelination was found in the brains of the Cav1.2 conditional knock-out (Cav1.2KO) mice specifically when the Cav1.2 deletion was induced in OPCs during the first 2 postnatal weeks. A decrease in myelin proteins expression was visible in several brain structures, including the corpus callosum, cortex, and striatum, and the corpus callosum of Cav1.2KO animals showed an important decrease in the percentage of myelinated axons and a substantial increase in the mean g-ratio of myelinated axons. The reduced myelination was accompanied by an important decline in the number of myelinating oligodendrocytes and in the rate of OPC proliferation. Furthermore, using a triple transgenic mouse in which all of the Cav1.2KO OPCs were tracked by a Cre reporter, we found that Cav1.2KO OPCs produce less mature oligodendrocytes than control cells. Finally, live-cell imaging in early postnatal brain slices revealed that the migration and proliferation of subventricular zone OPCs is decreased in the Cav1.2KO mice. These results indicate that the L-VOCC isoform Cav1.2 modulates oligodendrocyte development and suggest that Ca2+ influx mediated by L-VOCCs in OPCs is necessary for normal myelination.

Significance statement: Overall, it is clear that cells in the oligodendrocyte lineage exhibit remarkable plasticity with regard to the expression of Ca2+ channels and that perturbation of Ca2+ homeostasis likely plays an important role in the pathogenesis underlying demyelinating diseases. To determine whether voltage-gated Ca2+ entry is involved in oligodendrocyte maturation and myelination, we used a conditional knock-out mouse for voltage-operated Ca2+ channels in oligodendrocyte progenitor cells. Our results indicate that voltage-operated Ca2+ channels can modulate oligodendrocyte development in the postnatal brain and suggest that voltage-gated Ca2+ influx in oligodendroglial cells is critical for normal myelination. These findings could lead to novel approaches to intervene in neurodegenerative diseases in which myelin is lost or damaged.

Keywords: Cav1.2; calcium; myelination; oligodendrocytes; voltage-operated Ca2+ channels.


Figures

Figure 1.
Figure 1.
Delayed in vitro maturation of Cav1.2KO OPCs. A, After 3 d of 4-OH-tamoxifen treatment, semiquantitative RT-PCR and Western blot analysis of Cav1.2 expression in OPCs was performed using GAPDH and β-actin, respectively, as internal standards. In addition, the expression of Cav1.2 was analyzed by immunocytochemistry. Scale bar, 80 μm. B, VOCC activity was examined in OPCs from control and Cav1.2KO mice using high K+ (50 mm). Fura-2 images were obtained with specific filters at 2 s intervals for a total of 4 min. Each frame represents a single section of a fura-2 time-lapse experiment. An increased fura-2 fluorescence ratio is indicated by warmer colors. Time is denoted in minutes in the bottom right corner. Scale bar, 80 μm. C, Ca2+ uptake was stimulated in control and Cav1.2KO cells using high K+ (50 mm) in the presence of nifedipine (5 μm), verapamil (5 μm), and zero Ca2+ medium (−Ca2+). The bar graph shows the average amplitude of the Ca2+ response, calculated from the responding cells expressed as a percentage of change of the emission intensities. D, Fura-2 imaging of Ca2+ responses to 50 mm K+ in control and Cav1.2KO OPCs. Note that each trace corresponds to a single cell and the horizontal bar indicates the time of high K+ addition. E, F, Two days after mitogen withdrawal, OPCs were stained with antibodies against PDGFr, Olig1, NG2, CC1, and MBP and the percentage of positive cells in each experimental condition was examined by confocal microscopy. Scale bar, 80 μm. G, Morphological complexity of MBP-positive cells was scored in four categories. Values are expressed as mean ± SEM of at least five independent experiments. *p < 0.05, **p < 0.01, ***p < 0.001 versus control.
Figure 2.
Figure 2.
Black Gold II staining for myelin in the Cav1.2KO brain. A, Black Gold II staining in the brains of control and Cav1.2KO mice injected at P4, P10, and P30. Representative coronal sections of the lateral area of the corpus callosum (CC) and the striatum are shown. Scale bar, 360 μm. B, Black Gold II staining intensity was quantified in the CC, the cingulate cortex (cortex), and striatum. Values are expressed as mean ± SEM of four independent experiments. *p < 0.05, **p < 0.01 versus the respective controls.
Figure 3.
Figure 3.
Reduced myelin protein synthesis in the postnatal Cav1.2KO brain. A, Representative coronal sections of the central area of the corpus callosum (CC) and the cingulate cortex (cortex) of control and Cav1.2KO mice injected at P4 and P10 and immunostained with anti-MBP and anti-MOG antibodies. Scale bar, 180 μm. B, Myelin was quantified by analyzing fluorescence intensity of MBP and MOG in the CC and in the cingulate cortex (cortex). C, Control and Cav1.2KO mice were injected at P10 and immunostained with anti-MBP and anti-PLP antibodies at P60. Myelin was quantified by analyzing fluorescence intensity of MBP and PLP in the CC, cingulate cortex (CX), and striatum (ST). Values are expressed as mean ± SEM of four independent experiments. *p < 0.05, **p < 0.01, ***p < 0.001 versus the respective controls.
Figure 4.
Figure 4.
Western blot analysis of myelin protein expression. Total proteins were collected from the corpus callosum (A), cortex (B), olfactory bulb (C), optic nerve (D), cerebellum (E), and spinal cord (F) of Cav1.2KO animals to assess the expression of MBP, MOG, PLP, and CNP by Western blot. Representative Western blots are shown. GAPDH was used as the internal standard and data from four independent experiments are summarized based on the relative spot intensities and plotted as percentage of the P4 control. Because no statistical differences between experimental groups were detected, the quantitative bar graphs for DF are not shown. Values are expressed as mean ± SEM of four independent experiments. *p < 0.05, **p < 0.01, ***p < 0.001 versus the respective controls.
Figure 5.
Figure 5.
Electron microscopy of the Cav1.2KO corpus callosum. A, Electron micrographs of axons in the corpus callosum of control and Cav1.2KO mice injected at P10. Scale bars, 8 μm top, 2 μm bottom. B, C, Scatter plot and mean g-ratio values in the corpus callosum of control and Cav1.2KO mice. D, Percentage of myelinated axons in the corpus callosum of control and Cav1.2KO mice. E, F, Mean axonal diameter and distribution of axonal size in control and Cav1.2KO mice fibers. Values are expressed as mean ± SEM. Five animals per experimental group and 100 fibers per animal were analyzed. ***p < 0.001 versus control.
Figure 6.
Figure 6.
Decreased number of mature oligodendrocytes in the Cav1.2KO mouse. A, Representative coronal sections of the central area of the corpus callosum (CC) and the cingulate cortex (cortex) of control and Cav1.2KO mice injected at P4 and P10 and immunostained with anti-Olig2 and anti-CC1 antibodies. Scale bar, 180 μm. B, C, Number of Olig2-, CC1-, and Olig2/CC1-positive cells was quantified stereologically in the central area of the CC and in the cingulate cortex (cortex) of control and Cav1.2KO mice. Values are expressed as mean ± SEM of four independent experiments. *p < 0.05, **p < 0.01 versus the respective controls.
Figure 7.
Figure 7.
OPC proliferation in the Cav1.2KO mouse. A, Representative coronal sections of the central and lateral areas of the corpus callosum (CC) of control and Cav1.2KO mice injected at P4 and P10 and immunostained with anti-Olig2, anti-Ki67, and anti-Sox2 antibodies. Scale bar, 180 μm. B, C, Number of Olig2/Ki67-, Olig2/Sox2-, GFAP-, and CD45-positive cells was quantified stereologically in the central and lateral areas of the CC and in the cingulate cortex (cortex) of control and Cav1.2KO mice. Values are expressed as mean ± SEM of four independent experiments. *p < 0.05, **p < 0.01 versus the respective controls.
Figure 8.
Figure 8.
Reduced in situ L-VOCC activity in Cav1.2KO oligodendrocytes. A, D, Fura-2 time-lapse series of control GFP-positive OPCs located in the somatosensory cortex and in the lateral area of the corpus callosum at P10. Scale bar, 40 μm. Arrowheads indicate GFP-positive cells that were selected for the analysis. An increased fura-2 fluorescence ratio is indicated by warmer colors and time is denoted in minutes in the lower right corner. B, F, L-VOCC activity was examined in cortical OPCs and in cortical neurons from control and Cav1.2KO/GFP mice at P10. Note that each trace corresponds to a single cell and the horizontal bar indicates the time of high K+ addition. C, E, Cortical and callosal OPCs from control and Cav1.2KO/GFP mice were also stimulated with high K+ (50 mm) in the presence of verapamil (5 μm) and nifedipine (5 μm). The graphs show the average amplitude calculated from the responding cells expressed as percentage of change of the emission intensities. Values are expressed as mean ± SEM of at least four independent experiments. ***p < 0.001 versus the respective controls.
Figure 9.
Figure 9.
Decreased maturation of Cav1.2KO/GFP OPCs in the postnatal brain. A, Representative coronal sections of the cingulate cortex of control and Cav1.2KO/GFP mice injected at P4 and immunostained with anti-Olig2 and anti-CC1 antibodies. Scale bar, 150 μm. B, C, Number of double-positive cells for Olig2, Olig1, NG2, and CC1 was quantified stereologically in the corpus callosum, cingulate cortex, and striatum. D, Morphological examination of GFP-positive cells in the same brain areas. E, Proportion of double-positive cells for Ki67 and caspase-3 was quantified stereologically in the corpus callosum, cingulate cortex, and striatum. Values are expressed as mean ± SEM of four independent experiments. *p < 0.05, **p < 0.01, ***p < 0.001 versus the respective controls.
Figure 10.
Figure 10.
Migration and proliferation of Cav1.2KO/GFP OPCs in living tissue. A, Time-lapse series of control GFP-expressing OPCs in the dorsolateral SVZ. Each frame represents a single section of a time-lapse video sequence. Time is denoted in hours in the upper right corner. A reconstruction of the path of cell movement for a single GFP-expressing OPC is shown. Scale bar, 150 μm. B, D, Average cell migration speed and the distance traveled from the origin was calculated from at least 40 cells in each genotype. C, Analysis of migration speed and distance traveled from the origin in two representative GFP-expressing OPCs. E, Examples of cytokinetic events in GFP-labeled OPCs from control mice in the dorsolateral SVZ. F, Percentage of control and Cav1.2KO/GFP-cycling cells was analyzed by visual observation through counting the total number of cell divisions during the complete time-lapse experiment. Values are expressed as mean ± SEM of at least four independent experiments. ***p < 0.001 versus control cells. Scale bar, 150 μm.

Comment in

References

    1. Akopian G, Kressin K, Derouiche A, Steinhäuser C. Identified glial cells in the early postnatal mouse hippocampus display different types of Ca++ currents. Glia. 1996;17:181–194. - PubMed
    1. Amur-Umarjee S, Phan T, Campagnoni AT. Myelin basic protein mRNA translocation in oligodendrocytes is inhibited by astrocytes in vitro. J Neurosci Res. 1993;36:99–110. doi: 10.1002/jnr.490360111. - DOI - PubMed
    1. Bahr BA, Kessler M, Rivera S, Vanderklish PW, Hall RA, Mutneja MS, Gall C, Hoffman KB. Stable maintenance of glutamate receptors and other synaptic components in long-term hippocampal slices. Hippocampus. 1995;5:425–439. doi: 10.1002/hipo.450050505. - DOI - PubMed
    1. Berger T, Schnitzer J, Orkand PM, Kettenmann H. Sodium and calcium currents in glial cells of the mouse corpus callosum slice. Eur J Neurosci. 1992;4:1271–1284. doi: 10.1111/j.1460-9568.1992.tb00153.x. - DOI - PubMed
    1. Borges K, Wolswijk G, Ohlemeyer C, Kettenmann H. Adult rat optic nerve oligodendrocyte progenitor cells express a distinct repertoire of voltage- and ligand-gated ion channels. J Neurosci Res. 1995;40:591–605. doi: 10.1002/jnr.490400504. - DOI - PubMed

Publication types