. 2016 Oct 19;36(42):10908-10919.
doi: 10.1523/JNEUROSCI.0229-16.2016.

In Utero Exposure to Valproic Acid Induces Neocortical Dysgenesis via Dysregulation of Neural Progenitor Cell Proliferation/Differentiation

Affiliations

In Utero Exposure to Valproic Acid Induces Neocortical Dysgenesis via Dysregulation of Neural Progenitor Cell Proliferation/Differentiation

Kimino Fujimura et al. J Neurosci. .

Abstract

Valproic acid (VPA), a widely used antiepileptic drug, is an inhibitor of histone deacetylases, which epigenetically modify cell proliferation/differentiation in developing tissues. A series of recent clinical studies in humans reported that VPA exposure in utero impaired histogenesis and the development of the central nervous system, leading to increased risks of congenital malformation and the impairment of higher brain functions in children. In the present study conducted in mice, we report that VPA exposure in utero (1) increases the amount of acetylated histone proteins, (2) alters the expression of G1-phase regulatory proteins, (3) inhibits the cell cycle exit of neural progenitor cells during the early stage of neocortical histogenesis, and (4) increases the production of projection neurons distributed in the superficial neocortical layers in embryonic brains. Together, our findings show that VPA exposure in utero alters proliferation/differentiation characteristics of neural progenitor cells and hence leads to the neocortical dysgenesis.

Significance statement: This study provides new insight into the mechanisms of how an altered in utero environment, such as drug exposure, affects the generation of neurons prenatally. The antiepileptic drug valproic acid (VPA) is a good target molecule as in utero exposure to VPA has been repeatedly reported to increase the risk of nervous system malformations and to impair higher brain functions in children. We show that VPA decreases the probability of differentiation of the neural progenitor cells (NPCs) in mice, resulting in an abnormally increased number of projection neurons in the superficial layers of the neocortex. Further, we suggest that histone deacetylase inhibition by VPA may be involved in the dysregulation of proliferation/differentiation characteristics of NPCs.

Keywords: deacetylation; histone; neocortex; neural progenitor cell; neuronogenesis.


Figures

Figure 1.
Figure 1.
The plasma concentration of valproic acid (VPA) of pregnant mothers under ad libitum access to drinking water containing 0.4% VPA, measured on gestation day 7, 10, 13, and 16. Closed circle, Plasma VPA concentration of each mouse; open squares, mean. The gray box indicates the plasma VPA concentration reportedly increased seizure threshold by 50% in mice (Löscher, 1999). Error bars, SEM.
Figure 2.
Figure 2.
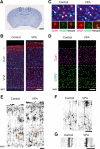
Effects of VPA exposure in utero on the histological architecture of the neocortices on postnatal day 21 (P21). A, A low-magnification view of a coronal section of a VPA-exposed brain stained with cresyl violet. Black squares correspond to the primary somatosensory area of neocortices (field 1). Scale bar, 1 mm. B, High-power views of the neocortical field 1 in controls and the VPA-exposed mice immunohistochemically stained for GABA. White dashed lines, Boundaries between neocortical layers I/II–IV, II–IV/V–VI, and gray matter/white matter (wm). Scale bar, 100 μm. C, A higher magnification of field 1, immunohistochemically double stained for GABA and GAD67. Dashed arrow, GAD67-positive GABAergic interneurons; arrows, non-GABAergic projection neurons; arrowhead, glial cells. Scale bar, 10 μm. D, Field 1 immunohistochemically stained for Cux1 and CTIP2. Red, Cux1-positive neurons; green, CTIP2-positive neurons. Scale bar, 100 μm. E, Field 1 stained with Golgi's silver staining technique. Orange arrowheads, Pyramidal neurons. Scale bar, 100 μm. Note that brains stained with Golgi's silver staining technique are larger than brains shown in AD due to the difference in fixing condition. F, Pyramidal neurons indicated by the orange arrowheads in E. Scale bar, 100 μm. G, Apical dendrites of the pyramidal neurons shown in F. Scale bar, 10 μm.
Figure 3.
Figure 3.
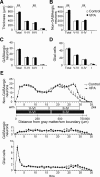
Effects of VPA exposure in utero on the neocortical thickness and the numbers of neurons and glial cells on P21. A, The thickness of representative neocortical layers. B, The number of non-GABAergic projection neurons in representative neocortical layers. Counting areas, 250 μm in width and the total neocortical thickness in height. C, The number of GABAergic interneurons. D, The number of glial cells. E, The number of non-GABAergic projection neurons, GABAergic interneurons, and glial cells counted in each bin (250 μm in width and 25 μm in height) lined serially from the gray matter/white matter boundary (wm) to the pial surface (pia) in the neocortical field 1. Analysis using a linear mixed-effects model showed a significant interaction between the increased number of non-GABAergic projection neurons and layers II–IV in the VPA-exposed mice (p = 0.004). White and black boxes under the abscissa indicate layers V–VI/II–IV in the neocortices of controls and the VPA-exposed mice, respectively. **p < 0.01. Error bars, SEM.
Figure 4.
Figure 4.
Effects of VPA exposure in utero on the structure of embryonic forebrains/telencephala. A, Low-magnification lateral views of controls and the VPA-exposed embryos on embryonic day 11 (E11). Scale bar, 1 mm. B, The maximum mediolateral length (width) of forebrains/telencephala from E10 to E18. C, The thickness of dorsomedial cerebral walls from E10 to E18. D, Stratification of the dorsomedial cerebral walls from E10 to E18. The upper border of the ventricular zone (VZ), Closed circles; subventricular zone (SVZ), pluses; primitive plexiform zone (PPZ), X's; IZ, closed squares; subplate (SP), open squares; cortical plate (CP), open circles; molecular layer (ML), asterisks. Blue and red curves show approximate contours of each cortical layer for control and the VPA-exposed embryos, respectively. The cerebral walls comprised the VZ and a narrow overlying PPZ from E10 to early E14 in both groups. The PPZ was replaced by the SVZ, IZ, and cortical strata (SP, CP, and ML) on E14 in both groups. The thickness of the VZ reached maximum on late E14 and then declined from E16 through E17 in both groups. *p < 0.05; **p < 0.01. Error bars, SEM.
Figure 5.
Figure 5.
Effects of in utero VPA exposure on the neuronogenetic period and the cell cycle lengths of the neural progenitor cells (NPCs) in the VZ. A, Dorsomedial cerebral walls in Q experiments on E10 and E11. Green, IdU/BrdU-positive nuclei; red, BrdU-positive nuclei; blue, Hoechst 33352 counter-stained nuclei; white, green/red double-positive nuclei. Yellow arrows indicate IdU-positive/BrdU-negative nuclei that correspond to the postmitotic cells that exited from the cell cycle (Q cells) on the corresponding day. Scale bar, 50 μm. B, Dorsomedial cerebral walls after a 2 h BrdU exposure on early E17 and E18, double stained for BrdU and Pax6. Red, BrdU-positive nuclei; light blue, Pax6-expressing progenitor cells; blue, Hoechst 33352 counter-stained nuclei. Scale bar, 50 μm. C, Progression of BrdU labeling indices in the VZ with cumulative BrdU labeling conducted on E10, E11, E12, E14, and E16. The dashed and continuous lines are regression lines of the plotted labeling indices of controls and the VPA-exposed embryos, respectively. D, The total cell cycle lengths on E10, E11, E12, E14, and E16. The bidirectional arrow between the two dot chain lines indicates the neuronogenetic interval in the VZ (i.e., from E11 to E17).
Figure 6.
Figure 6.
Effects of VPA exposure in utero on the proliferation/differentiation characteristics of the NPCs. A, Distribution of the daughter cells (P + Q cells), proliferative NPCs (P cells), and Q cells within the dorsomedial cerebral walls on E11, E12, E14, and E16. The cells were counted in each bin (100 μm in width and 10 μm in height) lined serially from the ventricular surface to the pia of the dorsomedial cerebral walls. B, The Q fractions on E11, E12, E14, and E16. C, The Q fractions against estimated elapsed cell cycles. Regression curves of the Q fractions were based on the neuronogenetic interval shown in Fig. 5A,B, in which the Q fractions were considered to be 0 and 1 on E11 and E17, respectively. Dashed curve, Regression curve of the Q fraction in controls: Q(t) = 0.0046 t2 + 0.0381 t, r2 = 0.9908; continuous curve, regression curve of the Q fraction in the VPA-exposed embryos: Q(t) = 0.0066 t2 + 0.0160 t, r2 = 0.9954; t, number of elapsed cell cycles from the onset of neuronogenesis. The two dot chain line shows Q = 0.5. D, The number of Pax6-positive, Pax6/Tbr2-double-positive, and Tbr2-positive nuclei within the cerebral wall on E16. E, Dorsomedial cerebral wall stained for Pax6 and Tbr2. Red, Pax6-positive nuclei (color tone adjusted to red for visibility); light blue, Tbr2-positive nuclei; blue, Hoechst 33352 counter-stained nuclei. Scale bar, 50 μm. F, Total number of Pax6-positive and Tbr2-positive nuclei. **p < 0.01. Error bars, SEM.
Figure 7.
Figure 7.
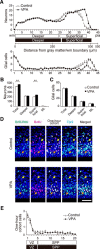
Effects of VPA exposure in utero on the number and distribution of neurons born on E16. A, The neocortical field 1 on P21 after Q experiment conducted on E16. Green, IdU/BrdU-positive nuclei; red, BrdU-positive nuclei; white, green/red double-positive nuclei; blue, calbindin-positive neurons that correspond to neurons distributed in layer II of the neocortices. IdU-positive/BrdU-negative nuclei labeled only with green correspond to the neurons born on E16 (E16-born Q cells). White dashed lines, Boundaries between neocortical layers I/II, II/III–IV, III–IV/V–VI, and gray matter/wm. Scale bar, 100 μm. B, The number of E16-born Q cells counted in each bin (250 μm in width; 25 μm in height) lined serially from the wm to the pia in the neocortical field 1 shown in A. White and black boxes under the abscissa indicate layers V–VI/II–IV in the neocortices of controls and the VPA-exposed mice, respectively. C, The superficial layers of neocortical field 1 triple stained for IdU, BrdU, and Cux1. Green, IdU/BrdU-positive nuclei; red, BrdU-positive nuclei; blue, Cux1-positive superficial neurons. The yellow arrows indicate the E16-born Cux1-positive superficial neurons. Note that the E16-born Q cells were mainly Cux1-positive. Scale bar, 100 μm. D, The number of E16-born Q cells in representative neocortical layers. Counting areas, 250 μm in width and the total neocortical thickness in height. **p < 0.01. Error bars, SEM.
Figure 8.
Figure 8.
Effects of VPA exposure in utero on the histological architecture of the neocortices on P4, and the distribution of the secondary proliferative population (SPP) on E16. A, The numbers of neurons (which included both non-GABAergic projection neurons and GABAergic interneurons) and glial cells counted in each bin (125 μm in width and 12.5 μm in height) lined serially from the wm to the pia in field 1 of the neocortices. White and black boxes under the abscissa indicate deeper/superficial layers (future layers V–VI/II–IV) defined by the bimodal distribution of the neurons in the neocortices of controls and the VPA-exposed mice, respectively. B, The number of neurons in representative neocortical layers. Counting areas, 125 μm in width and the total neocortical thickness in height. Analysis using a linear mixed-effects model showed a significant interaction between the increase in the number of neurons and the superficial layers shown in A in the VPA-exposed mice (p < 0.001). C, The number of glial cells. D, Dorsomedial cerebral walls after 1 h cohort analysis conducted on E16. Green, IdU/BrdU-positive nuclei; red, BrdU-positive nuclei; blue, Tbr2-expressing basal progenitor cells (BPs). The 1 h cohort nuclei in the G2 and M phases were separated into progenitors of the VZ (orange arrow) and SPP (yellow arrow). Note the majority, but not all, of the SPP progenitors were expressing Tbr2. Scale bar, 50 μm. E, The number of IdU-positive/BrdU-negative 1 h cohort nuclei counted in each bin (100 μm in width and 10 μm in height) lined serially from the ventricular surface to the IZ. White and black boxes under the abscissa indicate the distribution of 1 h cohort cells of VZ/SPP of controls and the VPA-exposed embryos, respectively. **p < 0.01. Error bars, SEM.
Figure 9.
Figure 9.
Effects of VPA exposure in utero on the amount of cell cycle regulatory proteins and total acetylated histone H3 protein in the embryonic cerebral walls. A, Immunoblot analysis of cyclinD1, cyclin-dependent kinase (cdk) 2, cdk4, and p27Kip1 in cerebral walls on E12. B, The amount of each protein in controls was considered to be 100%. C, The amount of total acetylated histone H3 protein in cerebral walls on E12. *p < 0.05; **p < 0.01. Error bars, SEM.
Figure 10.
Figure 10.
Assumption models of the numbers of NPCs and the neuronal output during the neuronogenetic interval in the VZ. A, The number of NPCs from cell cycle number 1 to terminal output (TO) were calculated from the regression curves of the normal and altered ascending patterns of Q fractions shown in Fig. 6C (from controls and the VPA-exposed embryos, respectively). The number of NPCs at the onset of neuronogenesis (initial NPC number) in the normal model was assumed to be one. Black dashed line, Normal model. Red (altered Q fraction model 1), orange (model 2), blue (model 3), and green lines (model 4) show altered Q fraction models when the initial NPC number was reduced by 0, 20, 30, and 40%, respectively, compared with the normal model. The maximum numbers of NPCs in the altered Q fraction models were calculated as 55, 24, and 8% increases, and a 7% decrease in models 1, 2, 3, and 4, respectively, compared with the normal model. The models show that Q fraction alteration can increase the maximum number of NPCs in the VZ, depending on the extent of the reduction in initial NPCs. B, The cumulative neuronal output from the NPCs in the VZ as calculated in A. The total neuronal outputs in the altered Q fraction models were calculated as 44% increase, 15% increase, no change, and 14% decrease, in models 1, 2, 3, and 4, respectively, compared with the normal model. The models show that Q fraction alteration can increase the cumulative neuronal output from the VZ depending on the extent of the reduction in initial NPCs.

References

    1. Boulder Committee. Embryonic vertebrate central nervous system: revised terminology. The Boulder Committee. Anat Rec. 1970;166:257–261. doi: 10.1002/ar.1091660214. - DOI - PubMed
    1. Bromley RL, Mawer GE, Briggs M, Cheyne C, Clayton-Smith J, García-Fiñana M, Kneen R, Lucas SB, Shallcross R, Baker GA. The prevalence of neurodevelopmental disorders in children prenatally exposed to antiepileptic drugs. J Neurol Neurosurg Psychiatry. 2013;84:637–643. doi: 10.1136/jnnp-2012-304270. - DOI - PMC - PubMed
    1. Bystron I, Blakemore C, Rakic P. Development of the human cerebral cortex: Boulder Committee revisited. Nat Rev Neurosci. 2008;9:110–122. doi: 10.1038/nrn2252. - DOI - PubMed
    1. Caviness VS., Jr Architectonic map of neocortex of the normal mouse. J Comp Neurol. 1975;164:247–263. doi: 10.1002/cne.901640207. - DOI - PubMed
    1. Christensen J, Grønborg TK, Sørensen MJ, Schendel D, Parner ET, Pedersen LH, Vestergaard M. Prenatal valproate exposure and risk of autism spectrum disorders and childhood autism. JAMA. 2013;309:1696–1703. doi: 10.1001/jama.2013.2270. - DOI - PMC - PubMed

Publication types

MeSH terms

LinkOut - more resources