. 2017 Aug;37(8):2780-2794.
doi: 10.1177/0271678X16675368. Epub 2016 Jan 1.

WNK-Cab39-NKCC1 signaling increases the susceptibility to ischemic brain damage in hypertensive rats

Affiliations

WNK-Cab39-NKCC1 signaling increases the susceptibility to ischemic brain damage in hypertensive rats

Mohammad Iqbal H Bhuiyan et al. J Cereb Blood Flow Metab. 2017 Aug.

Abstract

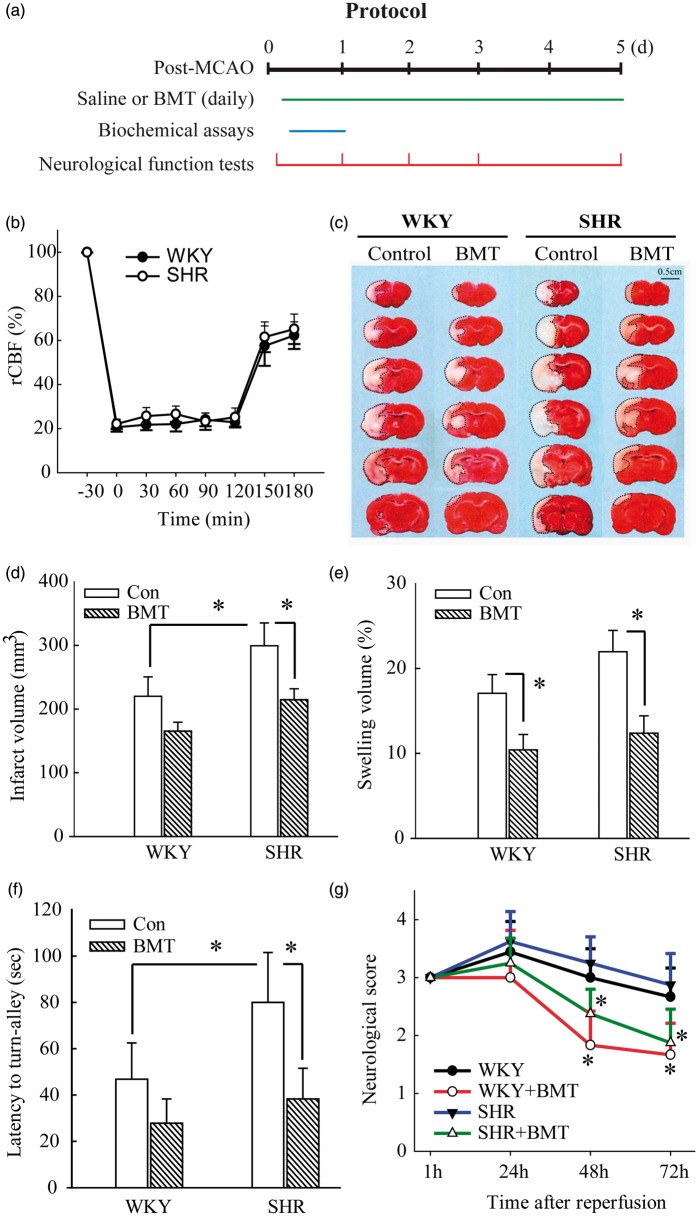
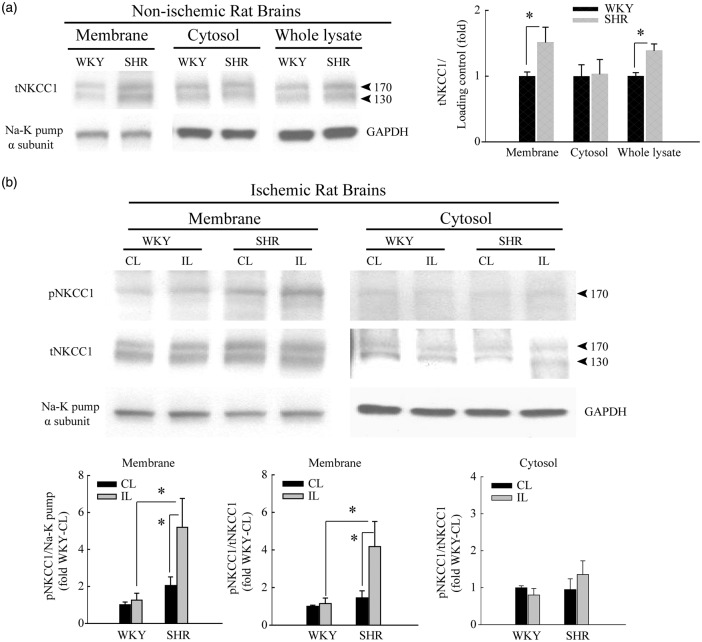
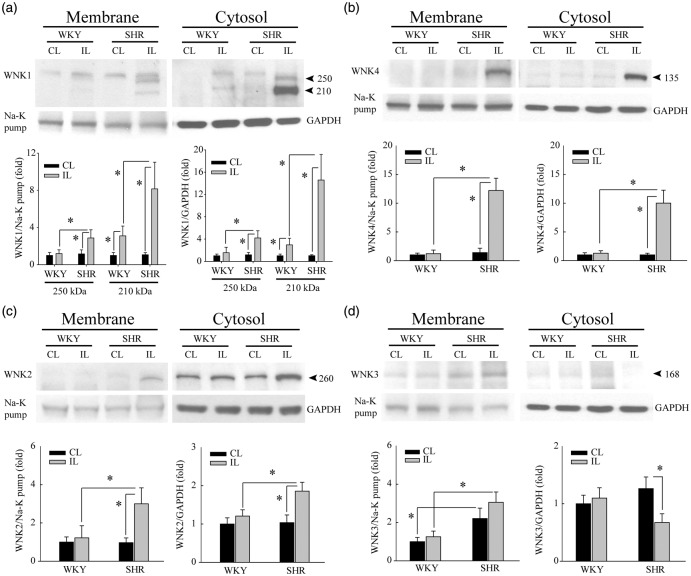
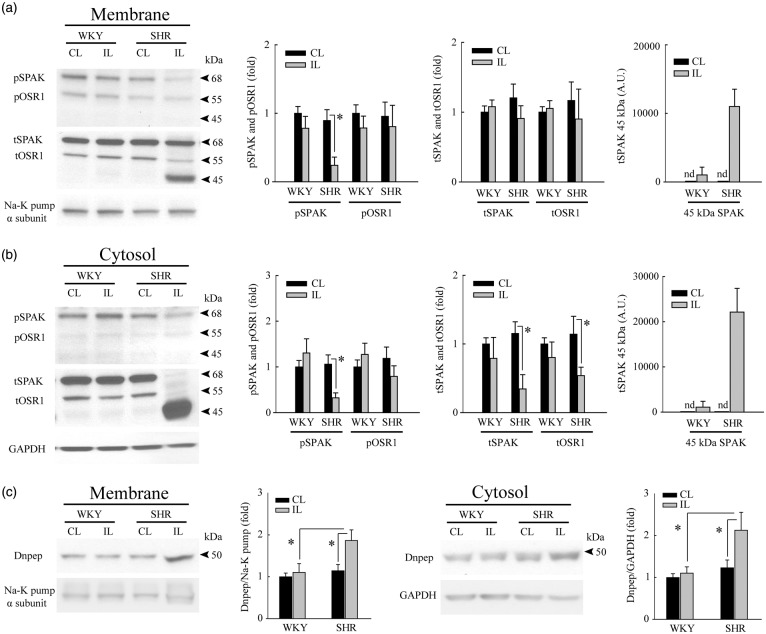
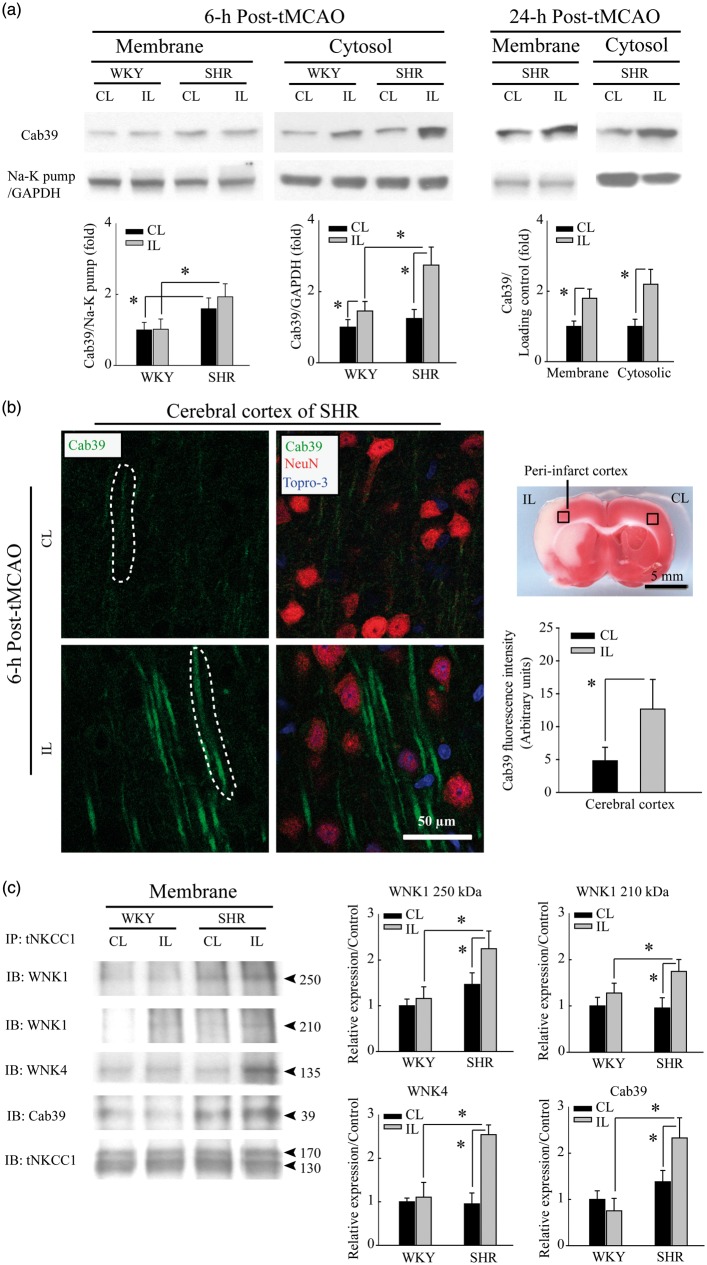
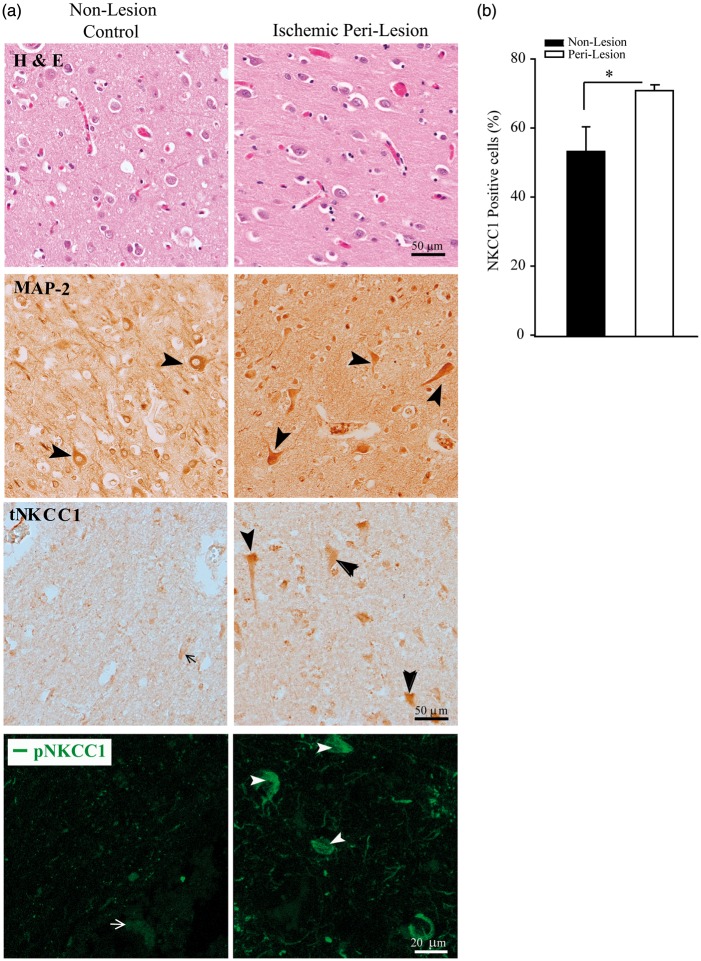
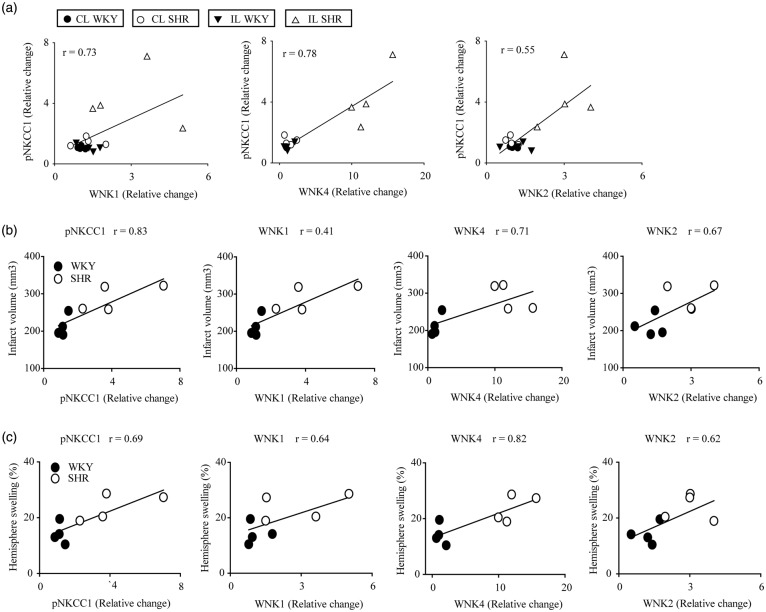
With-no-lysine kinase (WNK) and Na+-K+-2Cl- cotransporter 1 (NKCC1) are involved in the pathogenesis of hypertension. In this study, we investigated the WNK-NKCC1 signaling pathway in spontaneously hypertensive rats (SHR) and their associated susceptibility to stroke injury. Basal NKCC1 protein levels were higher in SHR than in normotensive Wistar Kyoto (WKY) rat brains. After inducing ischemic stroke, adult male WKY and SHR received either saline or NKCC1 inhibitor bumetanide (10 mg/kg/day, i.p.) starting at 3-h post-reperfusion. NKCC1 inhibition blunted the extent of ischemic infarction in SHR and improved their neurobehavioral functions. Interestingly, ischemia led to increased NKCC1 phosphorylation in SHR but not in WKY rats. Pronounced elevation of WNK1, WNK2 and WNK4 protein and downregulation of WNK3 were detected in ischemic SHR, but not in ischemic WKY rats. Upregulation of WNK-NKCC1 complex in ischemic SHR brain was associated with increased Ca2+-binding protein 39 (Cab39), without increases in Ste20-related proline alanine-rich kinase or oxidative stress-responsive kinase-1. Moreover, subacute middle cerebral artery stroke human brain autopsy exhibited increased expression of NKCC1 protein. We conclude that augmented WNK-Cab39-NKCC1 signaling in SHR is associated with an increased susceptibility to ischemic brain damage and may serve as a novel target for anti-hypertensive and anti-ischemic stroke therapy.

Keywords: Bumetanide; Cab39; NKCC1; SHR; WNK kinase; hypertension; ischemic stroke.


Figures

Figure 1.
Figure 1.
NKCC1 inhibitor BMT attenuates ischemic stroke-mediated exacerbation of infarction and improves sensorimotor deficits in SHR. (a) Experimental protocol and data collection. BMT: bumetanide; tMCAO: transient middle cerebral artery occlusion. (b) rCBF measurements during and after 2-h tMCAO were indistinguishable in SHR and WKY rats. (c) Representative TTC staining images in WKY and SHRs at 24-h reperfusion, with quantitative analysis of infarct volume (d) and percent hemisphere swelling (e). Saline or bumetanide (10 mg/kg body weight/day in saline) was administered via intra-peritoneal injection, with an initial BMT dose (5 mg/kg) at 3 h and the second dose (5 mg/kg) at 8-h reperfusion and followed by two daily injections (bid). Data are mean ± SD, n = 4, *p < 0.05. (f) Turning-in-alley test latency. Data are mean ± SD, n = 8, *p < 0.05. (g) Neurological deficit scores in WKY and SHRs. Data are mean ± SD, n = 8, *p < 0.05 vs. respective control.
Figure 2.
Figure 2.
Selective elevation of NKCC1 protein expression in the cerebral cortex of SHR brain after ischemic stroke. (a) Representative immunoblots showing higher baseline expression of total NKCC1 (tNKCC1) in whole homogenate and crude membrane fractions of brain cortices from normal control SHR than in those from WKY rats. α-subunit of Na+-K+ pump and GAPDH served as loading controls for membrane and cytosol fractions, respectively. Data are mean ± SD, n = 4, *p < 0.05 WKY vs. SHR. (b) Ischemic stroke selectively stimulates phosphorylated NKCC1 (pNKCC1) expression at 6-h post-tMCAO in SHR but not WKY rats. Cytosol and crude membrane protein fractions were prepared from contralateral (CL) and ipsilateral (IL) cortices of WKY and SHR. Data are mean ± SD, n = 4, *p < 0.05 WKY vs. SHR.
Figure 3.
Figure 3.
SHR brains exhibit pronounced upregulation of WNK1, WNK2, and WNK4 proteins after ischemic stroke. (a) Upregulation of full length WNK1 protein (250 kDa) was detected at 6-h reperfusion post-tMCAO only in IL cortices of SHR but not WKY rats. Cytosol and crude membrane protein fractions were prepared from contralateral (CL) and ipsilateral (IL) cortices of WKY and SHR. Data are mean ± SD, n = 4, *p < 0.05. (b) Upregulation of WNK4 protein in the same samples as in (a). Data are mean ± SD, n = 4, *p < 0.05. (c) Upregulation of WNK2 protein in the same samples as in (a). Data are mean ± SD, n = 4, *p < 0.05. (d) Ischemic stroke did not cause significant changes of WNK3 protein expression in either WKY or SHR brains but reduced WNK3 expression in the IL cytosol fraction of SHR brains. Data are mean ± SD, n = 4, *p < 0.05.
Figure 4.
Figure 4.
Ischemic stroke selectively triggers inhibition of SPAK/OSR1 phosphorylation and degradation of SPAK in SHR brains. (a) Plasma membrane fraction of the IL cerebral cortex of SHR brains exhibits selective reduction of pSPAK (68 kDa) expression at 6-h reperfusion post-tMCAO. A protein band of ∼45 kDa was detected in the membrane fraction of SHR brains by anti-tSPAK antibody but not by the anti-pSPAK/pOSR1 antibody (arrowhead). The band was interpreted as a putative, proteolytic cleavage product of pSPAK. Data are mean ± SD, n = 4, *p < 0.05. (b) Cytosol fractions from IL cerebral cortex of SHR brains show reduced expression of pSPAK, tSPAK, tOSR1, and increased accumulation of the putative cleaved SPAK band (∼45 kDa) undetected by the anti-pSPAK/pOSR1 antibody (arrowhead). Data are mean ± SD, n = 4, *p < 0.05. (c) Upregulation of Dnpep protease (aspartyl aminopeptidase, ∼50 kDa) was detected only in IL cortices of SHR but not in WKY rats at 6-h reperfusion post-tMCAO. Cytosol and crude plasma membrane protein fractions were prepared from the contralateral (CL) and ipsilateral (IL) cortices of WKY and SHR. Data are mean ± SD, n = 4, *p < 0.05.
Figure 5.
Figure 5.
Ischemic stroke selectively triggers upregulation of Cab39 protein expression in SHR brains. (a) SHR brain membrane fractions exhibit greater Cab39 protein abundance than do WKY brain membrane fractions. Ischemic stroke increases Cab39 levels in SHR cytosol fractions to a greater degree than in WKY brain cytosol fractions at 6-h reperfusion post-tMCAO. At 24-h reperfusion post-tMCAO, Cab39 expression was further increased in both membrane and cytosolic fractions in SHR brain. Data are mean ± SD, n = 4, *p < 0.05. (b) Immunofluorescence analysis showing Cab39 upregulation in peri-infarct cortex of SHR brain at 6-h post-tMCAO. Data are mean ± SD, n = 3, *p < 0.05. (c) Increased levels of WNK1, WNK4, and Cab39 proteins were detected in anti-tNKCC1 immunoprecipitates from ischemic IL cerebral cortices of SHR at 6-h reperfusion post-tMCAO compared with CL cortex of WKY. Data are mean ± SD, n = 4, *p < 0.05.
Figure 6.
Figure 6.
Elevated tNKCC1 and pNKCC1 protein expression in subacute human middle cerebral artery ischemic stroke brain autopsy. (a) Non-lesion and peri-lesion regions in human ischemic stroke brain autopsy samples were identified with H & E staining. tNKCC1 expression in neuronal cells was shown in representative immunohistochemical images. Arrow: low NKCC1 expression. Arrowhead: high NKCC1 expression. Scale bar: 50 µm. Representative immunofluorescence images of pNKCC1 expression in brain cells (bottom panel). Arrow: low pNKCC1 expression. Arrowhead: high pNKCC1 expression. Scale bar: 20 µm. (b) Percentage of tNKCC1-positive cells among total To-pro3-positive cells. Numerical data are mean ± SD, n = 3 (one male, two female), *p < 0.05.
Figure 7.
Figure 7.
Correlation of expression and activation of NKCC1/WNK pathway signaling proteins, infarct volume and hemisphere swelling in ischemic SHR and WKY brains. (a) Correlation between phosphorylation of NKCC1 and expression of WNK kinases at 6 h after MCAO in WKY and SHRs (p < 0.05, Pearson’s correlation). (b) Correlation between phosphorylation of NKCC1 and expression of WNK kinases versus infarct volume (p < 0.05, Pearson’s correlation). (c) Correlation between NKCC1 phosphorylation, and expression of WNK1/2/4 kinases versus hemispheric swelling (p < 0.05, Pearson correlation). These correlation analyses used the same cohort of data from Figures 1–3.

References

    1. Richardson C, Alessi DR. The regulation of salt transport and blood pressure by the wnk-spak/osr1 signalling pathway. J Cell Sci 2008; 121: 3293–3304. - PubMed
    1. Vitari AC, Thastrup J, Rafiqi FH, et al. Functional interactions of the spak/osr1 kinases with their upstream activator wnk1 and downstream substrate nkcc1. Biochem J 2006; 397: 223–231. - PMC - PubMed
    1. Vitari AC, Deak M, Morrice NA, et al. The wnk1 and wnk4 protein kinases that are mutated in gordon's hypertension syndrome phosphorylate and activate spak and osr1 protein kinases. Biochem J 2005; 391: 17–24. - PMC - PubMed
    1. Wilson FH, Disse-Nicodeme S, Choate KA, et al. Human hypertension caused by mutations in wnk kinases. Science 2001; 293: 1107–1112. - PubMed
    1. Wang Y, O'Connell JR, McArdle PF, et al. From the cover: Whole-genome association study identifies stk39 as a hypertension susceptibility gene. Proc Natl Acad Sci USA 2009; 106: 226–231. - PMC - PubMed

MeSH terms

Substances