. 2016 Oct;13(123):20160540.
doi: 10.1098/rsif.2016.0540.

Waiting time to infectious disease emergence

Affiliations

Waiting time to infectious disease emergence

Christopher J Dibble et al. J R Soc Interface. 2016 Oct.

Abstract

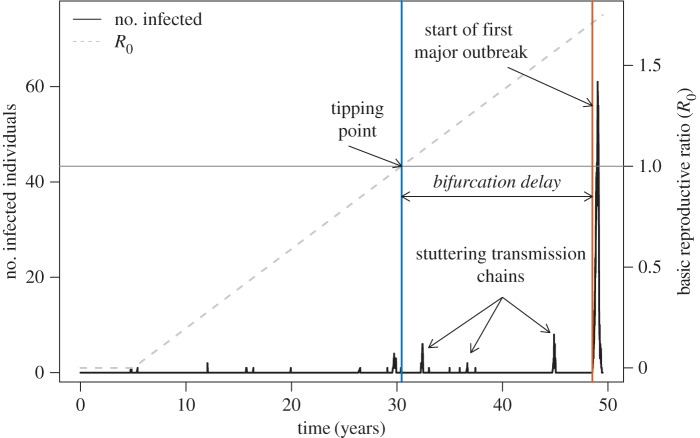
Emerging diseases must make a transition from stuttering chains of transmission to sustained chains of transmission, but this critical transition need not coincide with the system becoming supercritical. That is, the introduction of infection to a supercritical system results in a significant fraction of the population becoming infected only with a certain probability. Understanding the waiting time to the first major outbreak of an emerging disease is then more complicated than determining when the system becomes supercritical. We treat emergence as a dynamic bifurcation, and use the concept of bifurcation delay to understand the time to emergence after a system becomes supercritical. Specifically, we consider an SIR model with a time-varying transmission term and random infections originating from outside the population. We derive an analytic density function for the delay times and find it to be, in general, in agreement with stochastic simulations. We find the key parameters to be the rate of introduction of infection and the rate of change of the basic reproductive ratio. These findings aid our understanding of real emergence events, and can be incorporated into early-warning systems aimed at forecasting disease risk.

Keywords: bifurcation delay; critical slowing down; early-warning systems; emerging infectious disease.


Figures

Figure 1.
Figure 1.
Bifurcation delay is the time between the tipping point at R0 = 1 (intersection of grey horizontal line and blue vertical line) and the beginning of an actual disease epidemic (orange vertical line, definition in text). This simulated time series is a stochastic realization of the hinge SIR model, where the transmission rate (β) begins to increase at a set time (here, t = 5 years) at rate α. This example contains multiple ‘sparks’ after the transition to supercriticality that do not lead to epidemics, demonstrating that bifurcation delay is not simply the waiting time for a spark to occur after R0 > 1. Other parameters for this simulation: rate of increase in transmission, α = 0.001 yr−1, initial population size (N0) = 1000, recovery rate, γ = 365/14 yr−1 (corresponding to a 14 day infectious period), spontaneous infection rate, ξ = 0.00067 yr−1, birth and death rate, μ = 1/60 yr−1. (Online version in colour.)
Figure 2.
Figure 2.
(a) Mean bifurcation delay (in years) decreases with increasing rate of change in the transmission rate (α) and increasing mean infectious period (i.e. inverse recovery rate, γ), as indicated by the colour of the heatmap and the contour lines (darker = more delay). Letters b–d indicate three mean different infectious periods detailed in subsequent panels. Three values of the rate of change of the transmission rate, α, are highlighted and explored further. (bd) The distribution of bifurcation delay from 1000 stochastic simulations (solid lines) and expected distributions using the analytic results (dashed lines) at three rates of change in the transmission rate (α = 0.0005 yr−1, red; α = 0.002 yr−1, yellow and α = 0.006 yr−1, blue). Each panel represents a different mean infectious period (b = 5 days, c = 9 days, d = 21 days). Vertical lines show the mean delay for the each value of α, for both the observed (solid line) and expected (dashed line) delay distributions. Other life-history parameters for these examples: N0 = 1000 and ξ = 0.0001 yr−1. (Online version in colour.)
Figure 3.
Figure 3.
The negative relationship between bifurcation delay and the sweep rate of a system depends on the rate of sparking. The solid black line shows the overall relationship from a linear model of log(observed delay) by log(sweep rate). Solid colour lines represent the observed median bifurcation delay from model simulations, and dashed colour lines represent the expected median bifurcation delay based on analytic results. Colours show the effect of different levels of the sparking rate, a, on the relationship between delay and the sweep rate. Slopes and intercepts can be found in table 4. (Online version in colour.)
Figure 4.
Figure 4.
Bifurcation delay can lead to epidemics with greater peak prevalence, although this effect depends on the life-history parameters of the system. Panels show peak epidemic prevalence by stochastic realizations of bifurcation delay (x-axis on log-scale). Symbols and line types represent three different infectious periods, approximating three important childhood diseases (5 days for measles, 9 days for chickenpox, 22 days for pertussis). Lines are loess smooths added for visual clarity. Colour represents the ratio of b to a, which describes how quickly R0 changes relative to how frequently imported infections occur in a system. Symbols are positioned at the median of the x- and y-axes for each combination of life-history parameters. Panels show four different initial population sizes (N0 = 500, 1000, 5000 and 10 000). The relationship between delay and peak infection prevalence depends on how quickly R0 increases, which is governed by the sweep rate, mean infectious period and population size. (Online version in colour.)

References

    1. Jones KE, Patel NG, Levy MA, Storeygard A, Balk D, Gittleman JL, Daszak P. 2008. Global trends in emerging infectious diseases. Nature 451, 990–993. (10.1038/nature06536) - DOI - PMC - PubMed
    1. Wolfe ND, Dunavan CP, Diamond J. 2007. Origins of major human infectious diseases. Nature 447, 279–283. (10.1038/nature05775) - DOI - PMC - PubMed
    1. Lloyd-Smith JO, George D, Pepin KM, Pitzer VE, Pulliam JRC, Dobson AP, Hudson PJ, Grenfell BT. 2009. Epidemic dynamics at the human-animal interface. Science 326, 1362–1367. (10.1126/science.1177345) - DOI - PMC - PubMed
    1. Anderson RM, Fraser C, Ghani AC, Donnelly CA, Riley S, Ferguson NM, Leung GM, Lam TH, Hedley AJ. 2004. Epidemiology, transmission dynamics and control of SARS: the 2002–2003 epidemic. Phil. Trans. R. Soc. Lond. B 359, 1091–1105. (10.1098/rstb.2004.1490) - DOI - PMC - PubMed
    1. Khalafalla AI, Lu X, Al-Mubarak AIA, Dalab AHS, Al-Busadah KAS, Erdman DD. 2015. MERS-CoV in upper respiratory tract and lungs of dromedary camels, Saudi Arabia, 2013–2014. Emerg. Infect. Dis. 21, 1153–1158. (10.3201/eid2107.150070) - DOI - PMC - PubMed

Publication types

LinkOut - more resources