. 2016 Dec 8;540(7632):280-283.
doi: 10.1038/nature20557. Epub 2016 Oct 31.

Microcins mediate competition among Enterobacteriaceae in the inflamed gut

Affiliations

Microcins mediate competition among Enterobacteriaceae in the inflamed gut

Martina Sassone-Corsi et al. Nature. .

Abstract

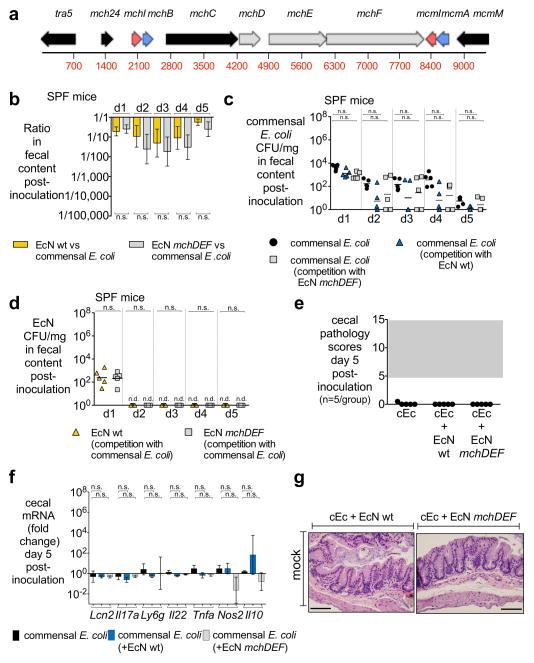
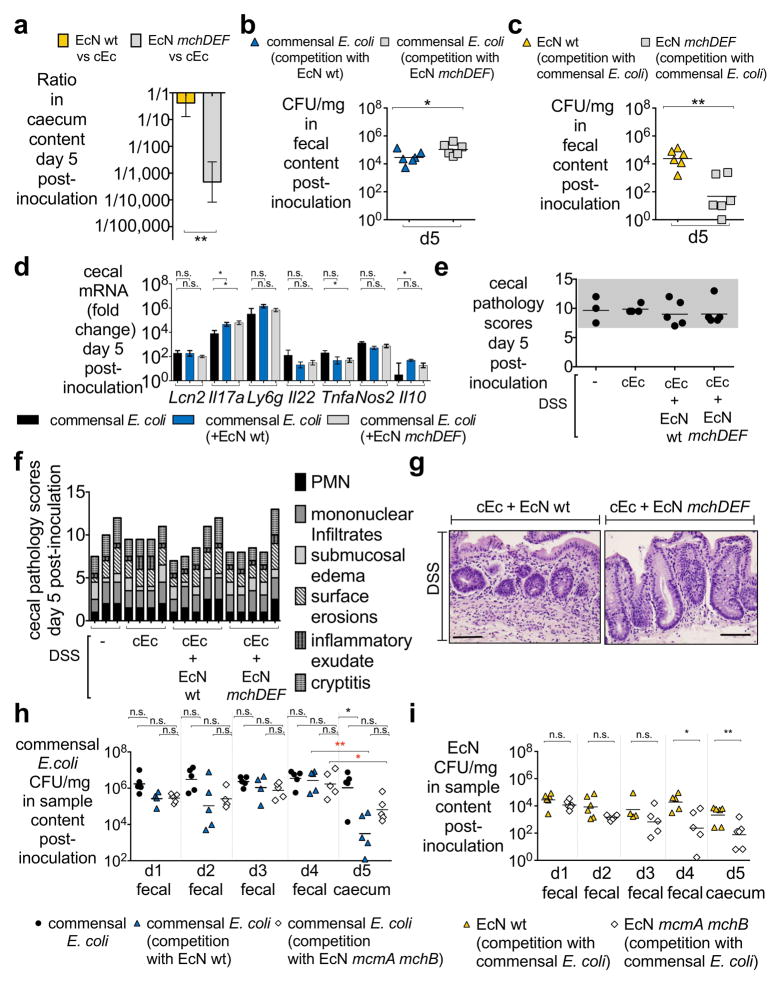
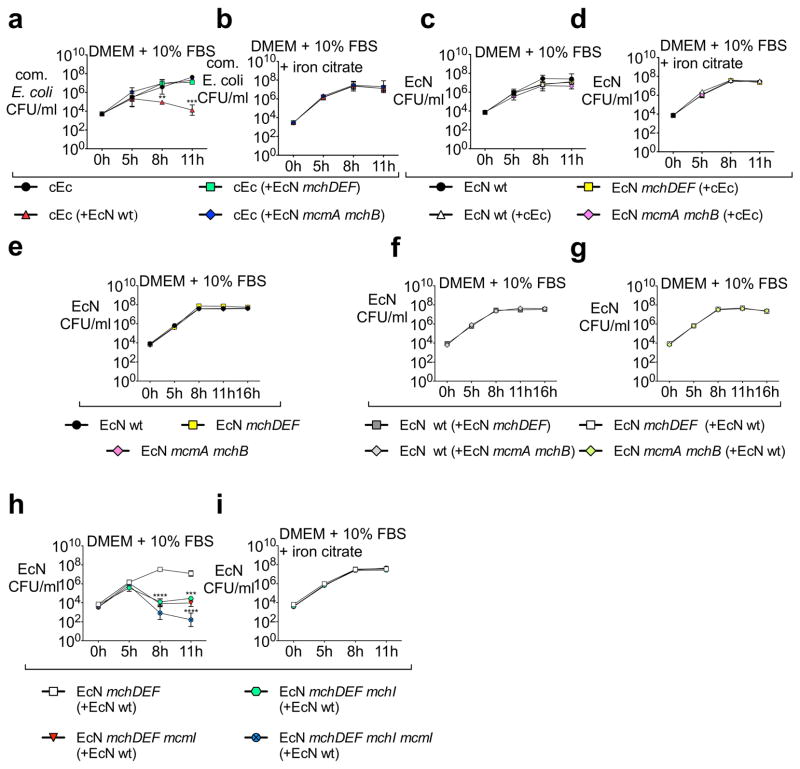
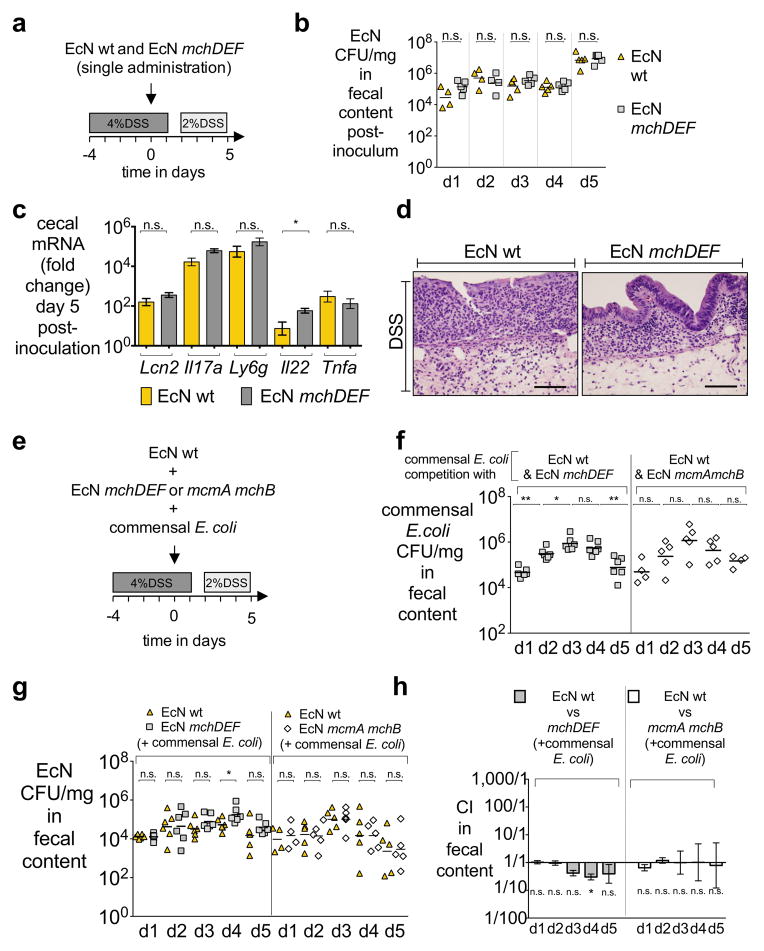
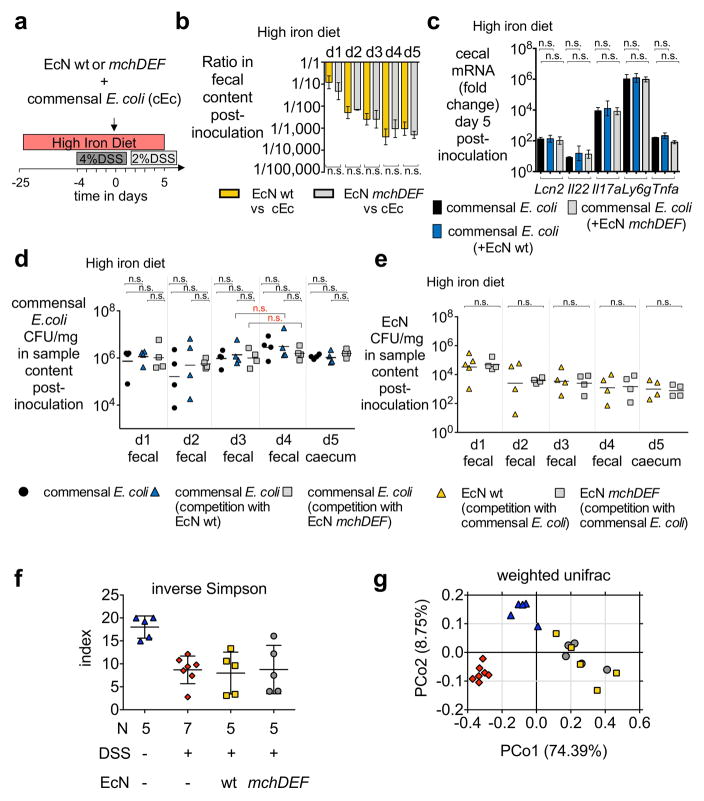
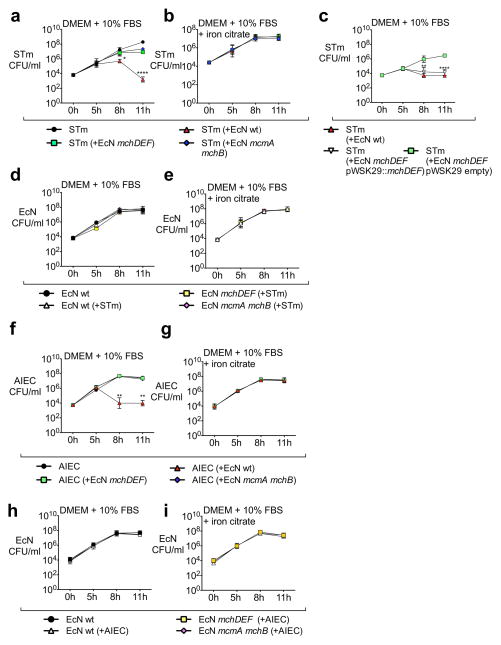
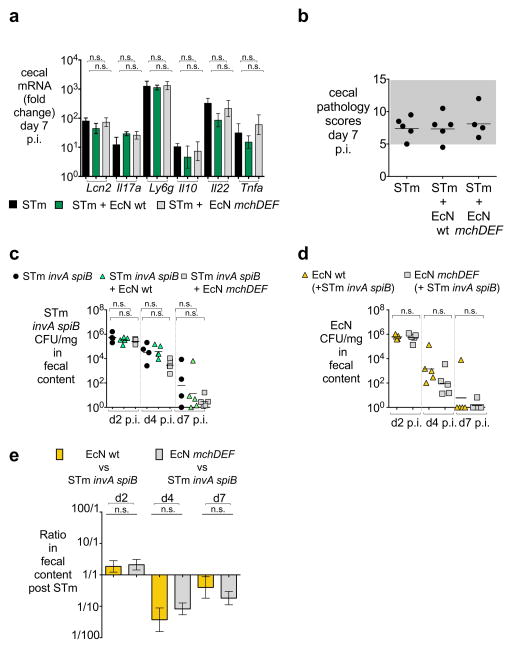
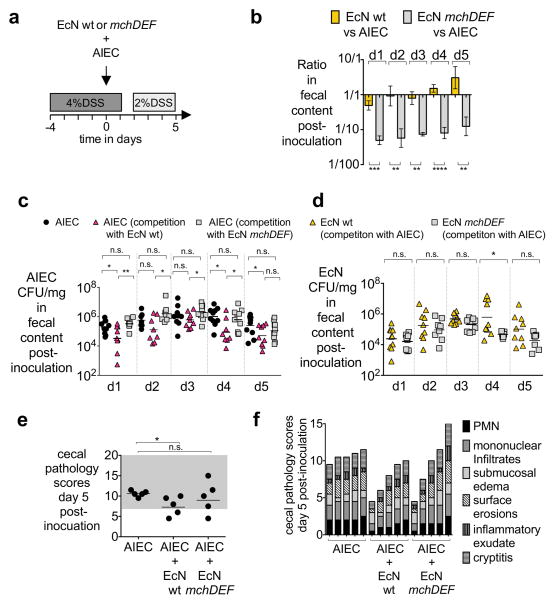
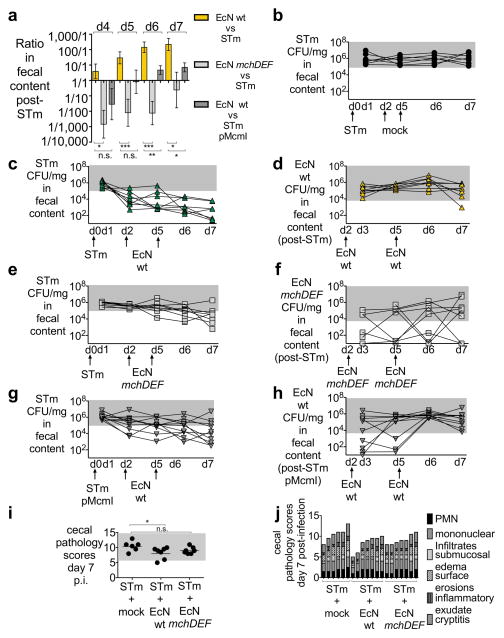
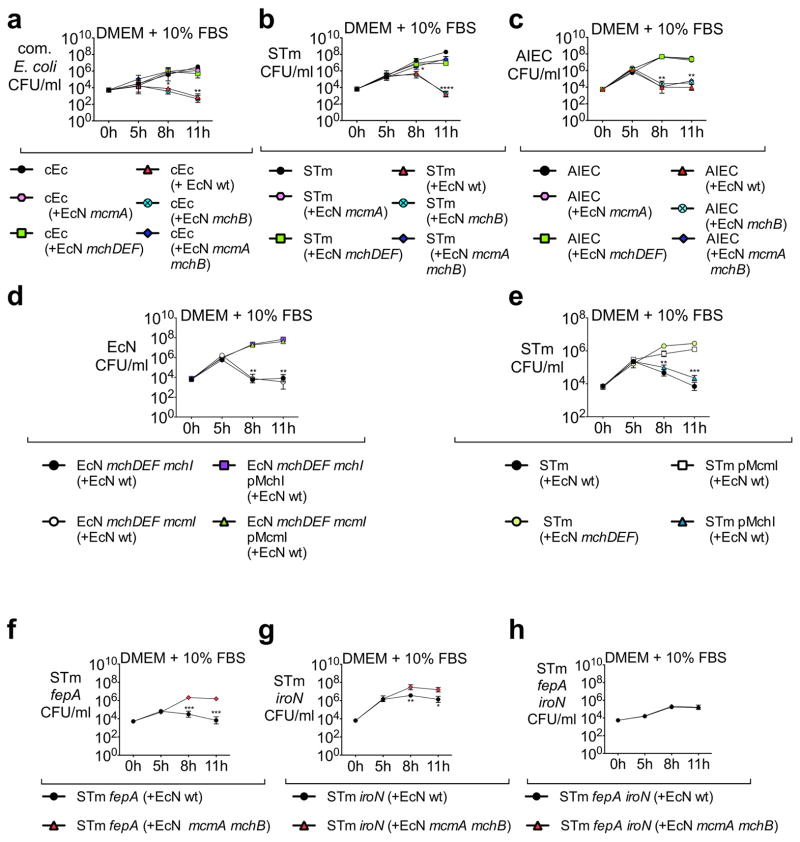
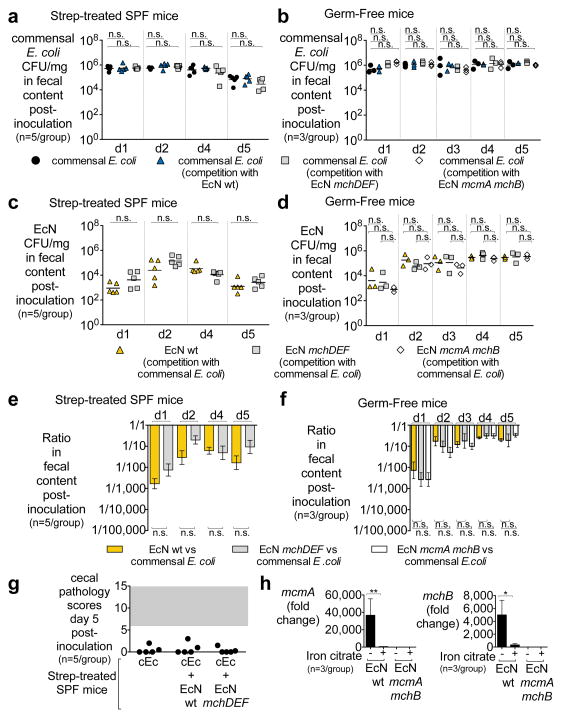
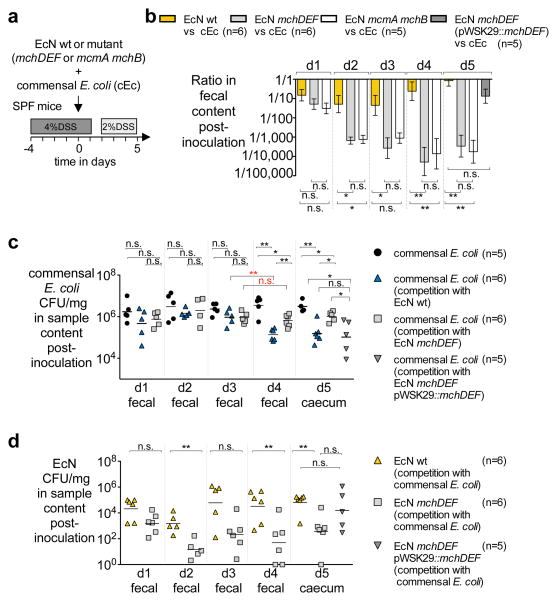
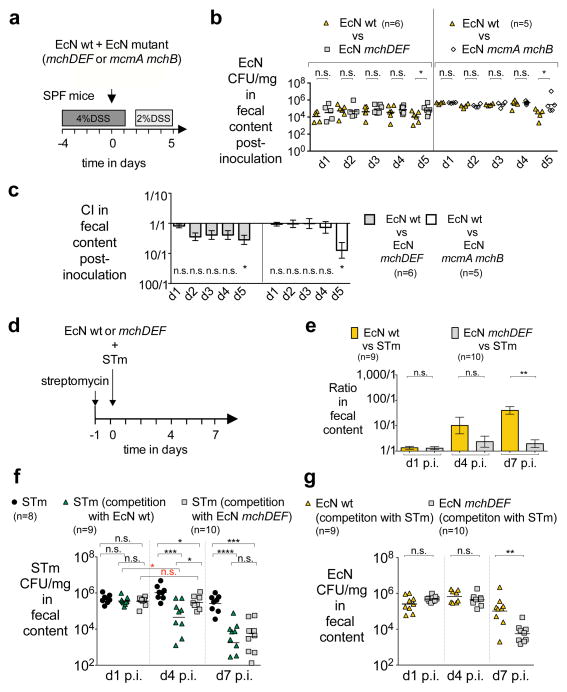
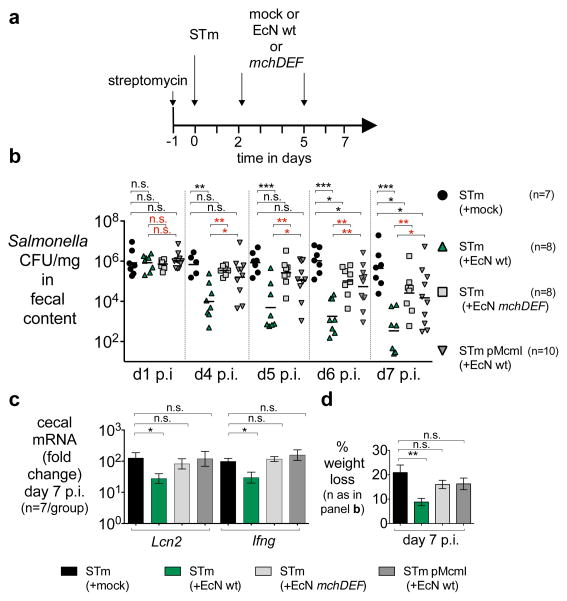
The Enterobacteriaceae are a family of Gram-negative bacteria that include commensal organisms as well as primary and opportunistic pathogens that are among the leading causes of morbidity and mortality worldwide. Although Enterobacteriaceae often comprise less than 1% of a healthy intestine's microbiota, some of these organisms can bloom in the inflamed gut; expansion of enterobacteria is a hallmark of microbial imbalance known as dysbiosis. Microcins are small secreted proteins that possess antimicrobial activity in vitro, but whose role in vivo has been unclear. Here we demonstrate that microcins enable the probiotic bacterium Escherichia coli Nissle 1917 (EcN) to limit the expansion of competing Enterobacteriaceae (including pathogens and pathobionts) during intestinal inflammation. Microcin-producing EcN limits the growth of competitors in the inflamed intestine, including commensal E. coli, adherent-invasive E. coli and the related pathogen Salmonella enterica. Moreover, only therapeutic administration of the wild-type, microcin-producing EcN to mice previously infected with S. enterica substantially reduced intestinal colonization by the pathogen. Our work provides the first evidence that microcins mediate inter- and intraspecies competition among the Enterobacteriaceae in the inflamed gut. Moreover, we show that microcins can act as narrow-spectrum therapeutics to inhibit enteric pathogens and reduce enterobacterial blooms.


Conflict of interest statement

The authors declare that they have no competing financial interests.

Figures

Extended Data Figure 1
Extended Data Figure 1. E. coli Nissle wild-type and microcin mutant (mchDEF) gut colonization in competition with commensal E. coli in the absence of intestinal inflammation
a, Illustration of the microcin gene cluster in EcN. b–g, Intragastric inoculation of SPF mice with cEc alone or in competition with wild-type EcN or EcN mchDEF at a 1:1 ratio. b, Ratio (EcN over cEc) in fecal content at days 1–5 post-inoculation (n = 5/group). c,d, CFU/mg of (c) cEc or (d) wild-type EcN or EcN mchDEF in fecal content at days 1–5 post-inoculation, when cEc was administered alone or in competition as indicated. e,f, Cecal (e) histopathology scores or (f) gene expression (data are expressed as fold change over mock-treated mice) at day 5 post-inoculation for panels b–d (n = 5/group). g, H&E-stained sections from representative animals at day 5 post-inoculation; scale bar = 100 μm. b,f, Bars = geometric mean ± s.e.m. c–e, Individual symbol = mouse. c,d, Bars = geometric mean. e, Bars = mean. n.s., not significant.
Extended Data Figure 2
Extended Data Figure 2. Colonization and histopathology of E. coli Nissle wild-type and microcin mutants (mchDEF and mcmA mchB) in competition with commensal E. coli, in mice with DSS-mediated colitis
a–i, Experimental design as in Fig. 2a with SPF mice. a, Ratio (EcN over cEc) in cecal content at day 5 post-intragastric inoculation (n = 6/group). b,c, CFU/mg of (b) cEc or (c) wild-type EcN or EcN mchDEF in fecal content at day 5 post-inoculation when in competition as indicated (n = 6/group). d,e, Cecal (d) gene expression (n = 5/group) data are presented as fold change over mock-treated mice) or (e) histopathology scores at day 5 post-inoculation from mice shown in panels b,c and Fig. 2b–d (DSS only, n = 3; all others, n = 5); scale bar = 100 μm. f, Detailed histopathology scoring of panel e mice. g, H&E-stained sections from representative animals at day 5 post-inoculation. h,i, CFU/mg of (h) cEc or (i) wild-type EcN or EcN mcmA mchB in sample content at days 1–5 post-intragastric inoculation when cEc was administered alone or in competition as indicated (n = 5/group). a,d, Bars = geometric mean ± s.e.m. b,c,e,h,i, Individual symbol = mouse. b,c,h,i, Bars = geometric mean. e, Bars = mean. *P<0.05, **P<0.01; n.s., not significant.
Extended Data Figure 3
Extended Data Figure 3. In vitro growth curves of E. coli Nissle and microcin mutants when grown alone or in competition with EcN mutants or commensal E. coli
a–i, Strains were grown overnight in Nutrient Broth + 0.2 mM 2,2’-dipyridyl. Growth assays were performed in iron-limiting conditions (DMEM/F12 + 10% FBS) or in media supplemented with 1 μM iron citrate. Timepoints at 0, 5, 8 and 11 hours post-inoculation were collected. a,b, cEc CFU/mL when grown alone or in competition with wild-type or mutant EcN in (a) iron-limiting conditions or in (b) media supplemented with 1 μM iron citrate. c,d, CFU/mL of wild-type or mutant EcN when grown alone or in competition with cEc in (c) iron-limiting conditions or in (d) media supplemented with 1 μM iron citrate. e–g, Under iron-limiting conditions, CFU/mL of (e) wild-type or mutant EcN when grown alone, or of (f) wild-type EcN or (g) EcN mchDEF or EcN mcmA mchB when grown competitively as indicated. h,i, CFU/mL of the indicated EcN mutants (immunity gene(s) and/or mchDEF) grown in competition with wild-type EcN in (h) iron-limiting conditions or in (i) media supplemented with 1 μM iron citrate. a–i, Symbols = geometric mean (three independent experiments) ± s.e.m. **P<0.01, ***P<0.001, ****P<0.0001.
Extended Data Figure 4
Extended Data Figure 4. Gut colonization of E. coli Nissle wild-type and microcin mutants in the DSS-colitis model
a, Experimental design for b-d with SPF mice. b, CFU/mg of wild-type EcN or EcN mchDEF in fecal content at days 1–5 post-intragastric inoculation (n = 5/group). c,d, Cecal (c) gene expression (n = 5/group; data are expressed as fold change over mock-treated mice) or (d) H&E-stained sections (representative) from panel b mice at day 5 post-inoculation; scale bar = 100 μm. e, Triple co-administration design for f–h with SPF mice. f,g, CFU/mg of (f) cEc or (g) indicated EcN strain in fecal content at days 1–5 post-intragastric inoculation with cEc, wild-type EcN and the indicated EcN mutant (n = 5/group). h, Competitive index (CI; EcN wild-type over mutant) for EcN data presented in panel g (n = 5/group). b,f,g, Individual symbol = mouse; bars = geometric mean. c,h, bars = geometric mean ± s.e.m. *P<0.05, **P<0.01; n.s., not significant.
Extended Data Figure 5
Extended Data Figure 5. Impact of microcins on the microbiota and impact of a high iron diet on microcin-mediated competition
a, High-iron diet design for b–e with SPF mice (n = 5/group) b, Ratio (EcN over cEc) in fecal content at days 1–5 post-intragastric inoculation. c, Cecal gene expression at day 5 post-inoculation (n = 3–4/group). d,e, CFU/mg of (d) cEc or (e) wild-type EcN or EcN mchDEF in indicated samples at days 1–5 post-inoculation when cEc was administered alone or in competition as indicated (n = 5/group). f,g, See Fig. 2a for experimental design with SPF mice. 16S ribosomal rRNA gene sequence analysis (V4 region) of fecal DNA obtained from mice pre-DSS administration (Day -4), post-DSS (Day 0), and day 5 post-intragastric inoculation of cEc with either wild-type EcN or EcN mchDEF at a 1:1 ratio. f, Eubacterial alpha diversity (inverse Simpson index); Shannon index yielded similar results. g, Principal coordinates (PCo) analysis plot (PCo1 vs. PCo2) of eubacterial beta diversity (weighted UniFrac); symbols as in panel f. b,c, Bars = geometric mean ± s.e.m. d,e,f,g, Individual symbol = mouse. d,e, bars = geometric mean. f, bars = mean ± s.d. n.s., not significant. Black symbols = comparisons within same day; red symbols = comparisons between days.
Extended Data Figure 6
Extended Data Figure 6. In vitro activity of E. coli Nissle microcins against S. Typhimurium and AIEC
a–i, Strains were grown overnight in Nutrient Broth + 0.2 mM 2,2′-dipyridyl. Growth assays were performed in iron-limiting conditions (DMEM/F12 + 10% FBS) or in media supplemented with 1 μM iron citrate. Timepoints at 0, 5, 8 and 11 hours post-inoculation were collected. a,b, STm CFU/mL when grown alone or in competition with wild-type or mutant EcN in (a) iron-limiting conditions or in (b) media supplemented with 1 μM iron citrate. c, STm CFU/mL in iron-limiting conditions when in competition with wild-type EcN or an EcN mchDEF strain harboring either pWSK29::mchDEF or empty vector control. d,e, CFU/mL of wild-type or mutant EcN when grown alone or in competition with STm in (d) iron-limiting conditions or in (e) media supplemented with 1 μM iron citrate. f,g, AIEC CFU/mL when grown alone or in competition with wild-type or mutant EcN in (f) iron-limiting conditions or in (g) media supplemented with 1 μM iron citrate. h,i, CFU/mL of wild-type or mutant EcN when grown alone or in competition with AIEC in (h) iron-limiting conditions or in (i) media supplemented with 1 μM iron citrate. a–i, Symbols = geometric mean (three independent experiments) ± s.e.m. *P<0.05, **P<0.01, ***P<0.001, ****P<0.0001.
Extended Data Figure 7
Extended Data Figure 7. Co-administration of S. Typhimurium with E. coli Nissle wild-type or EcN mchDEF
a–e, See Fig. 3d for co-administration design with SPF mice. a,b, Intragastric inoculation with wild-type STm. Cecal (a) gene expression (STm only, n = 7; all others, n = 9); data are expressed as fold change over mock-treated mice or (b) histopathology (STm only and STm + wild-type EcN, n = 5; STm + EcN mchDEF, n = 4) from mice shown in Fig. 3f,g at Day 7 post-infection. c–e, Intragastric inoculation with STm invA spiB. c,d, CFU/mg of (c) STm invA spiB (n = 4) or (d) wild-type EcN or EcN mchDEF in fecal content at designated timepoints post-infection when STm invA spiB was administered alone or in competition as indicated (n = 5/group). e, Ratio of wild-type EcN or EcN mchDEF over STm invA spiB in fecal content at designated timepoints post-infection (n = 5/group). a,e, Bars = geometric mean ± s.e.m. b–d, Individual symbol = mouse. b, Bars = mean. c,d, Bars = geometric mean. n.s., not significant.
Extended Data Figure 8
Extended Data Figure 8. Gut colonization of AIEC in DSS-treated mice when competing with E. coli Nissle wild-type or EcN mchDEF
a, Experimental design for b–f with SPF mice. b, Ratio of wild-type EcN or EcN mchDEF over AIEC in fecal content at days 1–5 post-intragastric inoculation (n = 9/group). Bars = geometric mean ± s.e.m. c,d, CFU/mg of (c) AIEC or (d) wild-type EcN or EcN mchDEF in fecal content at days 1–5 post-inoculation when AIEC was administered alone or in competition as indicated (n = 9/group). e, Cecal histopathology scores at day 5 post-inoculation for panels c,d (n = 5/group). f, Detailed histopathology scoring of panel e mice. b, Bars = geometric mean ± s.e.m. c–e, Individual symbol = mouse. c,d, Bars = geometric mean. e, Bars = mean. *P<0.05, **P<0.01, ***P<0.001, ****P<0.0001; n.s., not significant.
Extended Data Figure 9
Extended Data Figure 9. Therapeutic administration of E. coli Nissle wild-type, EcN mchDEF or mock during S. Typhimurium infection
a–j, See Fig. 4a for therapeutic design with SPF mice. a–f, Intragastric inoculation with wild-type STm. a, Ratio of wild-type EcN or EcN mchDEF over STm in fecal content on days 4–7 post-infection with STm (n = 8/group). b,c,e, STm CFU/mg at designated timepoints post-infection in fecal content of mice therapeutically treated with (b) mock (n = 7), (c) wild-type EcN (n = 8) or (e) EcN mchDEF (n = 8). d,f, CFU/mg of (d) wild-type EcN or (f) EcN mchDEF in fecal content at designated timepoints post-STm infection. g,h, Intragastric inoculation with STm pMcmI (n = 10/group). CFU/mg of (g) STm pMcmI or (h) wild-type EcN in fecal content at designated timepoints post-STm pMcmI infection. Grey box represents average STm CFU/mg in mock-treated mice (panel b). i, Cecal histopathology scores for panels b–f (STm alone, n = 6; all others, n = 7). j, Detailed histopathology scoring of panel i mice. a, Bars = geometric mean ± s.e.m. i, Bars = mean. *P< 0.05, **P< 0.01, ***P< 0.001; n.s., not significant.
Extended Data Figure 10
Extended Data Figure 10. In vitro growth curves of microcin M (mcmA) and microcin H47 (mchB) EcN mutants in competition with commensal E. coli, S. Typhimurium, or AIEC
a–h, Strains were grown overnight in Nutrient Broth + 0.2 mM 2,2′-dipyridyl. Growth assays were performed in iron-limiting conditions (DMEM/F12 + 10% FBS) and timepoints at 0, 5, 8 and 11 hours post-inoculation were collected. a–c, CFU/mL of (a) commensal E. coli, (b) STm or (c) AIEC when grown alone or in competition with the indicated EcN strain. d, CFU/mL of complemented and uncomplemented EcN microcin immunity gene mutants when in competition with EcN wild-type. e, CFU/mL of wild-type STm or STm harboring pMchI or pMcmI when in competition with EcN wild-type. f-h, CFU/mL of (f) STm fepA, (g) STm iroN and (h) STm fepA iroN in competition with either wild-type EcN or EcN mcmA mchB. a–h, Symbols = geometric mean (three independent experiments) ± s.e.m. *P< 0.05, **P< 0.01, ***P< 0.001, ****P< 0.0001.
Figure 1
Figure 1. Microcins do not promote bacterial competition in the absence of intestinal inflammation
a,c,e,g, SPF streptomycin-treated (day -1) mice or b,d,f, germ-free mice were intragastrically inoculated with indicated E. coli strain(s). ad, CFU/mg feces from (a,c) SPF or (c,d) germ-free mice on days 1–5 post-inoculation. e,f, Ratio (EcN over commensal) of (e) panels a,c or (f) panels b,d; bars = mean ± s.e.m. g, Cecal histopathology scores for panels a,c mice. ad,g, Symbol = individual mouse; bars = geometric mean. h, gapA-normalized mcmA (microcin M) and mchB (microcin H47) mRNA levels in iron-rich and iron-limited media. Bars = geometric mean (three independent experiments) ± s.e.m. *P<0.05, **P<0.01; n.s., not significant. Unpaired Student’s t test was utilized for statistical comparisons in panel h, Mann-Whitney-Wilcoxon for all other comparisons; P-values are presented in Supplementary Table 7.
Figure 2
Figure 2. Microcins enable E. coli Nissle to limit the expansion of a commensal E. coli in the inflamed gut
a, Experimental design for bd. bd, (b) Ratio (EcN over commensal) or (c,d) CFU/mg sample at days 1–5 post-intragastric inoculation of indicated E. coli strain(s). b, Bars = mean ± s.e.m. c,d, Symbol = individual mouse; bars = geometric mean; data represent two experiments. *P<0.05, **P<0.01; n.s., not significant. Statistics in black compare same timepoint; red compare different timepoints. Mann-Whitney-Wilcoxon was utilized for all statistical comparisons; P-values are presented in Supplementary Table 7.
Figure 3
Figure 3. E. coli Nissle utilizes microcins to outcompete an enteric pathogen when the strains are co-administered
a, Experimental design for b,c. b,c, (b) CFU/mg feces or (c) competitive index (CI; EcN wild-type over mutant) at days 1–5 post-intragastric inoculation of indicated E. coli strains. d, Co-administration design for e-g. e–g, (e) Ratio (EcN over STm) or (f,g) CFU/mg feces at designated timepoints post-intragastric inoculation of indicated strain(s). c,e, Bars = mean ± s.e.m. b,f,g, symbol = mouse; bars = geometric mean; data represent 2 independent experiments. *P<0.05, **P<0.01, ***P<0.001, ****P<0.0001; n.s., not significant. Statistics in black compare same timepoint; red compares different timepoints. Mann-Whitney-Wilcoxon was utilized for all statistical comparisons; P-values are presented in Supplementary Table 7.
Figure 4
Figure 4. Microcins therapeutically reduce colonization of an enteric pathogen in the inflamed gut
a, Therapeutic design for b–d and Extended Data Fig. 9. b, Salmonella CFU/mg feces, days 1 and 4–7 post-infection. For panel b mice, day 7: c, cecal mRNA levels; d, weight loss. b, symbol = mouse; bars = geometric mean; data represent 2 independent experiments. c,d, Bars = mean ± s.e.m. *P<0.05, **P<0.01, ***P<0.001; n.s., not significant. Statistics in black compare to STm (+mock); red compares to STm (+EcN wt). Mann-Whitney-Wilcoxon was utilized for all statistical comparisons; P-values are presented in Supplementary Table 7.

References

    1. Donaldson GP, Lee SM, Mazmanian SK. Gut biogeography of the bacterial microbiota. Nat Rev Microbiol. 2016;14:20–32. - PMC - PubMed
    1. Winter SE, Bäumler AJ. Why related bacterial species bloom simultaneously in the gut: principles underlying the ‘Like will to like’ concept. Cell Microbiol. 2014;16:179–184. - PMC - PubMed
    1. Stecher B. The Roles of Inflammation, Nutrient Availability and the Commensal Microbiota in Enteric Pathogen Infection. Microbiol Spectr. 2015;3 - PubMed
    1. Ng KM, et al. Microbiota-liberated host sugars facilitate post-antibiotic expansion of enteric pathogens. Nature. 2013;502:96–99. - PMC - PubMed
    1. Winter SE, et al. Host-derived nitrate boosts growth of E coli in the inflamed gut. Science. 2013;339:708–711. - PMC - PubMed

Publication types

MeSH terms