. 2016 Dec 1;540(7631):139-143.
doi: 10.1038/nature20555. Epub 2016 Oct 31.

Multiple dynamin family members collaborate to drive mitochondrial division

Affiliations

Multiple dynamin family members collaborate to drive mitochondrial division

Jason E Lee et al. Nature. .

Abstract

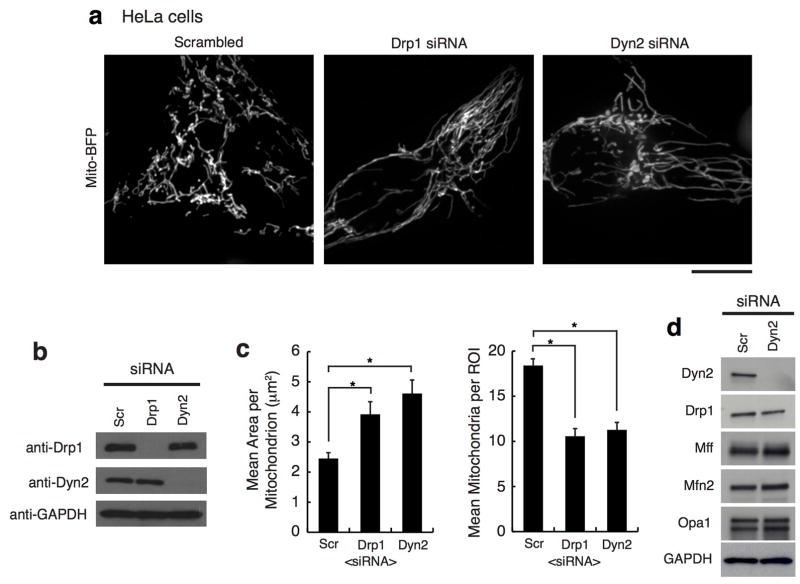
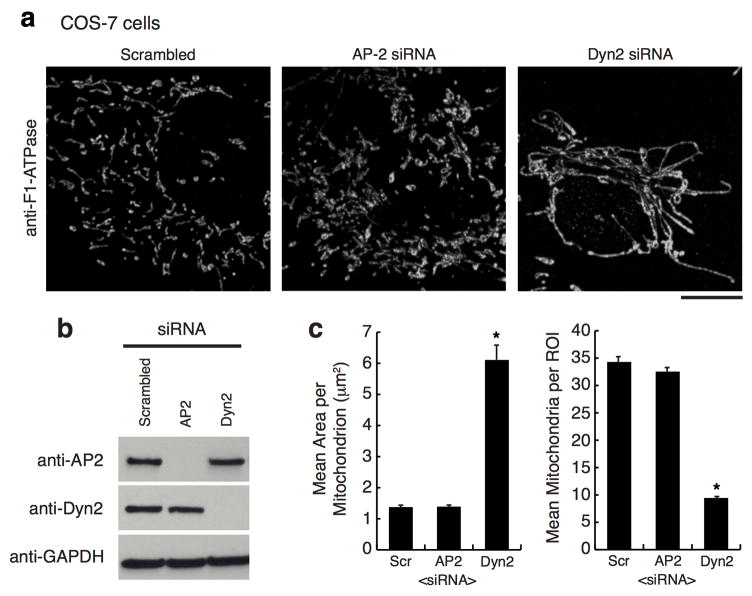
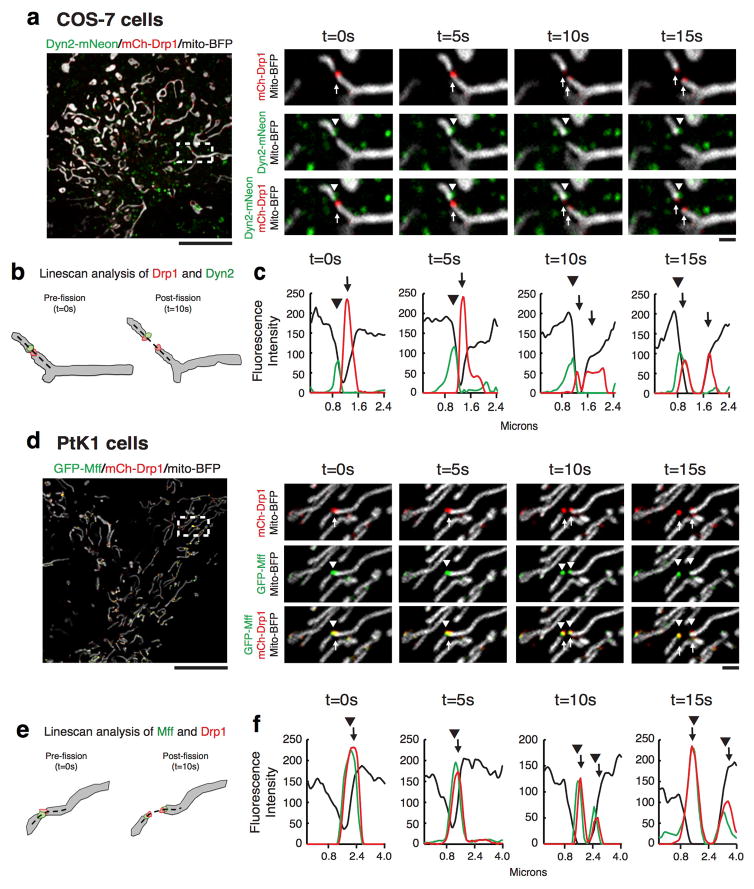
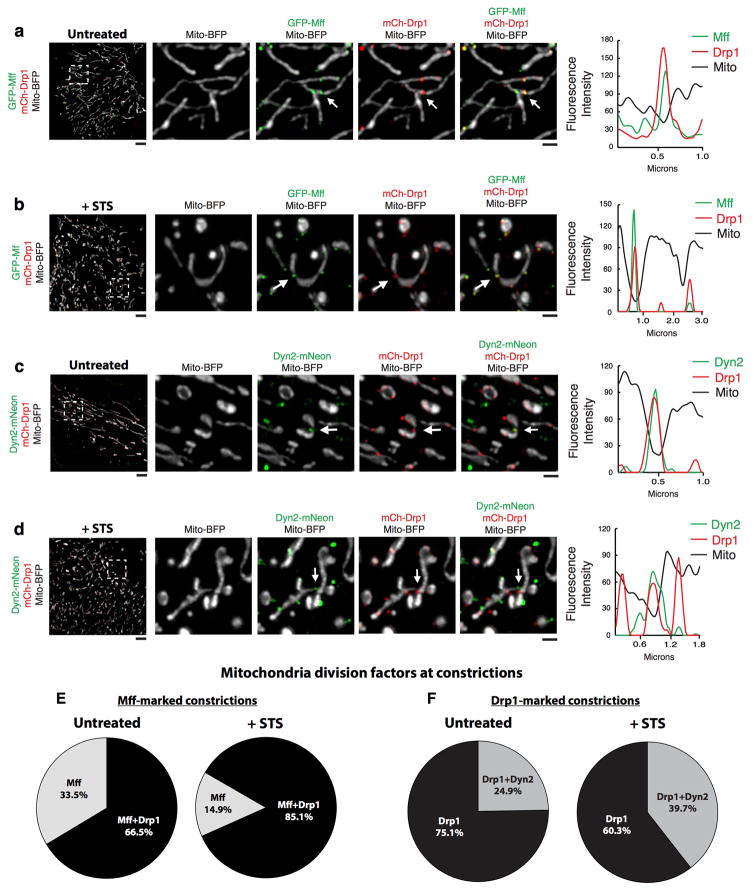
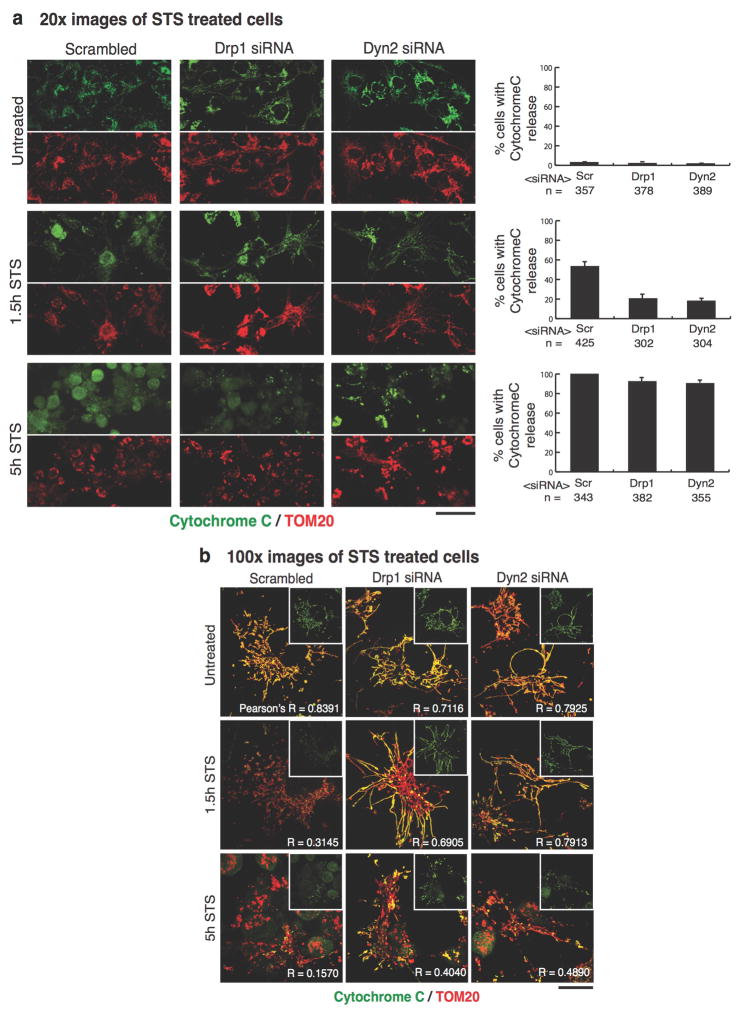
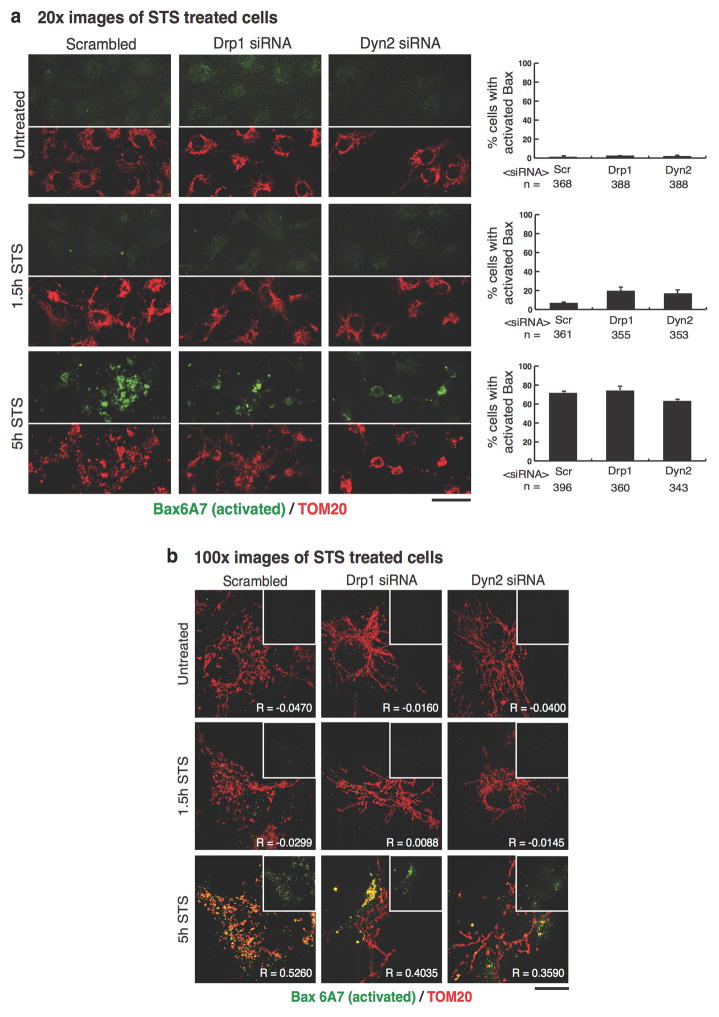
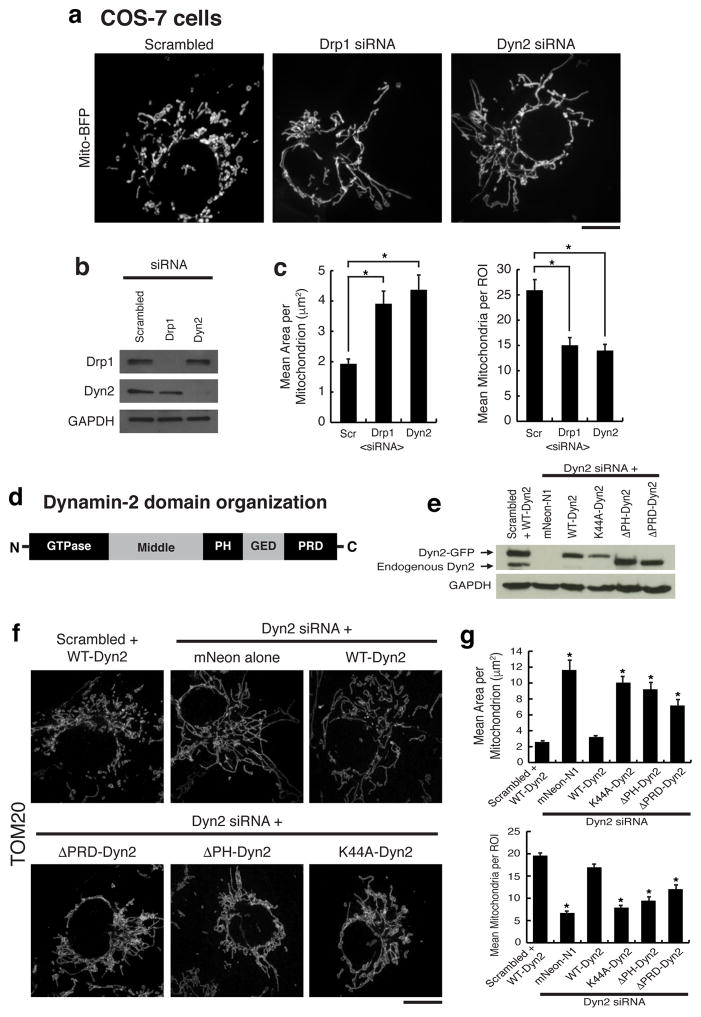
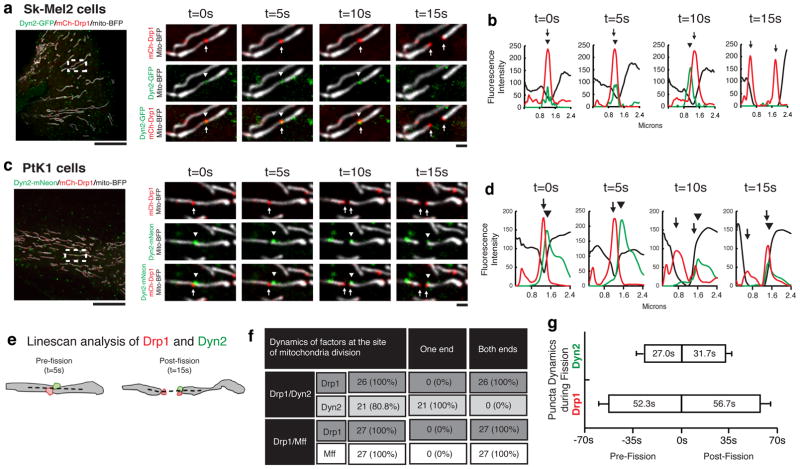
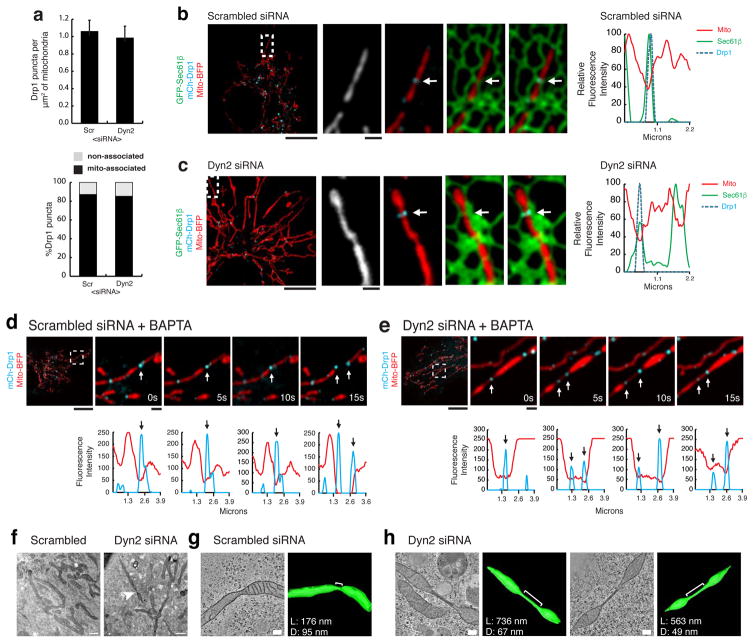
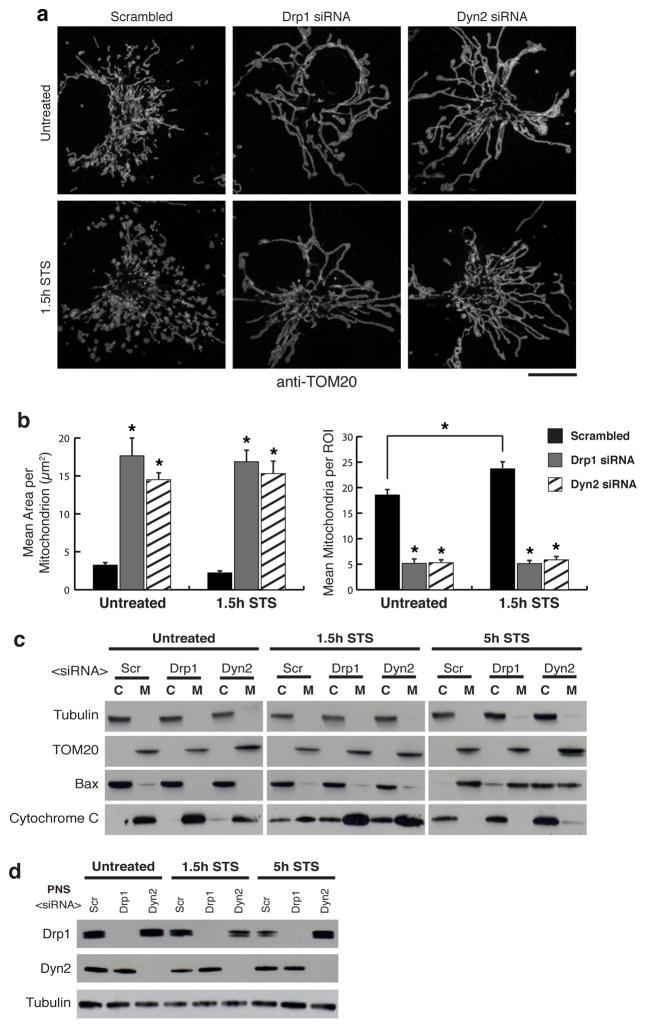
Mitochondria cannot be generated de novo; they must grow, replicate their genome, and divide in order to be inherited by each daughter cell during mitosis. Mitochondrial division is a structural challenge that requires the substantial remodelling of membrane morphology. Although division factors differ across organisms, the need for multiple constriction steps and a dynamin-related protein (Drp1, Dnm1 in yeast) has been conserved. In mammalian cells, mitochondrial division has been shown to proceed with at least two sequential constriction steps: the endoplasmic reticulum and actin must first collaborate to generate constrictions suitable for Drp1 assembly on the mitochondrial outer membrane; Drp1 then further constricts membranes until mitochondrial fission occurs. In vitro experiments, however, indicate that Drp1 does not have the dynamic range to complete membrane fission. In contrast to Drp1, the neuron-specific classical dynamin dynamin-1 (Dyn1) has been shown to assemble on narrower lipid profiles and facilitate spontaneous membrane fission upon GTP hydrolysis. Here we report that the ubiquitously expressed classical dynamin-2 (Dyn2) is a fundamental component of the mitochondrial division machinery. A combination of live-cell and electron microscopy in three different mammalian cell lines reveals that Dyn2 works in concert with Drp1 to orchestrate sequential constriction events that build up to division. Our work underscores the biophysical limitations of Drp1 and positions Dyn2, which has intrinsic membrane fission properties, at the final step of mitochondrial division.


Figures

Extended Data Figure 1
Extended Data Figure 1. Dynamin-2 is required for mitochondrial division
a, Representative images of HeLa cells expressing mito-BFP that were transfected with scrambled control, Drp1, or Dyn2 siRNA. n = 36 cells for each siRNA treatment. Scale bars = 10 μm. b, Immuno-blots with antibodies against Dyn2, Drp1, and GAPDH in siRNA-treated cells. c, The effect on mitochondrial morphology was quantitated within a 230 μm2 region of interest (ROI) for mean area per mitochondria (left graph), and mean mitochondria per ROI (right graph). Similar to COS-7 cells, Drp1 or Dyn2–depleted cells had larger mitochondria and less mitochondrion per ROI compared to control cells. These data were obtained from three biological replicate experiments; each for scrambled siRNA, Drp1 siRNA, Dyn2 siRNA treatments. Error bars represent the the standard error of the mean (s.e.m). *p<0.01 statistical significance via analysis by ANOVA. d, Immuno-blot analyses were performed on scrambled siRNA and Dyn2 siRNA treated cell lysates with antibodies against Dyn2, GAPDH, and mitochondrial fission (Drp1, Mff) and fusion (Mfn2, Opa1) machineries.
Extended Data Figure 2
Extended Data Figure 2. Inhibition of clathrin-mediated endocytosis does not affect mitochondrial morphology
a, Representative images of TOM20 immunofluorescence in n = 50, 50, 52 COS-7 cells transfected with scrambled control, AP-2, or Dyn2 siRNA. Scale bars = 10 μm. b, Immuno-blots with antibodies against AP-2, Dyn-2, and GAPDH in siRNA-treated cells. c, The effect on mitochondrial morphology was quantitated within a 230 μm2 region of interest (ROI) for mean area per mitochondria (left graph), and mean mitochondria per ROI (right graph). As in Figure 1, Dyn2–depleted cells had larger mitochondria and less mitochondrion per ROI compared to control cells; however, AP-2 depleted cells displayed mitochondrial morphology that was qualitatively and quantitatively similar to control cells. These data were obtained from three biological replicate experiments. Error bars represent the s.e.m. *p<0.01 statistical significance via analysis by ANOVA.
Extended Data Figure 3
Extended Data Figure 3. Dyn2 depletion does not phenocopy starvation-induced inhibition of Drp1
a,b, The phosphorylation status of Drp1 was evaluated by immunoblot on whole-cell lysates in scrambled and Dyn2 siRNA-treated cells using antibodies against (a) phosphoserine637-Drp1 and (b) phosphoserine616-Drp1. Antibodies against Drp1 and Dyn2 were used to measure total Drp1 and Dyn2 levels, respectively, and anti-GAPDH was used as a loading control. The optical densities of phosphorylated-serine Drp1 signal were normalized to their corresponding GAPDH signal (graphs in a,b). The data represented in graphs for both (a) and (b) were obtained from three biological replicate experiments. Error bars represent the s.e.m. *p<0.01 statistical significance via analysis by paired t-Test.
Extended Data Figure 4
Extended Data Figure 4. Live-cell imaging of mitochondrial division machinery before, during, and after division
a, Representative example of mitochondrial division (6 events from 108 cells) in COS-7 cells expressing mito-BFP (gray), mCh-Drp1 (red), and Dyn2-mNeon (green) (Video 2). The highlighted insets show the temporal and spatial dynamics of Drp1 (arrows) and Dyn2 (arrowheads) prior to and during mitochondrial division. Scale bars for whole cell panels and the inset panel are 10 μm and 1 μm, respectively. b, The cartoon schematic identifies two temporal moments of interest with respect to Drp1, Dyn2, and mitochondrial dynamics, the frame prior to and the frame after division, with a dashed line that identifies the region that was analyzed by line-scan. c, Line-scan analysis of Drp1 and Dyn2 leading up to and following mitochondrial division. d, Representative example mitochondrial division (27 events from 49 cells) in PtK1 cells expressing mito-BFP (gray), mCh-Drp1 (red), and GFP-Mff (green). The highlighted insets show the temporal and spatial dynamics of Drp1 (arrows) and Mff (arrowheads) prior to and during mitochondrial division. Scale bars for whole cell panels and the inset panel are 10 μm and 1 μm, respectively. e, A cartoon schematic identifies the two temporal moments of interest with respect to Mff, Drp1, and mitochondrial dynamics. F, Line-scan analysis of Mff and Drp1 leading up to and following mitochondrial division. Note, that the interaction between Drp1 and its adaptor, Mff, is maintained throughout the process of mitochondrial division, in contrast, Dyn2 associates with only one daughter mitochondrion.
Extended Data Figure 5
Extended Data Figure 5. STS treatment stalls division factors at mitochondrial constrictions
a–d, Structure illumination microscopy was used to capture images of PtK1 cells expressing mCh-Drp1 (red), mito-BFP (gray), and either GFP-Mff (a–b, green, n = 10/12 cells) or Dyn2-mNeon (c–d, green, n = 13/13 cells) that were untreated/treated with 1 μM staurosporine (STS). The effect of STS treatment on division machinery localization was scored by line-scan analyses. Line-scan analysis verified the co-localization of Drp1 at Mff-marked constrictions (a–b) and Dyn2 at Drp1-marked constrictions (c–d). Under steady-state conditions, 66.5% of Mff-marked constrictions co-labeled with Drp1 (336 out of 505 Mff-marked constrictions), whereas STS treatment increased the co-localization of Drp1 with Mff-marked constrictions to 85.1% (538 out of 632 Mff-marked constrictions) e, Only 24.9% of Drp1-marked constrictions were co-labeled with Dyn2 in untreated cells (128 out of 514 constrictions). Furthermore, the co-localization of Dyn2 to Drp1-marked constrictions increased to 39.7% following STS treatment (140 out of 353 Drp1-marked constrictions) f, Taken together, STS treatment results in an increase of Drp1 at Mff-marked constrictions as well as an increase in Dyn2 localization to Drp1-marked constrictions. Scale bars for whole cell panels and the inset panel are 10 μm and 1 μm, respectively.
Extended Data Figure 6
Extended Data Figure 6. Drp1 and Dyn2 depletion delays cytochrome C release from mitochondria after STS treatment
Scrambled-, Drp1-, and Dyn2-siRNA cells were first treated with 75 μM zVAD-fmk for 4 hr, then either left untreated or treated with STS for 1.5 or 5 hr. Cells were then fixed with 4% paraformaldehyde, permeabilized with 0.1% Triton X-100, and immuno-labeled with cytochrome C in green, and TOM20 to stain mitochondria in red. a, 20x images were captured and the percentage of cells displaying cytochrome C release was scored. n = the total number of cells scored. Error bars represent the s.e.m.. Scale bars = 50 μm. b, 100x images were captured to spatially resolve the subcellular localization of cytochrome C. The main panel displays a merged image of cytochrome C/TOM20 and a single channel image of cytochrome C in the inset. The co-localization of cytochrome C with mitochondria was analyzed using the coloc2 ImageJ plugin, and the mean Pearson’s R coefficient is displayed in the bottom-right corner of each image. n = 40 cells/condition. Scale bars = 10 μm. These data were obtained from three biological replicate experiments.
Extended Data Figure 7
Extended Data Figure 7. Bax activation is accelerated in Drp1 and Dyn2 depleted cells following STS treatment
Scrambled-, Drp1-, and Dyn2-siRNA cells were treated and fixed as in Extended Data Figure 6, then immuno-labeled with an antibody targeting activated Bax (Bax6A7) in green, and TOM20 to stain mitochondria in red. A, 20x images were captured and the percentage of cells displaying Bax activation was scored. n = the total number of cells scored. Error bars represent the s.e.m.. Scale bars = 50 μm. b, 100x images were captured to spatially resolve the subcellular localization of activated Bax. The main panel displays a merged image of activated Bax/TOM20 and a single channel image of activated Bax in the inset. The co-localization of activated Bax with mitochondria was analyzed using the coloc2 ImageJ plugin, and the mean Pearson’s R coefficient is displayed in the bottom-right corner of each image. n = 40 cells/condition. Scale bars = 10 μm. These data were obtained from three biological replicate experiments.
Figure 1
Figure 1. Dynamin-2 is required for mitochondrial division
a, Representative images of mito-BFP in n = 42, 42, 43 cells for scrambled, Drp1, and Dyn2 siRNA cells, respectively. b, Immuno-blot of Drp1, Dyn2, and GAPDH in siRNA-treated cells. c, Mitochondrial morphology was quantitated for mean area per mitochondria and mean mitochondria per region of interest (ROI). d, The domain organization of Dynamin-2. e, Immuno-blot of endogenous and exogenous Dynamin expression levels in rescue experiments. f, Representative images of TOM20 immunofluorescence in n = 40, 40, 45, 40, 44, 41 cells transfected with scrambled siRNA+WT-Dyn2, Dyn2 siRNA+mNeon-N1, Dyn2 siRNA+variants (WT, K44A, ΔPH, ΔPRD), respectively. g, Mitochondrial morphology was assessed as in (c). (c,g) Error bars represent the standard error of the mean (s.e.m.). *p<0.01 statistical significance calculated by ANOVA and obtained from three biological replicate experiments. a,f, Scale bars = 10 μm.
Figure 2
Figure 2. Dynamics of Dyn2 recruitment during mitochondrial division
a,b, Mitochondrial division was imaged live in Sk-Mel2 (14 events from 144 cells). c,d, and PtK cells (26 events from 254 cells). Highlighted insets show the spatiotemporal dynamics of Drp1 (arrows) and Dyn2 (arrowheads) prior to and during mitochondrial division (a,c), Line-scan analysis of mean fluorescence intensity (MFI) verifying Drp1 and Dyn2 dynamics (b,d). e, A cartoon schematic depicts the frame prior to division that determines the presence of division factors (Dyn2 and Drp1) at the site of division, and the frame after division that determines the interactions of division factors with the ends of daughter mitochondria, which are summarized in f. The dashed line in (e) represents area analyzed by line-scan. g, Lifetimes of Drp1 and Dyn2 puncta on mitochondria before and after division were analyzed from 21 division events. Error bars represent s.e.m.. b,d, Scale bars for whole cell panels and the inset panel are 10 μm and 1 μm, respectively.
Figure 3
Figure 3. Dyn2 depleted cells reveal dynamic mitochondrial “super-constrictions”
a, Mitochondrial-association of Drp1 puncta was analyzed. n = 12, 12 cells for scrambled and Dyn2 siRNA treatments, respectively. *p<0.01 statistical significance calculated by paired t-Test. Error bars represent s.e.m.. b,c Examples of Drp1-marked constrictions at ER-mitochondria contacts (arrows) in (b) scrambled (n = 12) or (c) Dyn2 siRNA-treated (n=12) cells. The MFI of each factor was derived from line-scans and plotted (graphs). d,e Representative images of scrambled (d, Video 4, 11 events from 31 cells) versus Dyn2 (e, Video 5, 10 events from 34 cells) siRNA-treated cells were captured following acute BAPTA-AM treatment. The MFI of Drp1 and mitochondria were derived from line-scans and plotted for each time-point (graphs). f, Representative electron micrographs of scrambled (n = 40 cells) and Dyn2 siRNA-treated (n = 53 cells) cells captured from serial thin-sections revealed severe mitochondrial constrictions (arrowhead) in Dyn2 siRNA-treated cells. g–h, Representative EM tomographs and corresponding 3D models of mitochondrial constrictions (<100 nm diameter) observed in (g) scrambled (4 constrictions from 12 sections) or (h) Dyn2 siRNA-treated (10 constrictions from 12 sections) cells. In control cells, the mean diameter (D) and length (L) are 77 ± 20 nm and 143 ± 61 nm, respectively. Mitochondrial constrictions in Dyn2-depleted cells displayed D = 55 ± 12 nm and L = 358 nm with a min/max = 145/771 nm. b–e, Scale bars for whole cell and inset panels are 10 μm and 1 μm, respectively. f, Scale bars = 1000 nm. g,h, Scale bars = 200 nm.
Figure 4
Figure 4. Dynamin-2 is required for STS-induced mitochondrial fragmentation
a, Representative images of TOM20 immunofluorescence in n = 41/42, 45/43, 45/43 scrambled, Drp1, Dyn2 siRNA cells (without/with 1.5 hour STS treatment), respectively. Scale bars = 10 μm. b, Mitochondrial morphology was quantitated for mean area per mitochondria, and mean mitochondria per ROI.. Error bars represent s.e.m.. *p<0.01 statistical significance calculated by ANOVA and obtained from three biological replicate experiments c, Cytochrome C release and Bax recruitment were evaluated by immuno-blot of cytosol/membrane fractions. a-Tubulin verified cytosolic fractions and TOM20 verified membrane fractions. d, Drp1 and Dyn2 depletion were confirmed by immuno-blot of post-nuclear supernatants (PNS).

Comment in

References

    1. Goldstein S, Moerman EJ, Porter K. High-voltage electron microscopy of human diploid fibroblasts during ageing in vitro. Morphometric analysis of mitochondria. Exp Cell Res. 1984;154:101–11. - PubMed
    1. Legesse-Miller A, Massol RH, Kirchhausen T. Constriction and Dnm1p recruitment are distinct processes in mitochondrial fission. Mol Biol Cell. 2003;14:1953–63. - PMC - PubMed
    1. Kim HW, et al. Efficient and accurate analysis of mitochondrial morphology in a whole cell with a high-voltage electron microscopy. J Electron Microsc (Tokyo) 2012;61:127–31. - PubMed
    1. Otsuga D, et al. The dynamin-related GTPase, Dnm1p, controls mitochondrial morphology in yeast. J Cell Biol. 1998;143:333–49. - PMC - PubMed
    1. Smirnova E, Griparic L, Shurland DL, van der Bliek AM. Dynamin-related protein Drp1 is required for mitochondrial division in mammalian cells. Mol Biol Cell. 2001;12:2245–56. - PMC - PubMed

Publication types