. 2016 Dec 8;540(7632):236-241.
doi: 10.1038/nature20165. Epub 2016 Oct 26.

S-2-hydroxyglutarate regulates CD8+ T-lymphocyte fate

Affiliations

S-2-hydroxyglutarate regulates CD8+ T-lymphocyte fate

Petros A Tyrakis et al. Nature. .

Abstract

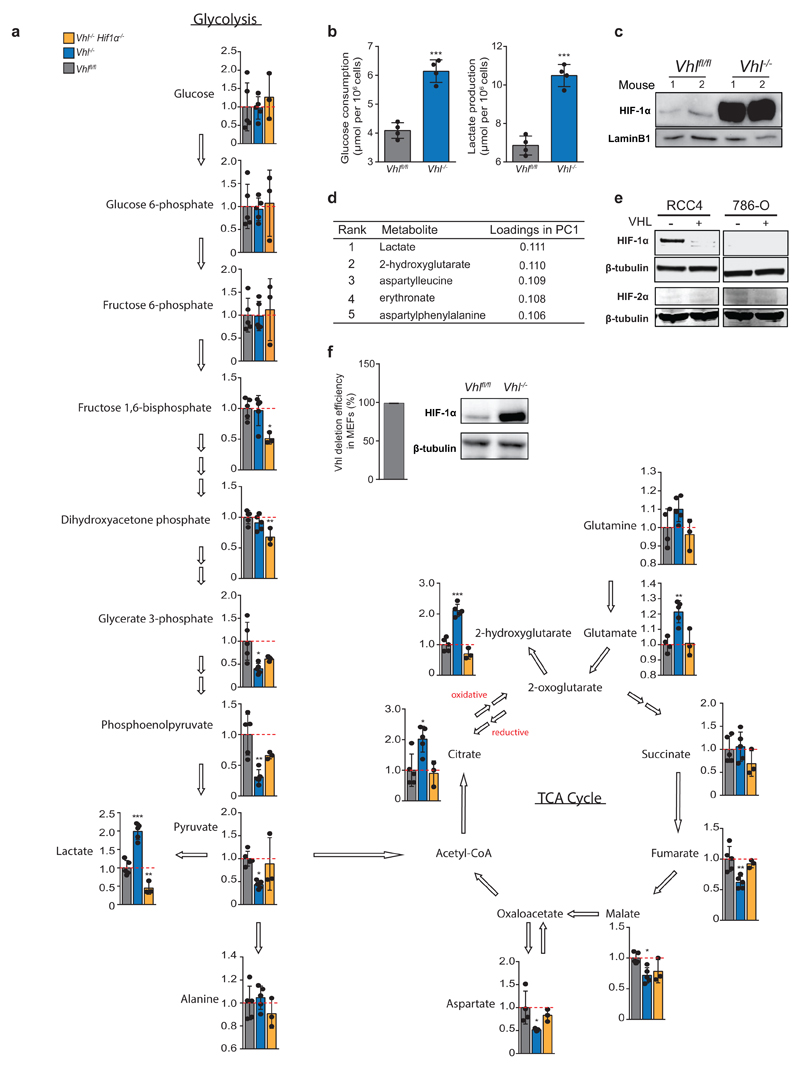
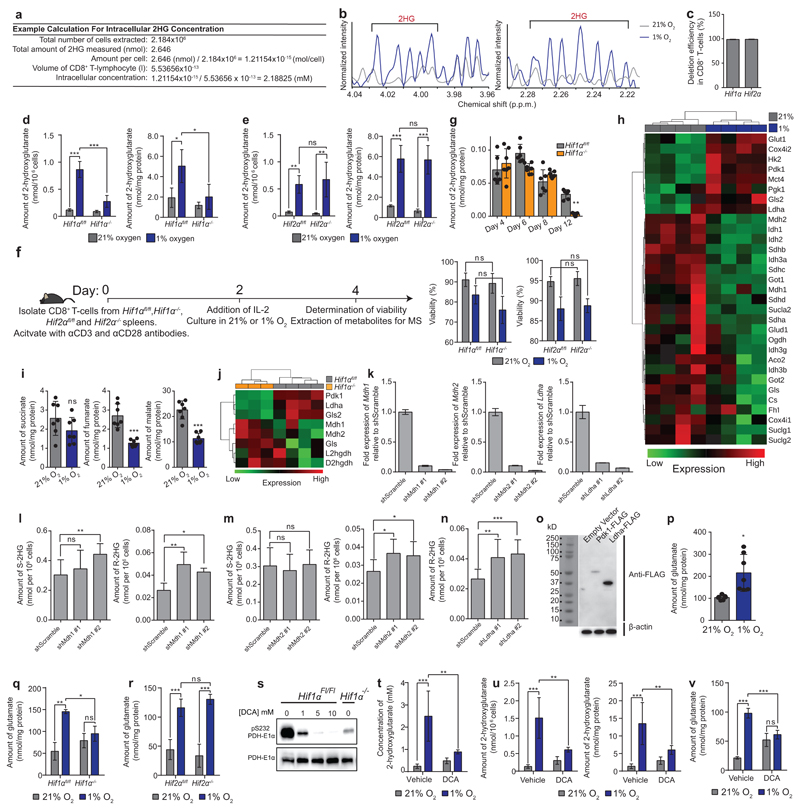
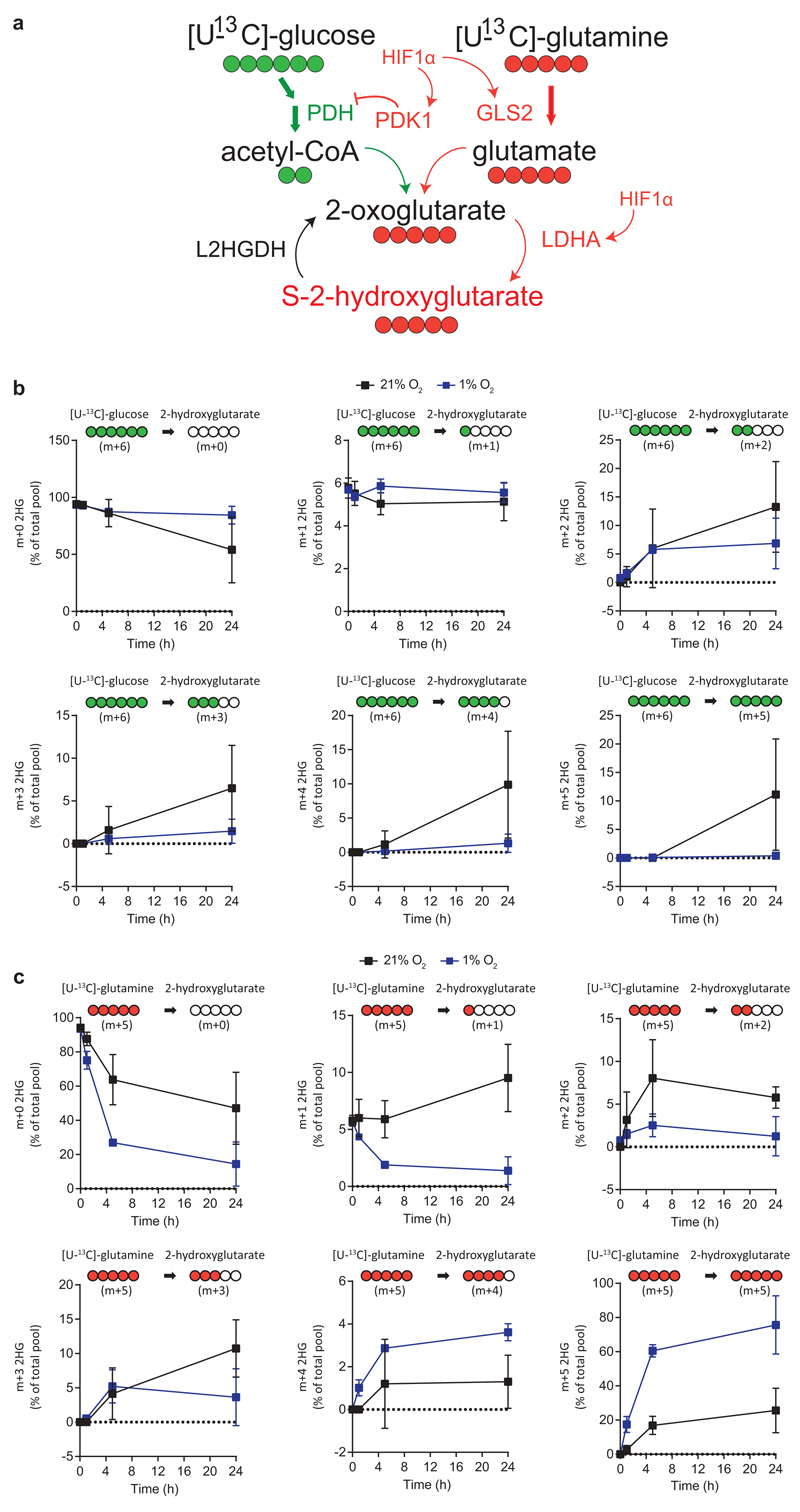
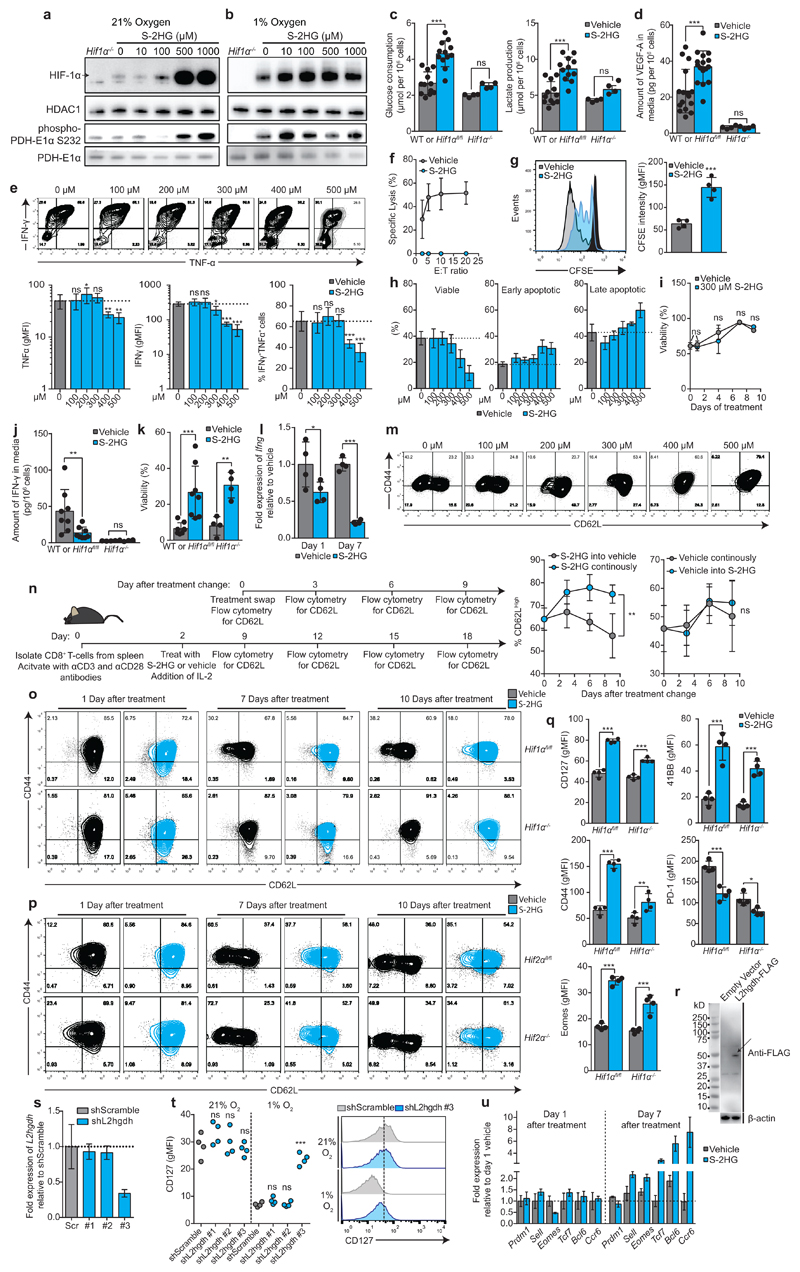
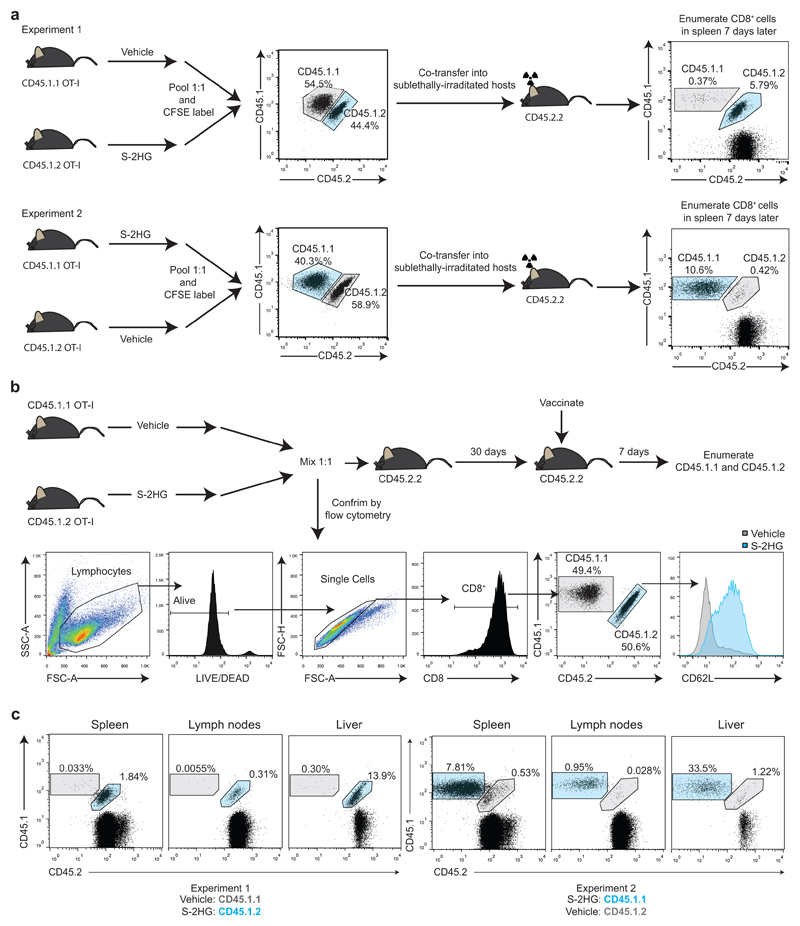
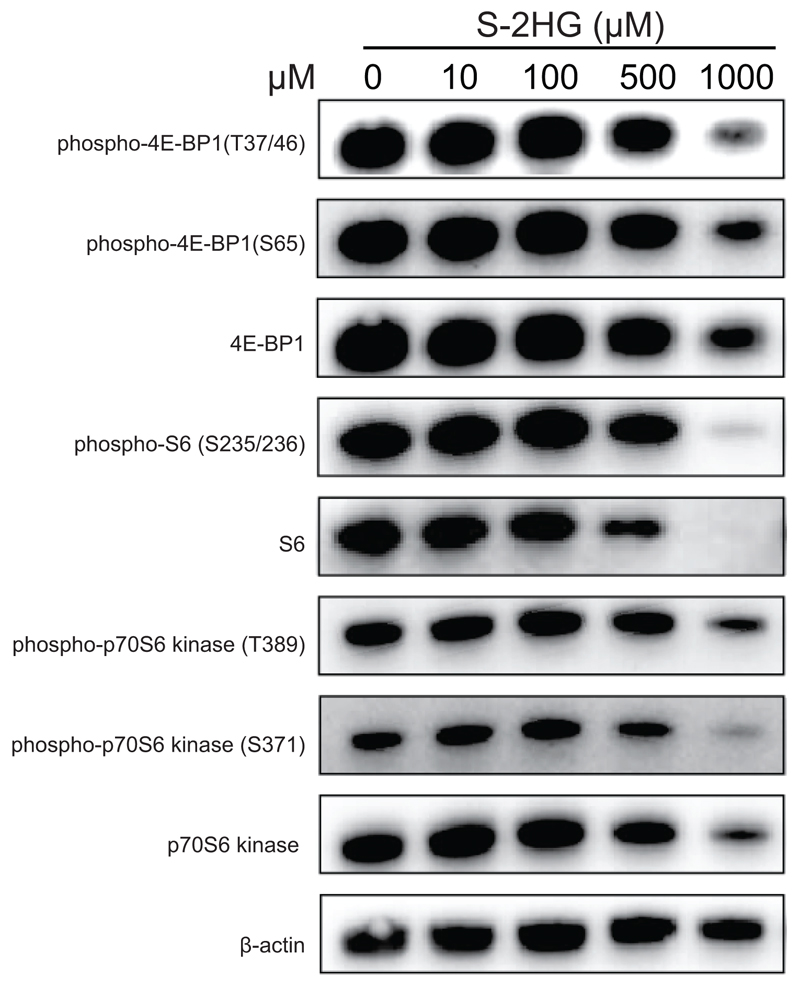
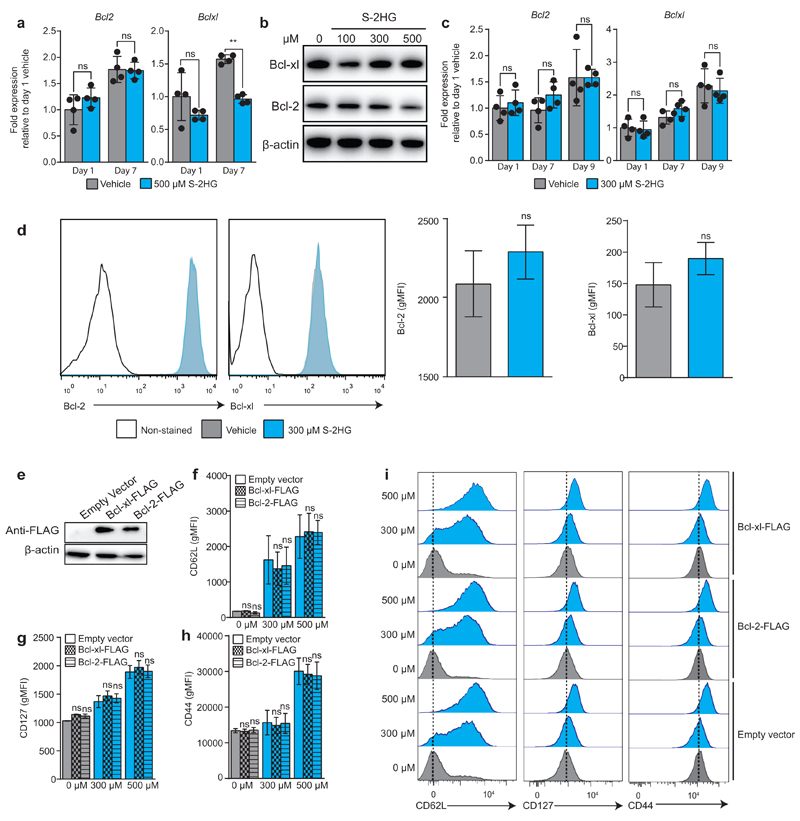
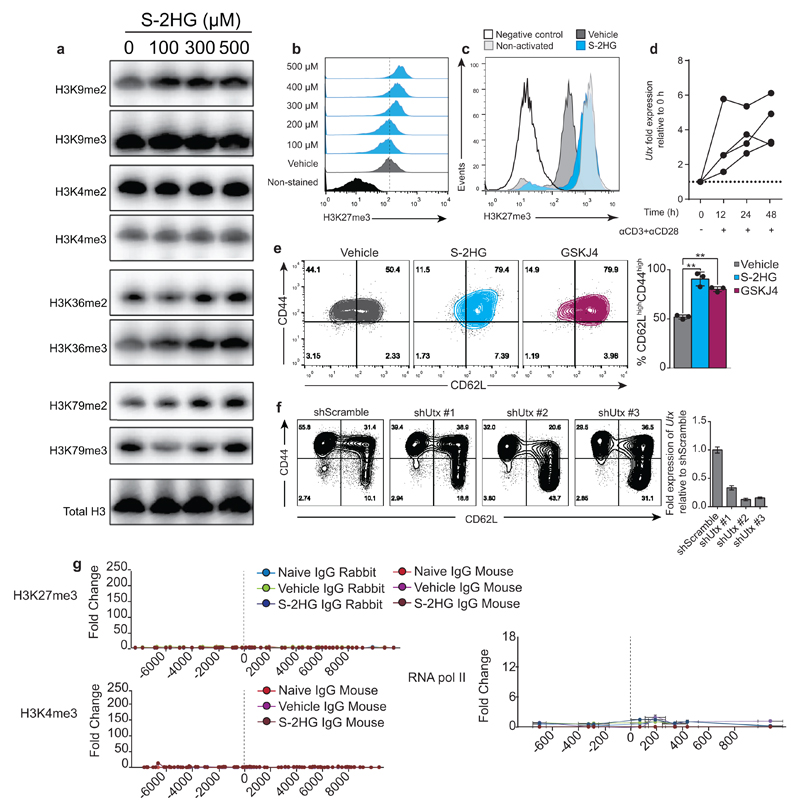
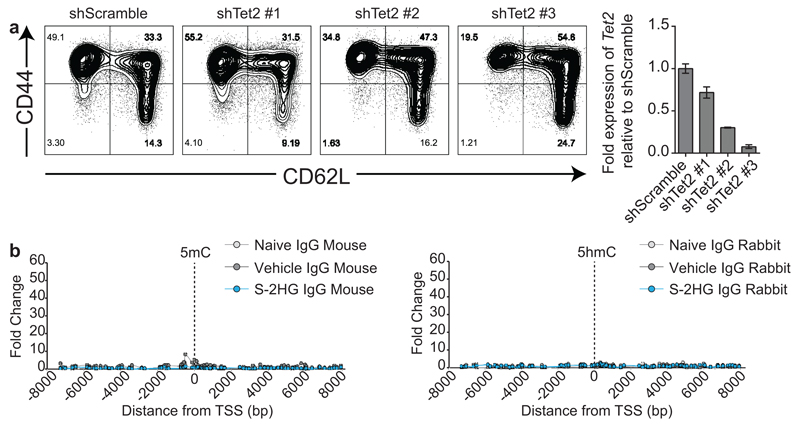
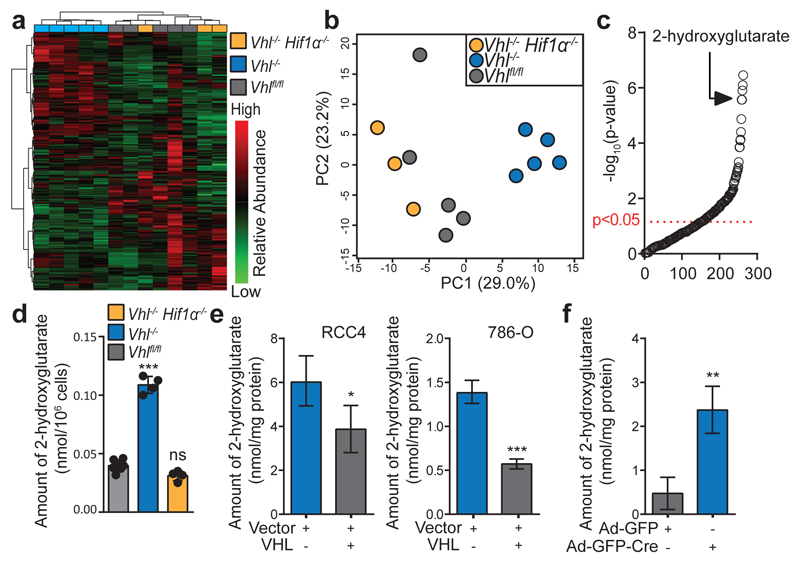
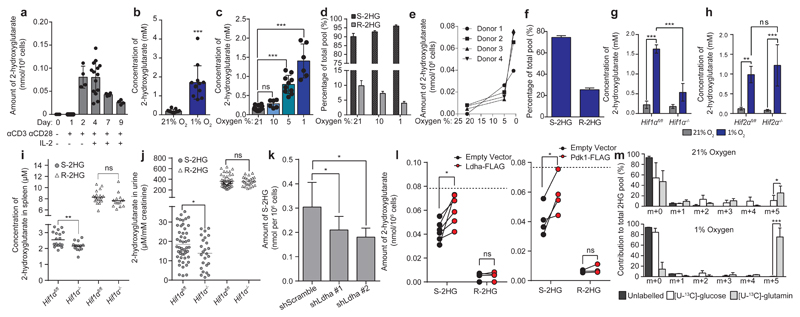
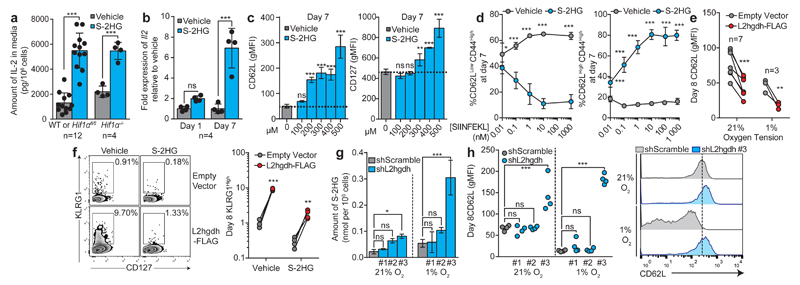
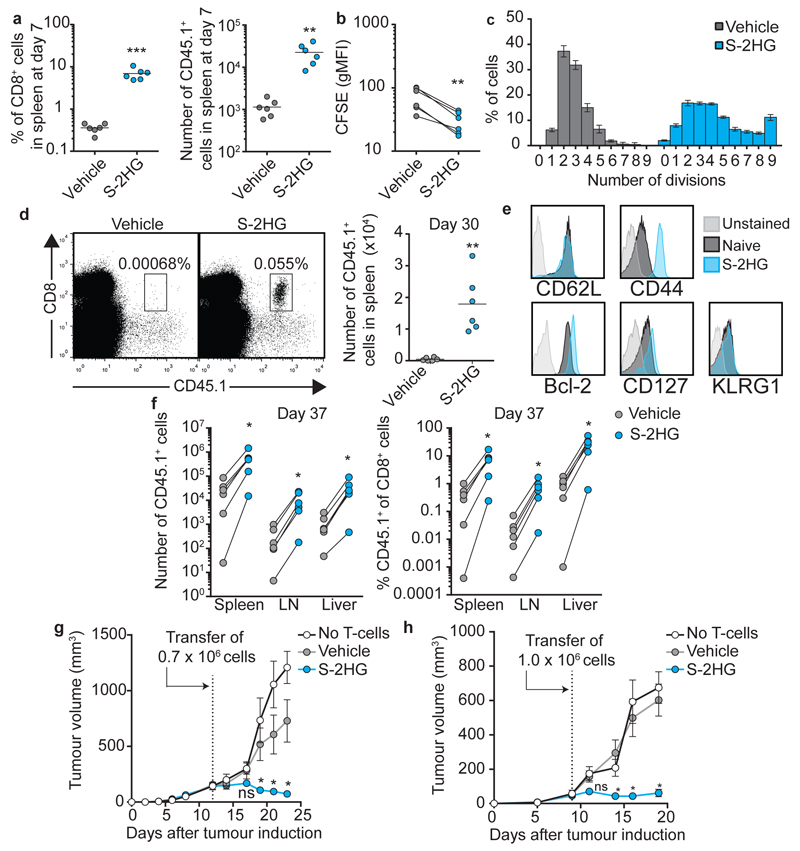
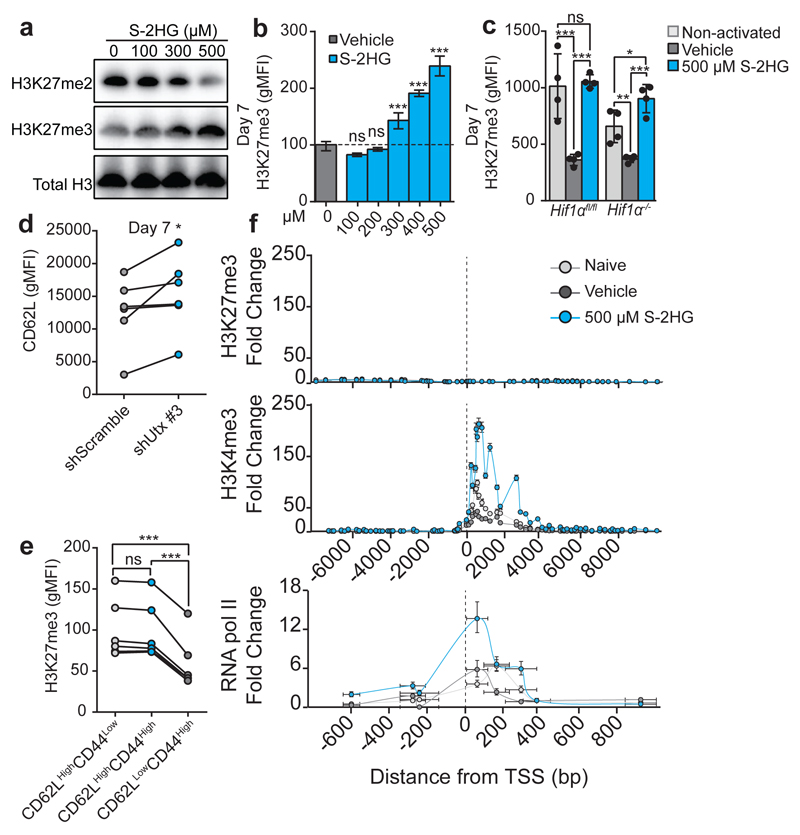
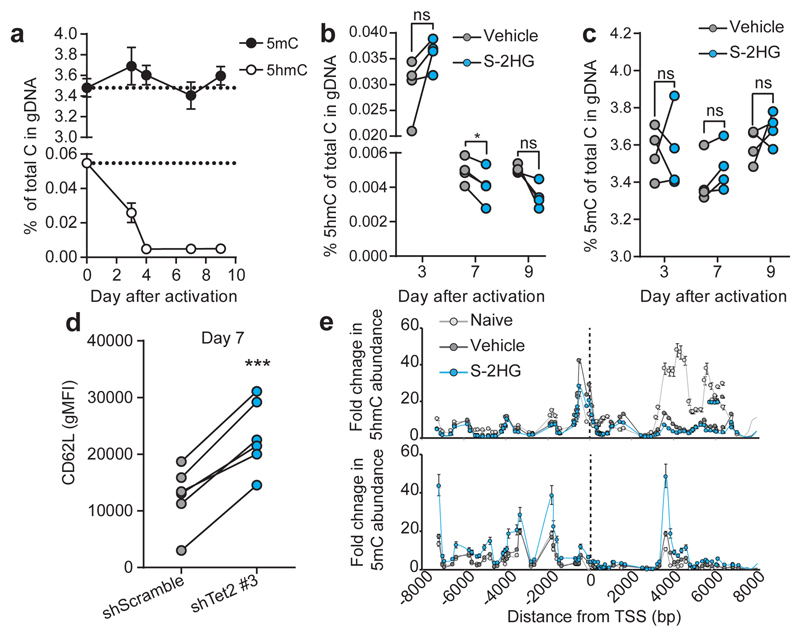
R-2-hydroxyglutarate accumulates to millimolar levels in cancer cells with gain-of-function isocitrate dehydrogenase 1/2 mutations. These levels of R-2-hydroxyglutarate affect 2-oxoglutarate-dependent dioxygenases. Both metabolite enantiomers, R- and S-2-hydroxyglutarate, are detectible in healthy individuals, yet their physiological function remains elusive. Here we show that 2-hydroxyglutarate accumulates in mouse CD8+ T cells in response to T-cell receptor triggering, and accumulates to millimolar levels in physiological oxygen conditions through a hypoxia-inducible factor 1-alpha (HIF-1α)-dependent mechanism. S-2-hydroxyglutarate predominates over R-2-hydroxyglutarate in activated T cells, and we demonstrate alterations in markers of CD8+ T-cell differentiation in response to this metabolite. Modulation of histone and DNA demethylation, as well as HIF-1α stability, mediate these effects. S-2-hydroxyglutarate treatment greatly enhances the in vivo proliferation, persistence and anti-tumour capacity of adoptively transferred CD8+ T cells. Thus, S-2-hydroxyglutarate acts as an immunometabolite that links environmental context, through a metabolic-epigenetic axis, to immune fate and function.


Conflict of interest statement

The authors declare no conflict of interest.

Figures

Extended Data Figure 1
Extended Data Figure 1. VHL-HIF-1α regulate central carbon metabolism and 2HG levels in CD8+ T-lymphocytes.
a/ Illustration of central carbon metabolism in CD8+ lymphocytes, including glycolysis and the tricarboxylic acid cycle, depicting relative levels of detected metabolites between Vhlfl/fl (n=5), Vhlfl/fldlckcre (n=5) and Hif1αfl/fl Vhlfl/fldlckcre (n=3) CD8+ T-lymphocyte groups. b/ Glucose consumption and lactate production in Vhlfl/fl and Vhlfl/fldlckcre CD8+ T-lymphocytes 7 days after activation with αCD3 and αCD28 antibodies. n=4 mice per genotype from two independent experiments. c/ Immunoblot analysis for HIF-1α and LaminB1, using nuclear extracts prepared from Vhlfl/fl and Vhl-/- CD8+ T-lymphocytes cultured in 21% oxygen. d/ Rank of metabolite loadings in PC1 from PCA. e/ Immunoblot analysis for HIF-1α, HIF-2α and β-tubulin, on whole cell extracts prepared from RCC4 and 786-O renal cancer cell lines, with and without expression of functional VHL. f/ Deletion efficiency of Vhl in Vhlfl/fl MEFs following infection with Adeno-Cre virus, n=3 individual preparations. Accompanying immunoblot analysis for HIF-1α and β-tubulin, on whole cell extracts. Two-tailed t-test (b), one-way ANOVA for multiple comparisons (a). Error bars denote s.d. and each dot represents an individual mouse in a and b. *p<0.05, **p<0.01, ***p<0.001. For immunoblot source images, see Supplementary Fig. 1.
Extended Data Figure 2
Extended Data Figure 2. HIF-1α-dependent metabolic alterations underlie S-2HG production in CD8+ T-lymphocytes.
a/ Example calculation of intracellular 2HG concentration. b/ 1H-NMR analysis for 2HG from CD8+ T-lymphocytes cultured as in Fig. 2b. c/ Deletion efficiency of Hif1α or Hif2α in CD8+ T-lymphocytes, isolated from Hif1αfl/fldlckcre or Hif2αfl/fldlckcre mice. n=4 mice. d/ Total 2HG levels, normalized to viable cell count or protein content, in Hif1αfl/fl and Hif1αfl/fldlckcre CD8+ T-lymphocytes cultured as in Fig. 2b. n=4 mice per genotype. e/ Total 2HG levels, normalized to viable cells or protein content, in Hif2αfl/fl and Hif2αfl/fldlckcre CD8+ T-lymphocytes cultured as in Fig. 2b. n=4 mice per genotype. f/ Illustration outlining the workflow for metabolite extraction, deletion efficiency and viability experiments in Hif1αfl/fl, Hif1αfl/fldlckcre, Hif2αfl/fl and Hif2αfl/fldlckcre CD8+ T-lymphocytes. Also shown are viability measurements at day 4. n=4 mice per genotype. g/ Total amount of 2HG in Hif1αfl/fl (n=6) and Hif1αfl/fldlckcre (n=7) CD8+ T-lymphocytes, at indicated times following activation. n4 mice per time point. h/ Heat map indicating qPCR measurement of expression of enzymes involved in central carbon metabolism in CD8+ T-lymphocytes cultured as in Fig. 2b; n=4 mice per condition. i/ LC-MS/MS quantification of total intracellular succinate, fumarate and malate levels in CD8+ T-lymphocytes isolated from C57BL/6J mice and cultured as in Fig. 2b; n=7 mice. j/ Heat map indicating qPCR measurement, in Hif1αfl/fl (n=4) and Hif1αfl/fldlckcre (n=3) CD8+ T-lymphocytes growing in 1% oxygen, of expression of enzymes implicated in the hypoxic production of S-2HG. k/ qPCR validation of shRNA-knockdowns in CD8+ T-lymphocytes isolated from C57BL/6J mice. l/ LC-MS/MS quantification of S- and R-2HG in CD8+ T-lymphocytes isolated from C57BL/6J mice, with shRNA-mediated knockdown of Mdh1; n=4 pools of 4 mice per pool. m/ LC-MS/MS quantification of S- and R-2HG in CD8+ T-lymphocytes isolated from C57BL/6J mice, with shRNA-mediated knockdown of Mdh2; n=4 pools of 4 mice per pool. n/ LC-MS/MS quantification of R-2HG in CD8+ T-lymphocytes isolated from C57BL/6J mice, with shRNA-mediated knockdown of Ldha; n=4 pools of 4 mice per pool. o/ Validation of Pdk1-FLAG and Ldha-FLAG expression in Hif1αfl/fldlckcre CD8+ T-lymphocytes by immunoblot analysis for FLAG. p/ LC-MS/MS quantification of total intracellular glutamate levels in CD8+ T-lymphocytes cultured as in Fig. 2b; n=7 mice. q-r/ LC-MS/MS quantification of total intracellular glutamate levels in Hif1αfl/fl, Hif1αfl/fldlckcre, Hif2αfl/fl and Hif2αfl/fldlckcre CD8+ T-lymphocytes cultured as in Fig. 2b; n=4 mice per genotype. s/ Immunoblot of cytosolic fractions for phospho-PDH E1α (S232) and total PDH-E1α in CD8+ T-lymphocytes cultured in 1% oxygen in the presence of the indicated concentration of DCA for 48h. t/ Total intracellular concentration of 2HG in CD8+ T-lymphocytes from C57BL/6J mice cultured as in Fig. 2b and treated with 5mM DCA for the latter 48h of culture; n=4 mice. u/ Total intracellular amount of 2HG, nomralized to viable cell count or protein content in CD8+ T-lymphocytes from C57BL/6J mice cultured as in Fig. 2b and treated with 5mM DCA for the latter 48h of culture; n=4 mice. v/ Total intracellular amount of glutamate in CD8+ T-lymphocytes from C57BL/6J mice cultured as in Fig. 2b and treated with 5mM DCA for the latter 48h of culture; n=4 mice. Two-way ANOVA for grouped data (d, e, f, q, r, t, u, v). Paired t-test for matched comparisons (i, p), one-way ANOVA for multiple matched comparisons (g, l, m, n). Error bars denote s.d. and each dot represents an individual mouse in g, i and p. ns= non-significant, *p<0.05, **p<0.01, *** p<0.0001. Experiments were performed with indicated numbers of mice from multiple occasions. For immunoblot source images, see Supplementary Fig. 1.
Extended Data Figure 3
Extended Data Figure 3. Naïve and expanding primary CD8+ T-lymphocytes do not possess mutations in Idh1 or Idh2 that can explain the presence of high levels of 2HG.
a/ Illustration outlining the workflow for mutational analysis of Idh1 and Idh2 b/ Sanger sequencing chromatograms validating the presence of wild type Idh1 as compared to the C57BL/6J NCBI reference sequence. c/ Alignment of mouse and human IDH1 protein indicating conservation of active site arginine residues. d/ Sanger sequencing chromatograms validating the presence of wild type Idh2 as compared to the C57BL/6J NCBI reference sequence. e/ Alignment of mouse and human IDH2 protein indicating conservation of active site arginine residues.
Extended Data Figure 4
Extended Data Figure 4. Kinetics of 2HG labelling in 21% and 1% oxygen, by U-13C-glucose and U-13C-glutamine.
a/ Proposed mechanism by which HIF-1α controls S-2HG production in CD8+T-lymphocytes and 13C-labelling strategy using U-13C-glucose (m+6) and U-13C-glutamine (m+5) to label endogenous 2HG. Red and green represent pathways promoted and inhibited respectively by HIF-1α in hypoxia. b/ Isotopologue distribution of 2HG (as a percentage of the total pool) in CD8+ T-lymphocytes, after labelling with U-13C-glucose for 1, 5 and 24 h in both 21% and 1% oxygen conditions; n=3 mice per time point. Error bars denote s.d. c/ Isotopologue distribution of 2HG (as a percentage of the total pool) in CD8+ T-lymphocytes, after labelling with U-13C-glutamine for 1, 5 and 24 h in both 21% and 1% oxygen conditions; n=3 mice per time point. Error bars denote s.d.
Extended Data Figure 5
Extended Data Figure 5. S-2HG treatement promotes HIF-1α stability and alters the phenotypic and functional properties of CD8+ T-lymphocytes in a HIF-1α-independent manner.
a-b/ Immunoblot analysis of nuclear and cytosolic fractions, prepared from CD8+ T-lymphocytes cultured in (a) 21% and (b) 1% oxygen, for HIF-1α, HDAC1, phospho-PDH E1α (S232) and total PDH-E1α. Cells were activated for 48 h with αCD3+αCD28 antibodies and then expanded for a further 4 days in the presence of IL-2 followed by treatment with the indicated concentration of S-2HG for 16 hours. The arrow indicates HIF-1α protein. c/ Glucose consumption and lactate production of C57BL/6J, Hif1αfl/fl (n=12) and Hif1αfl/fldlckcre (n=4) CD8+ T-lymphocytes treated with or without 500 μM S-2HG-octyl ester for 16 hours as in Extended Data Fig. 5a. d/ VEGF-A production of wild type C57BL/6J, Hif1αfl/fl (n=16) and Hif1αfl/fldlckcre (n=4) CD8+ T-lymphocytes treated with or without 500 μM S-2HG-octyl ester for 16 hours as in Extended Data Fig. 5a. e/ Representative flow cytometry plots of IFN-γ vs TNF-α in SIINFEKL re-stimulated OT-I CD8+ T-lymphocytes, as a function of increasing doses of S-2HG-octyl ester for 7 days. Associated quantification and statistics are shown in the graphs below. f/ Specific killing of EG7-OVA cells by OT-I CD8+ T-lymphocytes. Total splenocytes were activated for 48 h with 1000 nM SIINFEKL and then expanded for a further 4 days in the presence of IL-2 followed by treatment with 500 μM S-2HG-octyl ester for 24 h. OT-I CD8+ T-lymphocytes were incubated with target and control cells for 4 hours; n=3 mice per condition. g/ CFSE dilution assay, with associated statistics (n=4 mice per condition) at day 3 of CD8+ T-lymphocytes activated with αCD3+αCD28 antibodies and cultured with or without 500 μM S-2HG-octyl ester from day 0. Data are representative of 4 mice. Associated quantification and statistics are shown in the graph on the right. h/ Viability and annexin V assay of CD8+ T-lymphocytes treated with increasing S-2HG doses for 4 days, n=4 mice. i/ Viability of CD8+ T-lymphocytes cultured with 300 μM S-2HG-octyl ester for the indicated number of days, n=4 mice. j/ Amount of IFN-γ protein in the media of wild type C57BL/6J, Hif1αfl/fl (n=8) and Hif1αfl/fl dlckcre (n=4) CD8+ T-lymphocytes treated for 24 h with or without 500 μM S-2HG-octyl ester. k/Viability of Hif1αfl/fl (n=8) and Hif1αfl/fl dlckcre (n=4) OT-I CD8+ T-lymphocytes activated with 1000 nM SIINFEKL peptide and cultured for 7 days with or without 500 μM S-2HG-octyl ester in the absence of IL-2 supplementation from day 0. l/ Expression of Ifng mRNA in CD8+ T-lymphocytes treated for either 24 h or 7 days with or without 500 μM S-2HG-octyl ester. n=4 mice per group. m/ CD44 and CD62L surface expression on OT-I CD8+ T-lymphocytes treated with increasing doses of S-2HG for 7 days. Cells were activated with 1000 nM SIINFEKL peptide; n=3 mice. Gated on live, CD8+ cells. n/ Illustration outlining the workflow for the experiment. Left panel: %CD62LHigh CD8+ T-lymphocytes, treated for 7 days with 500 μM S-2HG-octyl ester, followed by washout or maintenance of the compound and follow up every 3rd day, for 9 more days; n=4 mice. Right panel: %CD62LHigh CD8+ T-lymphocytes, treated for 7 days with vehicle, followed by addition of 500 μM S-2HG-octyl ester or vehicle and follow up every 3rd day, for 9 more days; n=4 mice. Gated on live, CD8+ cells. o/ CD44 and CD62L surface expression on Hif1αfl/fl and Hif1αfl/fl dlckcre CD8+ T-lymphocytes treated with or without 500 μM S-2HG-octyl ester for 1, 7 and 10 days following treatment. Data are representative of 3 mice per genotype. Gated on live, CD8+ cells. p/ CD44 and CD62L surface expression on Hif2αfl/fl and Hif2αfl/fl dlckcre CD8+ T-lymphocytes treated with or without 500 μM S-2HG-octyl ester for 1, 7 and 10 days following treatment. Data are representative of 2 mice per genotype. Gated on live, CD8+ cells. q/ Flow cytometric characterisation of indicated phenotypic markers on Hif1αfl/fl (n=4) and Hif1αfl/fl dlckcre (n=4) CD8+ T-lymphocytes treated for 7 days with 500 μM S-2HG-octyl ester. Gated on live CD8+ cells. r/ Validation of L2hgdh-FLAG expression in CD8+ T-lymphocytes from C57BL/6J mice by immunoblot analysis for FLAG. The arrow indicates L2hgdh-FLAG protein. s/ qPCR validation of L2hgdh knockdowns in CD8+ T-lymphocytes isolated from C57BL/6J mice. t/ CD127 surface expression in response to L2hgdh knockdown (n=4). Representative flow cytometry histogram of CD127 surface levels on transduced (GFP+) CD8+ T-lymphocytes in response to shScramble or shL2hgdh #3 in 21% or 1% oxygen is shown on the right. u/qPCR quantification of Prdm1, Sell, Eomes, Tcf7, Bcl6 and Ccr6 expression in CD8+ T-lymphocytes treated for 1 or 7 days with or without 500 μM S-2HG-octyl ester . Paired t-test for matched comparisons (g) and two-way ANOVA for grouped data (c, d, j, k, l, q). One-way ANOVA for multiple comparisons (i, n, t). Error bars denote s.d. and each dot in c, d, g, j, k, l, q, t represents an individual mouse. ns=non-significant, *p<0.05, **p<0.01, ***p<0.001. gMFI=geometric mean fluorescence intensity. Experiments were performed with indicated numbers of mice from multiple occasions. For immunoblot source images, see Supplementary Fig. 1.
Extended Data Figure 6
Extended Data Figure 6. Ex vivo treatment of CD8+ T-lymphocytes with S-2HG promotes in vivo homeostatic proliferation and recall of adoptively transferred cells.
a/ Diagram outlining the homeostatic proliferation experiments in Figure 4a-c. Representative flow cytometry plots are shown for each pool before and after adoptive transfer. Flow cytometry plots show viable CD8+ cells. b/Diagram outlining the recall experiments in Figure 4f. c/ Representative flow cytometry plots of recalling CD45.1+ CD8+ T-lymphocytes in indicated organs on day 7 post vaccination (day 37 post transfer).
Extended Data Figure 7
Extended Data Figure 7. S-2HG does not inhibit mTOR signalling at the doses necessary for the formation of memory-like CD8+ T-lymphocytes.
Immunoblot analysis on cytosolic extracts for mTOR signalling in CD8+ T-lymphocytes treated with the indicated doses of S-2HG for 24 h. For immunoblot source images, see Supplementary Fig. 1.
Extended Data Figure 8
Extended Data Figure 8. S-2HG does not induce Bcl-2 or Bcl-xl that can explain the in vivo persistence of adoptively transferred CD8+ T-lymphocytes.
a/qPCR quantification of Bcl2 and Bclxl mRNA levels in response to 500 μM S-2HG-octyl ester treatment for either 1 or 7 days. n=4 mice b/Immunnoblot analysis for Bcl-2 and Bcl-xl protein in response to increasing doses of S-2HG-octyl ester for 9 days. c/qPCR quantification of Bcl2 and Bclxl mRNA levels in response to 300 μM S-2HG-octyl ester treatment for either 1, 7 or 9 days. n=4 mice d/Representative flow cytometry histograms of Bcl-2 and Bcl-xl abundance in CD8+ T-lymphocytes treated with 300 μM S-2HG-octyl ester for 9 days. Quantification and associated statistics are shown in the graph on the right. n=3 mice. e/Immunoblot analysis confirming the expression of Bcl-xl-FLAG and Bcl-2-FLAG in OT-I in CD8+ T-lymphocytes. f-h/CD62L (f), CD127 (g) and CD44 (h) surface expression in OT-I CD8+ T-lymphocytes transduced with retrovirus expressing either Bcl-2-FLAG or Bcl-xl-FLAG and treated with the indicated concentration of S-2HG-octyl ester for 7 days. n=2 mice i/ Representative flow cytometry histograms of CD62L, CD127 and CD44 surface expression in OT-I CD8+ T-lymphocytes transduced with retrovirus expressing either Bcl-2-FLAG or Bcl-xl-FLAG and treated with the indicated concentration of S-2HG-octyl ester for 7 days. The associated statistics of these flow cytometry data are shown in f, g and h. **P<0.01, ns= non-significant. Paired t-test for matched comparisons (d) and two-way ANOVA for grouped data (a, b). One-way ANOVA of matched samples for multiple comparisons (c, f, g, h). Error bars denote s.d. and each dot in a and c represents an individual mouse. ns=non-significant, **p<0.01, gMFI=geometric mean fluorescence intensity. Experiments were performed with indicated numbers of mice from at least two occasions. For immunoblot source images, see Supplementary Fig. 1.
Extended Data Figure 9
Extended Data Figure 9. S-2HG induces global histione H3 methylation changes in CD8+ T-lymphocytes.
a/ Immunoblot analysis on nuclear extracts for histone H3 methylation marks in activated CD8+ T-lymphocytes treated with the indicated doses of S-2HG for 7 days. b/Representative flow cytometry histograms of H3K27me3 staining as a function of increasing S-2HG-octyl ester concentration. c/ H3K27me3 staining in CD8+ T-lymphocytes treated with or without 500 μM S-2HG-octyl ester and stained with or without fluorophore conjugated C36B11 antibody. d/ qPCR measurement for expression of Utx in unstimulated and stimulated CD8+ T-lymphocytes; n=4 mice. Expression for Utx is displayed for each mouse individually. e/ Represetative flow cytomery plots of CD44 vs CD62L expression, with associated statistics, on activated CD8+ T-lymphocytes after 4 days of treatment with 500 μM S-2HG-octyl ester or 1 µM GSKJ4. Gated on live, CD8+ cells. n=3 mice. f/ Representative flow cytometry plots of CD44 vs CD62L expression on CD8+ T-lymphocytes with shRNA-mediated knockdown of Utx, 7 days after trasnduction. Gated on live, CD8+GFP+ cells. Graph on right shows knockdown hairpin fidelity for Utx. g/ IgG control ChIP-qPCR for H3K4me3, H3K27me and RNA pol II at and around the TSS for CD62L, in freshly isolated naïve or activated CD8+ T-lymphocytes treated with or without 500 μM S-2HG-octyl ester for 7 days. Each profile shows the fold change over the non-binding control primer. Each dot represents an individual primer pair. A pool of n=6 mice was used for each condition. Error bars denote s.e.m. One-way ANOVA for multiple matched comparisons (e). Each dot in c represents an individual mouse. Error bars denote s.d. **p<0.01. Experiments were performed with indicated numbers of mice from at least two occasions. For immunoblot source images, see Supplementary Fig. 1.
Extended Data Figure 10
Extended Data Figure 10. S-2HG induces global changes in the content of 5hmC and 5mC in genomic DNA of CD8+ T-lymphocyte genomic DNA.
a/ Representative flow cytometry plots of CD44 vs CD6L expression on CD8+ T-lymphocytes with shRNA-mediated knockdown of Tet2, 7 days after trasnduction. Gated on live, CD8+GFP+ cells. Graph on right shows knockdown hairpin fidelity for Tet2. b/ IgG control DIP-qPCR for 5mC and 5hmC at and around the TSS for CD62L, in freshly isolated naïve or activated CD8+ T-lymphocytes treated with or without 500 μM S-2HG for 7 days. Each profile shows the fold change over the non-binding control primer. Each dot represents an individual primer pair. A pool of n=6 mice was used for each condition. Error bars denote s.e.m.
Figure 1
Figure 1. VHL-HIF signalling regulates 2-hydroxyglutarate levels
a/ Unsupervised hierarchical clustering and heat map of all detected metabolites. b/ PCA of metabolomes. Percentage variance of each PC is in parenthesis. c/ Metabolites ranked in order of decreasing p-value . d/ 2HG levels in Vhlfl/fl (n=7), Vhlfl/fldlckcre (n=4) and Hif1αfl/fl Vhlfl/fldlckcre (n=4) CD8+ T-lymphocytes activated with αCD3 and αCD28 antibodies and then cultured in IL-2 for a further 5 days. Each dot represents a mouse. e/ 2HG levels in RCC4 and 786-O cells with reconstitution of VHL; n=3. f/ 2HG levels in MEFs with deletion of VHL; n=3. Unpaired t-test (e-f) and one-way ANOVA (d). Error bars denote s.d.; ns = non-significant, *p<0.05, **p<0.01, ***p<0.001.
Figure 2
Figure 2. Hypoxic induction of 2-hydroxyglutarate depends on HIF-1α in CD8+ T-lymphocytes
a/ 2HG in naïve and activated cells, n4 mice per time point. b/ 2HG in cells cultured at 21% or 1% oxygen 48 h; n=12 mice. c/ 2HG in cells cultured at 21% (n=15), 10% (n=6), 5% (n=10) or 1% (n=6) oxygen for 48 h. d/ Enantioselective MS for S- and R-2HG. e/ 2HG in human cells( n=4 healthy donors). f/ Enantioselective MS for S- and R-2HG from cells in e. g-h/ 2HG in Hif1αfl/fl and Hif1αfl/fl dlckcre (g) or Hif2αfl/fl and Hif2αfl/fl dlckcre (h) cells, cultured as in b; n=4 mice per genotype. i/ 2HG in splenic extracts from Hif1αfl/fl (n=20) and Hif1αfl/fl dlckcre (n=15) mice. j/ 2HG in urine from Hif1αfl/fl (n=49) and Hif1αfl/fl dlckcre (n=25) mice. k/. S-2HG in cells with shLdha. n=4 individual transductions. l/ Ldha-FLAG (n=6) or Pdk1-FLAG (n=4) over-expression in Hif1αfl/fl dlckcre cells. The dotted line represents S-2HG levels in Hif1αfl/fl cells n=4/6 individual tranductions. m/ 13C-isotopologue profile of 2HG in cells cultured as in b ; n=7 mice per condition. Unpaired t-test ( i, j). Paired t-test (b, l, m). One-way ANOVA (c, k) and two-way ANOVA (g, h). Error bars denote s.d.; each dot in a, b, c, i and j represents a. ns = non-significant, *p<0.05, **p<0.01, ***p<0.001.
Figure 3
Figure 3. S-2HG alters phenotypic marker expression of CD8+ T-lymphocytes
a/ Media IL-2 levels from S-2HG-treated cells. b/ Expression of Il2 mRNA in S-2HG-treated cells. c/ CD62L and CD127 expression on from S-2HG-treated OT-I cellsn=4 mice. d/ % CD62LHighCD44Low and % CD62LLowCD44High cells with S-2HG treatment. n=4 mice. e/CD62L expression on cells treated with S-2HG and transduced with empty or L2hgdh-FLAG over-epression vectors. f/ Representative flow cytommetry plots of KLRG1 vs CD127 (n=4) on cells from e. Associated statistics are shown. g/ S-2HG level in response to shRNA against L2hgdh (n=4). h/ CD62L expression in response to L2hgdh knockdown (n=4). Representative flow cytometry histogram of CD62L surface levels is shown on the right. Two-way ANOVA (a, b, e, f). One-way ANOVA (c, d, g, h). Error bars denote s.d. .Each dot in a, b, e, f, h, represents a mouse. ns=non-significant, *p<0.05, **p<0.01, ***p<0.001. gMFI=geometric mean fluorescence intensity.
Figure 4
Figure 4. S-2HG treatment promotes in vivo homeostatic renewal, persistence and anti-tumour capacity of transferred cells
a/ Recovery of co-transferred CD45.1+ OT-I cells, from spleens (n=6). b/In vivo CFSE levels in cells from a. c/ % of cells in a that divided 0-9 times in vivo. d/ Representative flow cytometry plots and associated statistics of recovered cells from spleens (n=6). e/ Representative analysis of cells, in d, relative to naïve cells (n=6). f/ Recovery of co-transferred cells, from spleens, lymphnodes and livers of vaccinated mice (n=6). g/ Lymphodepleted mice bearing EG7-OVA tumours treated with no T-cells (n=7) or OT-I cells cultured with (n=6) or without (n=6) S-2HG. Error bars denote s.e.m. h/ Lymphoreplete mice bearing EG7-OVA tumours treated with no T-cells (n=6) or OT-I cells cultured with (n=6) or without (n=6) S-2HG. Error bars denote s.e.m. Paired t-test (a, b, f), unpaired t-test (d), one-way ANOVA (g, h). Error bars denote s.d. (not in g and h). Each dot in a, b, d and f represents a mouse. ns=non-significant, *p<0.05, **p<0.01, ***p<0.001. gMFI=geometric mean fluorescence intensity.
Figure 5
Figure 5. S-2HG alters global H3K27me3 in CD8+ T-lymphocytes
a/Immunoblot analysis for H3K27me2 and H3K27me3 in cells treated with S-2HG. b/ H3K27me3 in OT-I cells treated with S-2HG. n=6 mice. c/ H3K27me3 abundance in Hif1αfl/fl (n=4) and Hif1αfl/fl dlckcre (n=4) cells treated with S-2HG. d/ CD62L expression by cells with shUtx #3. e/In vivo H3K27me3 levels in CD8+ populations. n=6 mice. f/ ChIP-qPCR for H3K4me3, H3K27me and RNA pol II around the TSS for CD62L. A pool of n=6 mice was used. Error bars denote s.e.m. One-way ANOVA (b, c). Error bars denote s.d. and each dot in c and e represents a mouse. ns=non-significant, *p<0.05, **p<0.01, ***p<0.001. gMFI=geometric mean fluorescence intensity. For immunoblot source images, see Supplementary Fig. 1.
Figure 6
Figure 6. S-2HG alters global 5hmC and 5mC in DNA of CD8+ T-lymphocytes
a/ 5hmC and 5mC in gDNA. n=4 mice. b/ 5hmC in gDNA from cells treated with S-2HG. n=4 mice. c/ 5mC in gDNA from cells treated with S-2HG-. n=4 mice. d/ CD62L expression on CD8+ T-lymphocytes 7 days after transduction with shTet2 #3. e/ DIP-qPCR for 5mC and 5hmC around the TSS for CD62L. A pool of n=6 mice was used. Error bars denote s.e.m. One-way ANOVA (b and c). Error bars denote s.d. and each dot in b and c represents a mouse. ns= non-significant, *p<0.05, ***p<0.001. gMFI=geometric mean fluorescence intensity.

Comment in

References

    1. Ho PC, et al. Phosphoenolpyruvate Is a Metabolic Checkpoint of Anti-tumor T Cell Responses. Cell. 2015;162:1217–1228. doi: 10.1016/j.cell.2015.08.012. - DOI - PMC - PubMed
    1. Chang CH, et al. Posttranscriptional control of T cell effector function by aerobic glycolysis. Cell. 2013;153:1239–1251. doi: 10.1016/j.cell.2013.05.016. - DOI - PMC - PubMed
    1. Chang CH, et al. Metabolic Competition in the Tumor Microenvironment Is a Driver of Cancer Progression. Cell. 2015;162:1229–1241. doi: 10.1016/j.cell.2015.08.016. - DOI - PMC - PubMed
    1. Oestreich KJ, et al. Bcl-6 directly represses the gene program of the glycolysis pathway. Nat Immunol. 2014;15:957–964. doi: 10.1038/ni.2985. - DOI - PMC - PubMed
    1. MacIver NJ, Michalek RD, Rathmell JC. Metabolic regulation of T lymphocytes. Annual review of immunology. 2013;31:259–283. doi: 10.1146/annurev-immunol-032712-095956. - DOI - PMC - PubMed

Publication types

MeSH terms