. 2016 Dec;18(12):1346-1356.
doi: 10.1038/ncb3434. Epub 2016 Oct 31.

Lgr6 labels a rare population of mammary gland progenitor cells that are able to originate luminal mammary tumours

Affiliations

Lgr6 labels a rare population of mammary gland progenitor cells that are able to originate luminal mammary tumours

Leander Blaas et al. Nat Cell Biol. 2016 Dec.

Abstract

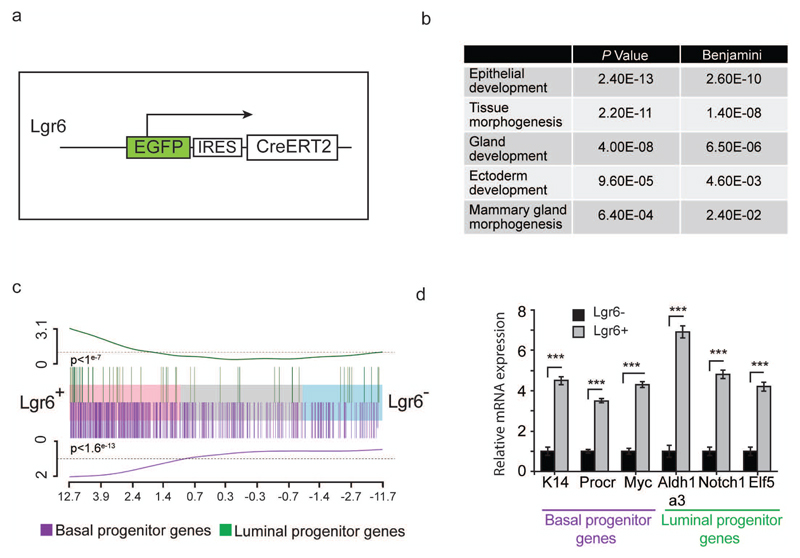
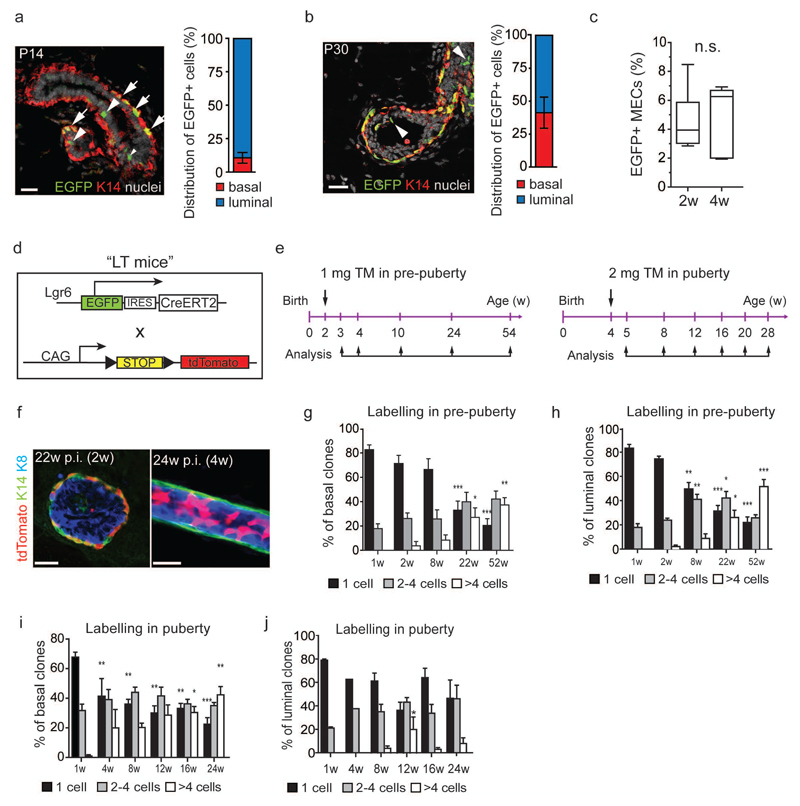
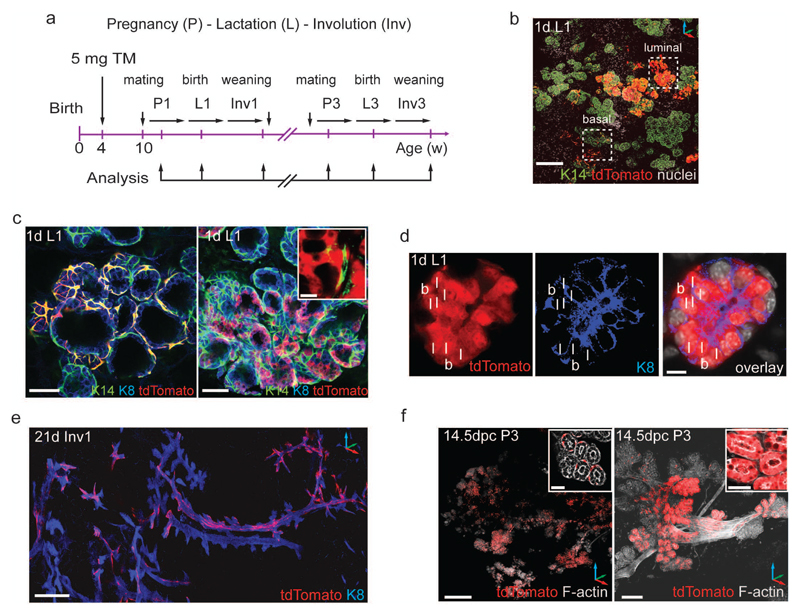
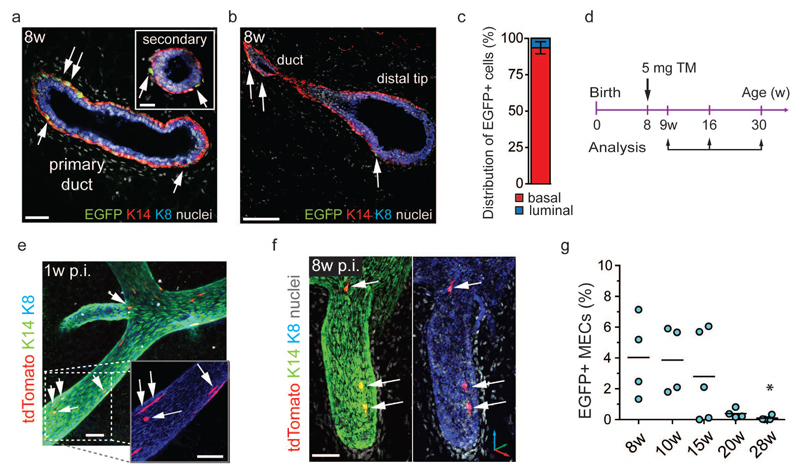
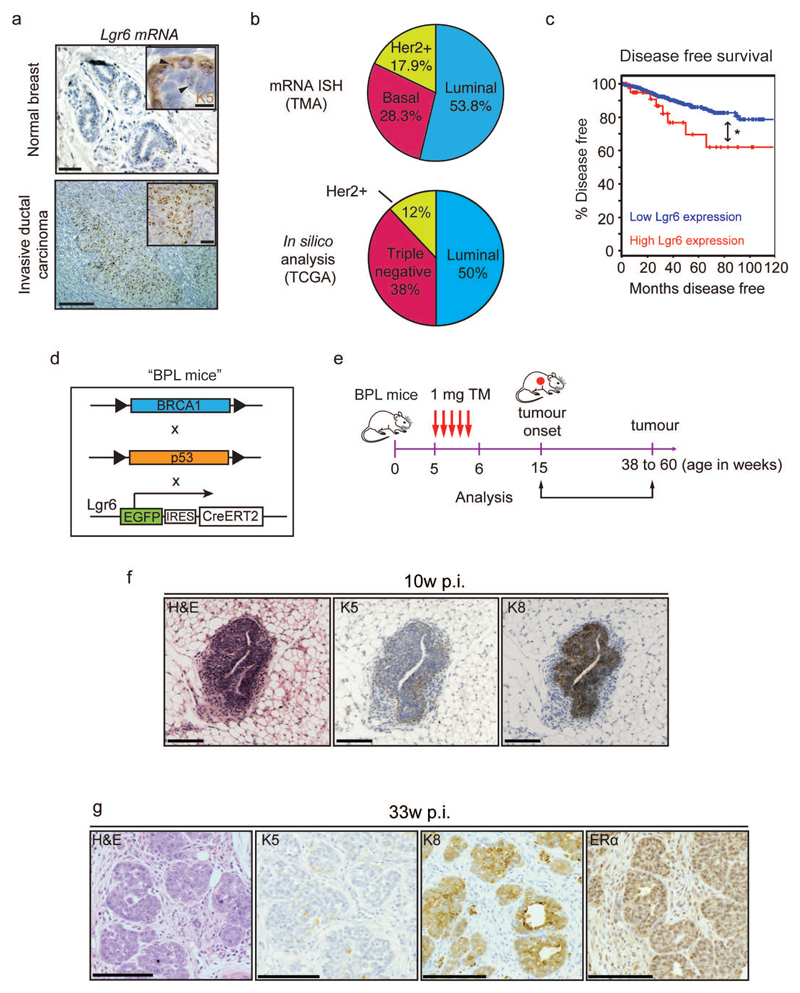
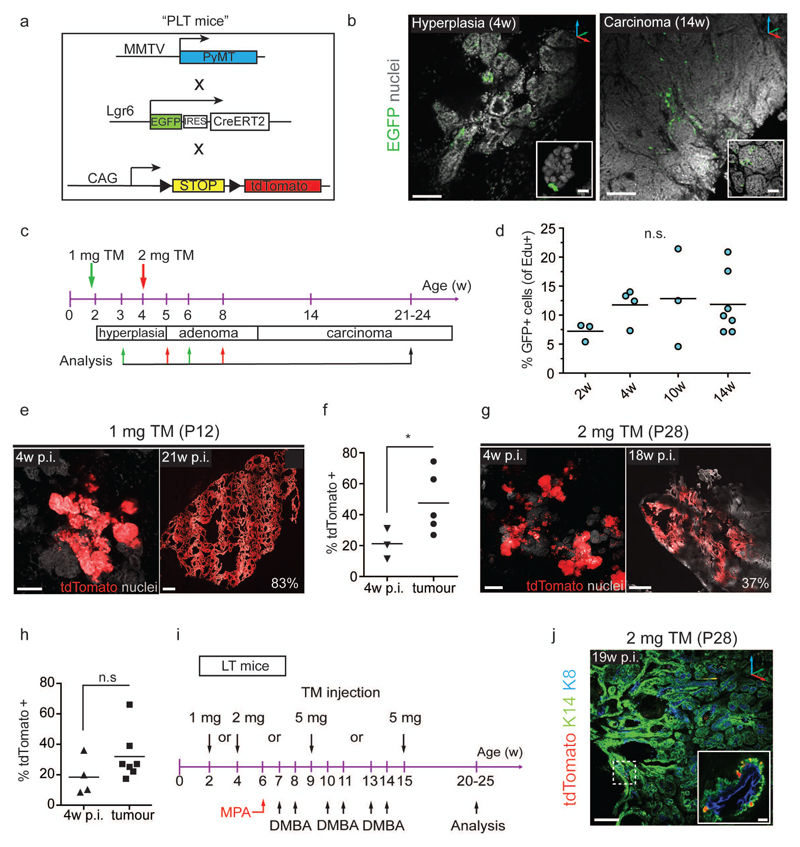
The mammary gland is composed of a complex cellular hierarchy with unusual postnatal plasticity. The identities of stem/progenitor cell populations, as well as tumour-initiating cells that give rise to breast cancer, are incompletely understood. Here we show that Lgr6 marks rare populations of cells in both basal and luminal mammary gland compartments in mice. Lineage tracing analysis showed that Lgr6+ cells are unipotent progenitors, which expand clonally during puberty but diminish in adulthood. In pregnancy or following stimulation with ovarian hormones, adult Lgr6+ cells regained proliferative potency and their progeny formed alveoli over repeated pregnancies. Oncogenic mutations in Lgr6+ cells resulted in expansion of luminal cells, culminating in mammary gland tumours. Conversely, depletion of Lgr6+ cells in the MMTV-PyMT model of mammary tumorigenesis significantly impaired tumour growth. Thus, Lgr6 marks mammary gland progenitor cells that can initiate tumours, and cells of luminal breast tumours required for efficient tumour maintenance.


Conflict of interest statement

Competing financial interests

The authors declare no competing financial interests.

Figures

Figure 1
Figure 1
Lgr6+ mammary gland cells show gene expression patterns of basal and luminal mammary gland progenitor cells. (a) Description of the Lgr6-CreERT2 allele used for detection and isolation of Lgr6+ mammary gland cells. EGFP: enhanced green fluorescent protein; IRES: internal ribosomal entry site; CreERT2: tamoxifen-inducible Cre recombinase. (b) Table illustrating examples of the gene sets enriched in the Lgr6+ MEC population according to RNA-seq. P values and Benjamini-Hochberg adjusted P-values for difference in enrichment score are shown. (c) Gene enrichment analysis for basal (purple) and luminal (green) progenitor genes in Lgr6+ and Lgr6- cells, showing the fold changes of all genes sequenced in the RNA-Seq experiment running from high on the left (Lgr6+), to low on the right (Lgr6-). The up-regulated basal (purple) or luminal (green) genes from the reported published gene lists are highlighted by the vertical lines. The line at the top and bottom of the barcode shows a cumulative enrichment of each set of genes. (n = 6 mice pooled per replicate). P = 1*10-7 (luminal progenitor), P = 1.58*10-13 (basal progenitor) (by Wilcoxon two-sided gene set test) (d) Q-PCR analysis of mRNA expression between Lgr6+ and Lgr6 -cells (normalized to GAPDH) for genes characteristic of basal and luminal progenitor cells respectively (n = 3 mice). Mean ± s.d., ***P.< 0.001 (t-test). See Supplementary Table 2 for exact p values and source data.
Figure 2
Figure 2
Two independent Lgr6+ progenitor cell populations contribute to postnatal mammary gland development. (a, b) Confocal images of Lgr6-CreERT2+/- mammary glands at postnatal day 14 (P14) (a) and P30 (b). EGFP+ cells are found in K14+ basal (arrows) and K14- luminal cells (arrowheads). Scale bars: 25 µm. Bar graphs visualise the distribution of EGFP+ cells with respect to mammary epithelial cells (MECs) in (a) 2w-old (n=7 mice pooled from 2 independent experiments) and (b) 4w-old (n=10 mice pooled from 3 independent experiments) Lgr6-CreERT2+/- females as measured by flow cytometry. Mean ± s.e.m. (c) Box-and-whiskers plot showing the frequency of EGFP+ MECs in Lgr6-CreERT2+/- females at 2w and 4w of age (n=7 and n=10 mice pooled from 2 and 3 experiments, respectively). Minima, maxima, median are indicated. n.s., not significant; P = 0.673 (unpaired two-tailed t-test). (d) Lgr6-CreERT2 and Rosa26-tdTomato alleles (“LT mice”) used for lineage tracing. EGFP: enhanced green fluorescent protein; IRES: internal ribosomal entry site; CreERT2: tamoxifen-inducible Cre recombinase; CAG: constitutively active hybrid promoter from cytomegalovirus and chicken ß-actin promoters; STOP: stop cassette flanked by 2 loxP sites (black triangles); tdTomato: tandem dimer tomato red fluorescent protein. (e) Lineage tracing strategy in pre-puberty and puberty. TM, tamoxifen. (f) K14/K8 immunostaining of LT mammary glands 22w post induction (p.i). in pre-puberty (left panel) and 24w p.i. in puberty (right panel). tdTomato+ clones are found in the basal and luminal compartments. Scale bars: 20µm. (g - j) Quantification of tdTomato+ basal (g, i) and luminal (h, j) clone sizes at different time-points post induction. Graphs show the percentage of counted tdTomato+ clones containing 1, 2–4, and >4 cells at each time-point. (Number of analysed clones pooled from n = 3 mice per timepoint: n = 1157, n = 344, n = 542, n = 645, n = 691, respectively, for (g, h); n = 531, n = 1476, n = 1733, n = 163, n = 782, n = 597, respectively, for (i, j). Mean ± s.e.m. *P < 0.05; **P < 0.01; ***P < 0.001 (One-way ANOVA). See Supplementary Table 2 for source data for g – j.
Figure 3
Figure 3
Basal and luminal Lgr6+ cells found in puberty are long-lived, lineage-restricted stem cells that contribute clonally to consecutive pregnancies. (a) Scheme illustrating induction of lineage tracing in puberty with analysis in pregnancy (P), lactation (L), and involution (Inv). (b) Confocal z-stack image showing K14 immunostaining of lineage-traced mammary gland on the first day of the first lactation (1d L1). Dashed squares depict basal or luminal tdTomato+ labelled alveolar structures. Scale bar: 100 µm. (c) Alveoli in lactating mammary glands from LT females induced at 4w of age contain multicellular, K14+/tdTomato+ basal clones (left panel) and K8+tdTomato+ luminal clones (right panel). Inset depicts luminal tdTomato+ cells not associated with basal K14+ cells. Scale bars: 50 µm, 10 µm (inset). (d) Confocal image of K8 immunostaining demonstrating alveolus with adjacent basal (b) and luminal (l) tdTomato+ cells. Scale bar: 10 µm. (e) Confocal z-stack image showing K8 immunostaining of lineage traced mammary gland at 21d of involution (21d Inv1). Scale bar: 100 µm. (f) 3D reconstructions of F-actin-stained whole mount mammary glands from Lgr6-CreERT2+/-:Rosa26-tdTomato+/- females at 14.5 dpc of third pregnancy (14.5 dpc P3). Extensive networks of basal (left panel) and luminal (right panel) tdTomato+ clones are sustained over multiple pregnancies. Scale bars: 500 µm (left panel), 50 µm (right panel), 25 µm (insets).
Figure 4
Figure 4
Lgr6+ progenitors contribute minimally to adult mammary gland homeostasis and are continuously lost over time. (a, b) Confocal image of a mammary gland thick section from 8w old LT virgin stained for K14 and K8. K14+/EGFP+ basal cells (arrows) are found in primary and secondary ducts (a) and in the distal tips of the mammary ducts (b). Scale bars: (a) 50 µm, 20 µm (inset), (b) 50µm. (c) Bar graph showing the distribution of EGFP+ cells over the total MEC population (n = 6 mice pooled from 2 independent experiments). Mean ± s.e.m. (d) Time-points of tamoxifen administration and analysis to trace Lgr6+ cells during tissue homeostasis. (e, f) Confocal reconstructions of K8/K14 immunostained mammary gland ducts from LT female 1w (e) and 8w (f) post-induction. Arrows indicate K14+/tdTomato+ single cells and bi-cellular clones. Scale bars: 50 µm (e), 50 µm (f). (g) Percentage of EGFP+ MECs in Lgr6-CreERT2+/- females from 8w to 28w of age (n = 4, n = 4, n = 5, n = 4, and n = 4 mice, pooled from 2 independent experiments for 8w, 10w, and 1 experiment for 15w, 20w, 28w). Lines indicate mean. *P = 0.0106 (One-way ANOVA). See Supplementary Table 2 for source data.
Figure 5
Figure 5
Mostly quiescent Lgr6-expressing cells can be reactivated by pregnancy or hormone treatment. (a) Scheme illustrating induction of lineage tracing in 8w-old LT females and analysis over pregnancy. Pregnancy (P); lactation (L); involution (Inv). (b, c) 3D reconstructions of K14/K8 immunostained mammary gland from LT female at 14.5 dpc P1. Scale bars: 50 µm (b), 40 µm (c). (d) Quantification of alveoli containing basal and luminal tdTomato+ cells when traced into the first lactation (lact.) after tamoxifen administration to LT females at 8w of age. (1316 counted alveoli pooled from 3 mice:). (e) 3D reconstruction of mammary duct from LT female 3w p.i. and 2w post-implantation of 17 β -estradiol and progesterone (E/P) pellets. Expansion of luminal tdTomato+ clones (arrows). Scale bar: 50 µm. (f) Distribution of tdTomato+ cells over MECs 2w post-treatment with 17 β-estradiol (E, n = 3 mice) and 17β-estradiol/progesterone (E/P, n = 4 mice), compared to tamoxifen-treated control (C) mice (n = 3 mice). Mean ± s.e.m. *P < 0.038 (One-way ANOVA). (g) Lgr6+ luminal cells in mammary duct of P56 Lgr6-CreERT2+/- female staining positive for oestrogen receptor-α (ERα) (arrows). Scale bar: 25 µm. See Supplementary Table 2 for source data for f.
Figure 6
Figure 6
Lgr6+ cells are present in human breast carcinoma and are able to initiate tumours in mouse models of breast cancer. (a) In situ hybridisation (ISH) analysis of Lgr6 mRNA expression on human breast carcinoma tissue microarrays (TMA) compared to normal healthy breast tissue. Keratin 5 (K5) co-staining demonstrates the presence of basal and luminal Lgr6+ mammary gland cells (inset, upper panel). Scale bars: 100µm, 20µm (insets) (b) Prevalence of Lgr6 expression or up-regulation within the three categories of human breast tumours as determined by ISH on tissue microarrays (n = 550 tumours; upper pie chart) and in silico analysis of breast cancer gene expression data available from The Cancer Genome Atlas (TCGA; lower pie chart) (cBioportal, RNASeq, and ref. (c) Disease free survival in n = 1093 patients with Lgr6 up-regulation compared to control patients (cBioportal, RNASeq, and ref 59). *P = 0.042 (log-rank test). (d) Description of the BPL mouse strain, derived from breeding of BRCA1f/f, p53f/f, and Lgr6-CreERT2 mice. (e) Treatment schedule of 5w-old BPL mice with tamoxifen and subsequent tumour analysis. (f) Immunohistochemistry of tumours from BPL mice 10 weeks post-injection with tamoxifen, stained with haematoxylin-eosin (HE) and probed for markers against basal (K5+) and luminal (K8+) cells. Scale bars: 100µm. (g) Immunohistochemistry of tumours from BPL mice 33 weeks post-injection stained with HE and probed for K5, K8 and ERα. Scale bars: 100 µm.
Figure 7
Figure 7
Lgr6+ cells contribute to luminal, but not basal, mammary tumours (a) Description of MMTV-PyMT, Lgr6-CreERT2, and Rosa26-tdTomato alleles (“PLT mice”) for detection and lineage tracing of Lgr6+ cells and induction of mammary tumours. MMTV: murine mammary tumour virus promoter; PyMT: polyoma virus middle T oncogene. (b) Representative confocal z-stack images showing rare EGFP+ mammary gland cells in PL females. Left: Hyperplastic mammary gland of 4w-old female. Scale bars: 100 µm; 25 µm (inset). Right: Mammary carcinoma of 14w-old female. Scale bars: 100 µm; 50 µm (inset). (c) Scheme illustrating tamoxifen administration in pre-puberty (green arrows) and puberty (red arrows) and analysis time-points to assess the contribution of Lgr6+ cells to MMTV-PyMT-induced mammary tumours. (d) Frequency of EdU+ cells with respect to EGFP+ cells in mammary glands of PL females of different ages. Lines indicate means. (n = 4 mammary glands pooled from n = 3 mice/time-point). Mean ± s.e.m.; n.s., not significant; P = 0.542 (One-way ANOVA). (e) Confocal z-stack images demonstrating expansion of tdTomato+ clones over time after induction at P12. Scale bars: 100 µm (left), 500 µm (right). Percentage indicates extent of tdTomato-labelled tumour area. (f) Quantification of tdTomato+ mammary gland area or tumour area 4w p.i. at P12 (n = 3 mice) and at carcinoma stage (21w – 24w, n = 5 mice). Lines indicate means. *P < 0.048. (unpaired two-tailed t-test) (g) Confocal z-stack images demonstrating expansion of tdTomato+ clones over time after induction at P28. Scale bars: 100 µm (left), 500 µm (right). (h) Quantification of tdTomato+ mammary gland area or tumour area 4w p.i. at P28 (n = 4 mice) and at carcinoma stage (21w – 24w, n = 7 mice). Lines indicate mean. n.s., not significant; p = 0.166 (unpaired two-tailed t-test). (i) Scheme summarizing the protocol used to study the contribution of Lgr6+ cells to MPA/DMBA induced carcinogenesis. MPA: Medroxyprogesterone acetate; DMBA: 7,12-Dimethylbenz[a]anthracene. (j) 3D reconstruction of K14/K8 immunostaining of MPA/DMBA mammary tumour from LT female induced at 4w. Only sporadic K14+/tdTomato+ cells are observed (dashed box and inset). Scale bars: 200 µm, 10 µm (inset). See Supplementary Table 2 for source data for d, f, h.
Figure 8
Figure 8
Lgr6+ cells contribute to tumour maintenance and show enhanced chemotherapy resistance in the MMTV-PyMT model of breast carcinoma. (a) Description of PDL mice derived from crossing of the MMTV-PyMT, Rosa26-LSL-DTR, and Lgr6-CreERT2 strains. (b) Scheme of PDL mouse treatment with tamoxifen and DT. (c) Immunohistochemistry of mammary tumours from PD and PDL mice treated with tamoxifen and diphtheria toxin (DT), and stained with haematoxylin-eosin (HE) and probed for EGFP and the proliferation marker ki67. Scale bars: 100µm. (d) Quantification of EGFP+ and ki67+ cells from PL and PDL mammary tumours. (n = 300 cells pooled from 10 different fields in 5 biological replicates). Mean ± s.d. *P < 0.05; **P < 0.01; ***P < 0.001 (t-test). (e) Analysis of tumour onset in PDL and PL mice after tamoxifen and DT treatment (n = 6 mice per group). The line indicates the mean. *P = 0.048 (f) HE staining on tumours from PDL and PL mice after tamoxifen and DT treatment. Scale bars: 500µm (1x), 50µm (40x). (g) Scheme of treatment to assess the role of Lgr6+ cells in subcutaneous tumour xenografts. (h) Analysis of tumour size 5 weeks post-transplantation (n = 5 mice per group). The line indicates the mean. *P = 0.0401. See Supplementary Table 2 for source data for e, h.

References

    1. Macias H, Hinck L. Mammary gland development. Wiley Interdiscip Rev Dev Biol. 2012;1:533–557. - PMC - PubMed
    1. Inman JL, Robertson C, Mott JD, Bissell MJ. Mammary gland development: cell fate specification, stem cells and the microenvironment. Development. 2015;142:1028–1042. - PubMed
    1. Rios AC, Fu NY, Lindeman GJ, Visvader JE. In situ identification of bipotent stem cells in the mammary gland. Nature. 2014;506:322–327. - PubMed
    1. Wang D, et al. Identification of multipotent mammary stem cells by protein C receptor expression. Nature. 2015;517:81–84. - PubMed
    1. van Amerongen R, Bowman AN, Nusse R. Developmental stage and time dictate the fate of Wnt/beta-catenin-responsive stem cells in the mammary gland. Cell Stem Cell. 2012;11:387–400. - PubMed

MeSH terms