. 2016 Dec;13(12):1036-1042.
doi: 10.1038/nmeth.4038. Epub 2016 Oct 31.

Directed evolution using dCas9-targeted somatic hypermutation in mammalian cells

Affiliations

Directed evolution using dCas9-targeted somatic hypermutation in mammalian cells

Gaelen T Hess et al. Nat Methods. 2016 Dec.

Abstract

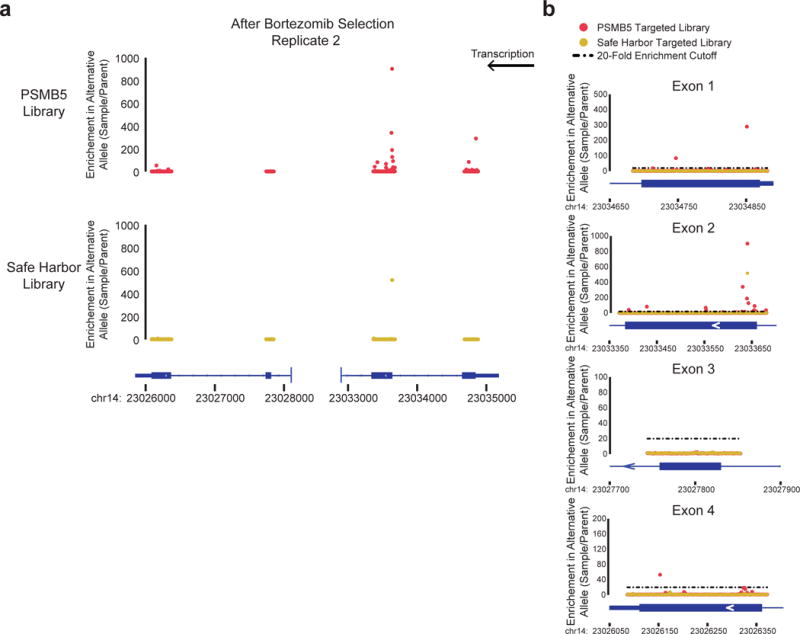
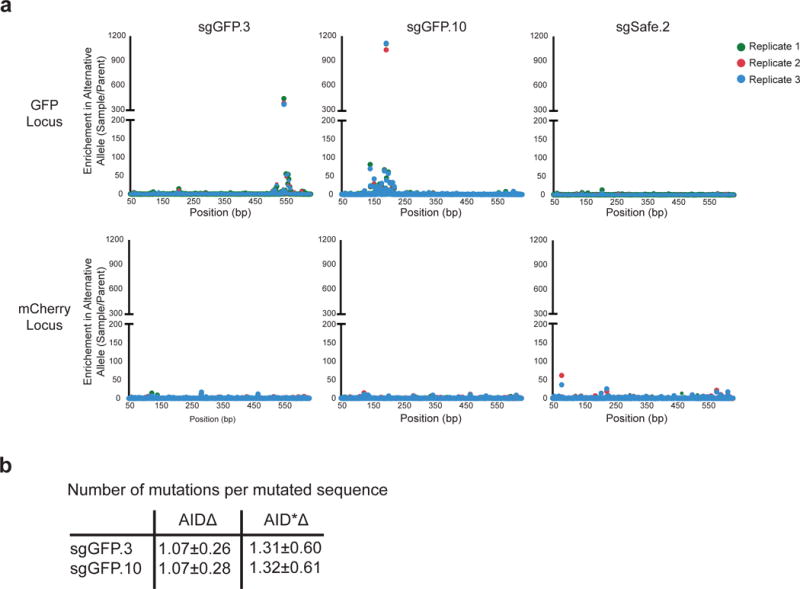
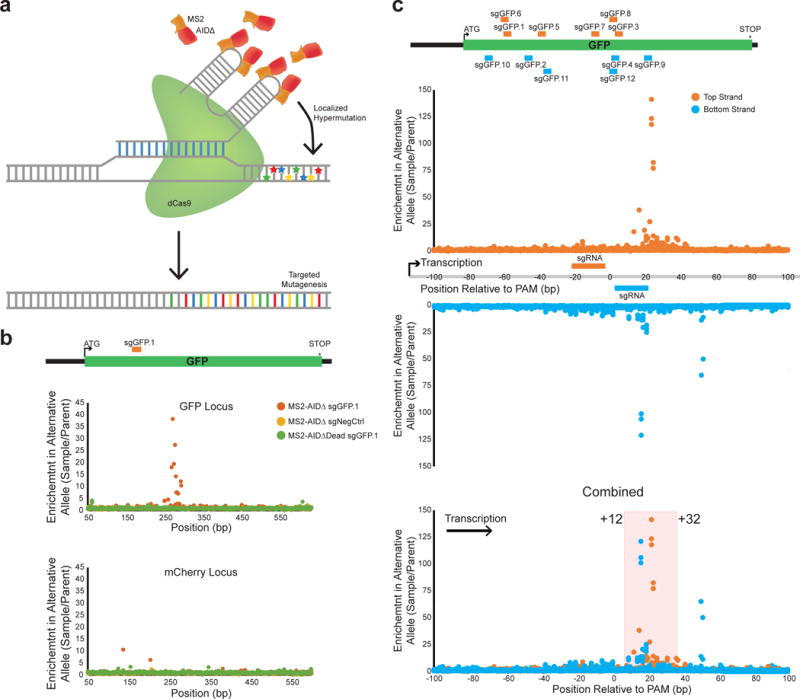
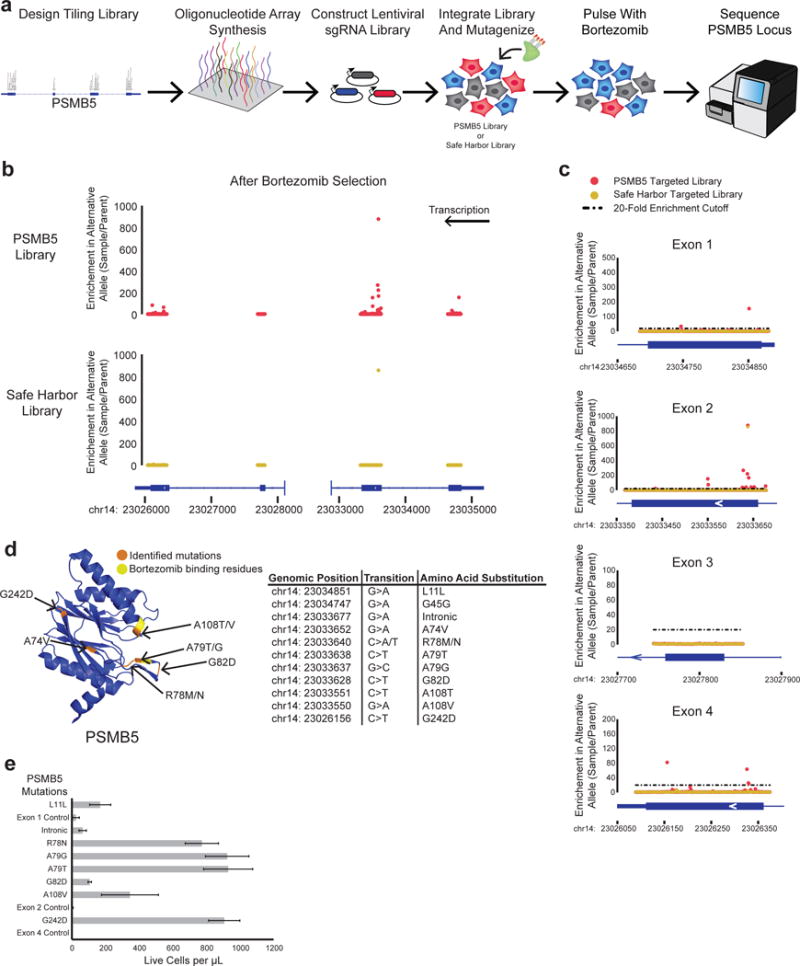
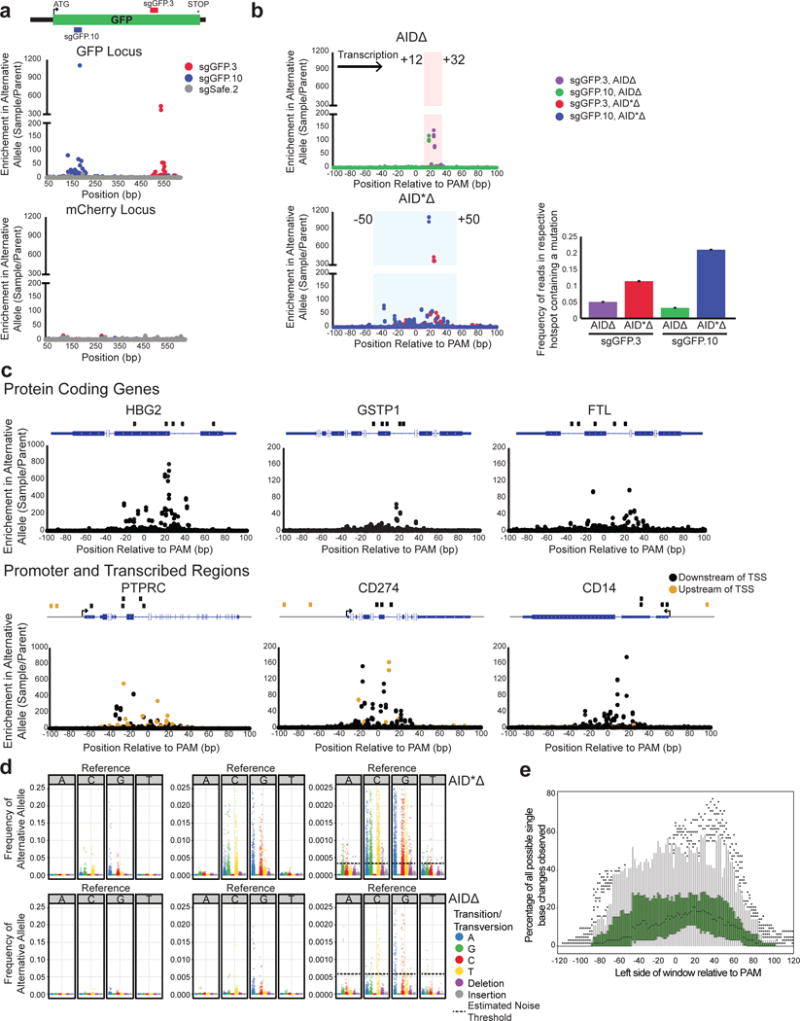
Engineering and study of protein function by directed evolution has been limited by the technical requirement to use global mutagenesis or introduce DNA libraries. Here, we develop CRISPR-X, a strategy to repurpose the somatic hypermutation machinery for protein engineering in situ. Using catalytically inactive dCas9 to recruit variants of cytidine deaminase (AID) with MS2-modified sgRNAs, we can specifically mutagenize endogenous targets with limited off-target damage. This generates diverse libraries of localized point mutations and can target multiple genomic locations simultaneously. We mutagenize GFP and select for spectrum-shifted variants, including EGFP. Additionally, we mutate the target of the cancer therapeutic bortezomib, PSMB5, and identify known and novel mutations that confer bortezomib resistance. Finally, using a hyperactive AID variant, we mutagenize loci both upstream and downstream of transcriptional start sites. These experiments illustrate a powerful approach to create complex libraries of genetic variants in native context, which is broadly applicable to investigate and improve protein function.


Figures

Extended Data Figure 1
Extended Data Figure 1. Characterization of AID variants
a) Diagram of AID variants. NLS, NES, deaminase domain, truncations, and activity-altering mutations are indicated. b) Fluorescence microscopy of MS2-AID and MS2-AIDΔ constructs in K562 cells is shown. Cells were fixed and stained with an MS2 antibody (green) and the nuclear stain DAPI (blue). c) A comparison of the expression of different MS2-AID variants is shown. K562 cells expressing the variants were lysed and analyzed on an SDS-PAGE gel followed by immunoblotting with an MS2 antibody (top) or GAPDH antibody (bottom). d) K562 cells containing dCas9, GFP, and mCherry were transiently electroporated with indicated combinations of MS2-AID, MS2-AIDΔ, or MS2-AIDΔDead and either sgGFP.1 or sgNegCtrl. GFP and mCherry fluorescence of the cells were measured by flow cytometry as a proxy for mutation rate. Shown are the scatter plots from the flow cytometry and a graph summarizing the non-fluorescent populations. e) Cells were sorted for low GFP expression and the GFP locus was sequenced. A graph of the enrichment of mutation at each base is shown here.
Extended Data Figure 2
Extended Data Figure 2. On-target mutagenesis using CRISPR-X with limited off-target effect
a) Cells were infected with indicated combinations of MS2-AIDΔ or MS2-AIDΔDead and sgGFP.1 or sgNegCtrl and the GFP and mCherry fluorescence of the cells was measured by flow cytometry as a proxy for mutation rate. Shown are the scatter plots from flow cytometry and graphs summarizing the non-fluorescent populations. Error bars represent standard error. b) GFP and mCherry loci of the infected cells were sequenced and enrichment of mutation was calculated at each base position for three replicate experiments.
Extended Data Figure 3
Extended Data Figure 3. CRISPR-X tiling of GFP locus
a) Map of sgRNAs tiling the GFP locus. b) sgRNAs targeting GFP were integrated into cells expressing dCas9, MS2-AIDΔ, GFP, and mCherry, and the GFP locus was sequenced. Enrichment of mutations at each base position is shown for three replicates of each sgRNA. c) A box plot indicating the frequency of mutated reads observed in the respective hotspot of each sgRNA is shown. The median value for the conditions is listed above each sample. The box plot lines represent the 1.5 of the interquartile range.
Extended Data Figure 4
Extended Data Figure 4. Directed evolution of wtGFP to EGFP using CRISPR-X
a) A replicate of the wtGFP evolution experiment (Fig. 2a) was performed using electroporated sgRNAs and MS2-AIDΔ. Flow cytometry scatter plots are shown for the wtGFP parent and samples before each round of sorting. The wtGFP locus was sequenced for the unsorted condition and after both sorting rounds. Enrichment of mutation was calculated at each base position. The graphs of enrichment are shown for both wtGFP targeted and safe harbor targeted libraries except after Sort #2 where no safe harbor cells were recovered after sorting. Identified mutations are labeled in the graphs. b) wtGFP cells expressing dCas9, MS2-AIDΔ, and wtGFP were lentivirally infected with sgwtGFP.1 or sgSafe.2 in replicate and sorted once, enriching for spectrum-shifted GFP cells. Scatter plots for the parent and unsorted populations are shown for both replicates. The wtGFP locus was sequenced pre- and post-sorting, and enrichment of mutations at each base position is shown. The S65T mutation is labeled in the graph for the sorted condition.
Extended Data Figure 5
Extended Data Figure 5. Identifying bortezomib resistant mutations in PSMB5
a) A replicate experiment was performed for directed evolution of bortezomib-resistant PSMB5 mutations (see Fig. 3). The PSMB5 exonic loci were sequenced after selection with bortezomib for both the PSMB5 and Safe Harbor libraries and enrichment of mutations at each base position is shown. b) Graphs of mutation enrichment are shown for individual exonic loci of PSMB5. Mutations that were enriched beyond the 20-fold cutoff (dashed black line) are observed in Exons 1, 2, and 4.
Extended Data Figure 6
Extended Data Figure 6. Knock-in and validation of novel bortezomib-resistant PSMB5 variants
Bortezomib resistant mutations observed in PSMB5 (Fig. 3d) were knocked-in to K562 cells and populations were selected with bortezomib. The corresponding PSMB5 exons for the five most viable mutations were amplified, cloned into pCR-Blunt, and sequenced individually. Shown is a table summarizing the sequences of individual colonies with mutations or insertions/deletions shown in red; the targeted base is in bold.
Extended Data Figure 7
Extended Data Figure 7. Improved mutagenesis using AID*Δ
a) sgRNAs targeting either GFP (sgGFP.3 and sgGFP.10) or a safe harbor locus (sgSafe.2) were integrated into cells expressing dCas9, MS2-AID*Δ, GFP, and mCherry. The GFP and mCherry loci were sequenced. Enrichment of mutation at each base position is shown. b) For sgGFP.3 and sgGFP.10 paired with either AIDΔ or AID*Δ, sequences were filtered for those containing a mutation, and the average number of mutations per sequence was calculated. The average and standard error are shown.
Extended Data Figure 8
a) sgRNAs targeting either GFP or endogenous loci were integrated into cells expressing dCas9, MS2-AID*Δ, GFP, and mCherry. The respective targeted loci were sequenced. Graphs showing the frequency of alternative alleles at each base position relative to the PAM of the sgRNA are shown. b) Box plot indicating the range of frequency of mutated reads over the 100bp region for 30 sgRNAs is shown. The lines represent 1.5 times the interquartile range. Median value is indicated above graph.
Extended Data Figure 9
sgGFP.10 and sgmCherry.1 were integrated separately or in combination into cells expressing dCas9, MS2-AID*Δ, GFP, and mCherry. The GFP and mCherry fluorescence of the cells were measured. The scatter plots of the flow cytometry for each of the samples are shown (left). A graph summarizing the percentage of GFP negative or mCherry negative cells is shown (top left). In the bottom left panel, a graph displaying the percentage of cells that have neither GFP nor mCherry is shown. Error bars indicate standard error.
Figure 1
Figure 1. CRISPR-X generates targeted mutations
a) Schematic of CRISPR-X. dCas9 (160 kDa) complexes with an sgRNA containing MS2 hairpins in its stem loop, which recruit AIDΔ fused to MS2 binding protein (40 kDa). The deaminase induces local DNA damage which in turn introduces mutations. b) Cells expressing dCas9, GFP and mCherry were infected with indicated combinations of MS2-AIDΔ or MS2-AIDΔDead and sgGFP.1 or sgNegCtrl, and the GFP and mCherry loci were sequenced. Enrichment of mutations at each base position are shown for one replicate each. Additional replicates are shown in Supplementary Data Fig. 2b. c) 12 guides targeting GFP were infected into cells expressing dCas9, MS2-AIDΔ, GFP and mCherry. The targeting locations of the guides in the GFP locus are shown on the top panel. The GFP locus was sequenced for each sample. Enrichment of mutation relative to the position of the PAM of the sgRNAs is shown on the lower panel. The direction of transcription was defined as the positive direction as indicated by the arrow.
Figure 2
Figure 2. Evolution of wtGFP to EGFP using CRISPR-X
a) Schematic of wtGFP evolution experiments. wtGFP expressing cells were transiently electroporated with MS2-AIDΔ and 4 sgRNAs either targeting GFP or safe harbor regions. Cells were sorted for spectrum shifted GFP bright cells followed by sequencing of the wtGFP locus. b) Cells were collected from unsorted populations and after each round of sorting, and the wtGFP locus was sequenced. (left) Enrichment of mutations at each base position for both wtGFP targeted and safe harbor targeted libraries are shown except after the Sort #2 condition where no safe harbor cells were recovered. Identified mutations are labeled. (right) Scatter plots of the flow cytometry and gating are shown for the wtGFP parent and pre-sorting populations. c) Lentiviral expression constructs were generated containing each of the S65T and Q80H mutations separately and together. Plasmids encoding these variants along with wtGFP and EGFP controls were lipid transfected into 293T cells and the GFP fluorescence was measured by flow cytometry.
Figure 3
Figure 3. Directed evolution of bortezomib resistant mutations in PSMB5
a) Schematic for PSMB5 mutagenesis and bortezomib selection. Libraries targeting the exons of PSMB5 or control safe harbor regions were designed and synthesized on an oligonucleotide array and cloned into an sgRNA expressing vector. This vector was integrated into cells expressing dCas9 and MS2-AIDΔ to generate mutations. Cells were pulsed with bortezomib, after which the PSMB5 exonic loci were sequenced. b) Graphs of the enrichment of mutation at each base position are shown for the PSMB5 locus in both PSMB5 and safe harbor targeted libraries for one biological replicate. c) Graphs of the enrichment of mutations are shown for individual PSMB5 exons. Positions that were above 20-fold enriched (black dashed line) in both replicates were identified as possible candidates. d) PSMB5 structure is shown. Identified mutations (orange) and residues involved in binding bortezomib (yellow) are indicated. A table summarizing the mutations is included. e) Mutations were installed into K562 cells and selected with bortezomib. A graph summarizing the density of live cells after selection is shown. Error bars indicate standard error.
Figure 4
Figure 4. Enhanced mutagenesis of genes, promoters, and multiple loci with hyperactive AID*Δ
a) sgGFP.3, sgGFP.10, and sgSafe.2 were infected into cells expressing dCas9, MS2-AID*Δ, GFP, and mCherry. The GFP and mCherry loci were sequenced. Enrichment of mutations at each base position in both loci is shown. b) Enrichment of mutations at positions relative to the sgRNA PAM is shown for 2 GFP-targeting sgRNAs, sgGFP.3 and sgGFP.10, using either AIDΔ (top graph) or hyperactive AID*Δ (bottom graph). The shaded rectangles highlight the respective hotspot regions. (right) The frequencies of mutated sequences in the respective hotspots are shown. Error bars indicate standard error. c) sgRNAs were designed to target six endogenous loci. Gene diagrams for each locus are shown indicating the position of the respective guides. Cells expressing dCas9 and MS2-AID*Δ were infected with the sgRNAs, and the loci were sequenced. Shown are graphs of the enrichment of mutations at positions relative to the PAM at each of the loci. Samples with sgRNAs targeting upstream of the transcription start site are shown in orange. d) Transition and transversion mutations observed using AID*Δ and AIDΔ are shown at three different scales. At each base in the hotspot region, the frequency of each transition was calculated and normalized to the parent population. The AID*Δ transitions were tabulated from mutations generated with sgGFP.3, sgGFP.10, and sgRNAs targeting endogenous loci. The mutations induced by AIDΔ were tabulated from sgGFP.1–12. The standard deviation of alternative allele frequencies in the parental samples were calculated and indicated by the dashed black line. e) Graph of the percentage of all possible single base changes observed for AID*Δ targeted with sgRNAs (described in Fig. 4a,c) in a 21bp sliding window. Single base changes with a frequency above the estimated noise were counted over a 21bp window beginning at the indicated position relative to the PAM, and the measured fraction of all possible changes is reported for each window. Box plots at each position are shown summarizing the distribution observed over all sgRNAs. The box plot lines represent 1.5X the interquartile range.

References

    1. Doerner A, Rhiel L, Zielonka S, Kolmar H. Therapeutic antibody engineering by high efficiency cell screening. FEBS letters. 2014;588:278–287. doi: 10.1016/j.febslet.2013.11.025. - DOI - PubMed
    1. Bornscheuer UT, et al. Engineering the third wave of biocatalysis. Nature. 2012;485:185–194. doi: 10.1038/nature11117. - DOI - PubMed
    1. Soskine M, Tawfik DS. Mutational effects and the evolution of new protein functions. Nature reviews Genetics. 2010;11:572–582. doi: 10.1038/nrg2808. - DOI - PubMed
    1. Lienert F, Lohmueller JJ, Garg A, Silver PA. Synthetic biology in mammalian cells: next generation research tools and therapeutics. Nature reviews Molecular cell biology. 2014;15:95–107. doi: 10.1038/nrm3738. - DOI - PMC - PubMed
    1. Hoogenboom HR. Selecting and screening recombinant antibody libraries. Nature biotechnology. 2005;23:1105–1116. doi: 10.1038/nbt1126. - DOI - PubMed

MeSH terms