. 2016 Dec;13(12):1021-1028.
doi: 10.1038/nmeth.4040. Epub 2016 Oct 31.

Fast volumetric calcium imaging across multiple cortical layers using sculpted light

Affiliations

Fast volumetric calcium imaging across multiple cortical layers using sculpted light

Robert Prevedel et al. Nat Methods. 2016 Dec.

Abstract

Although whole-organism calcium imaging in small and semi-transparent animals has been demonstrated, capturing the functional dynamics of large-scale neuronal circuits in awake behaving mammals at high speed and resolution has remained one of the main frontiers in systems neuroscience. Here we present a method based on light sculpting that enables unbiased single- and dual-plane high-speed (up to 160 Hz) calcium imaging as well as in vivo volumetric calcium imaging of a mouse cortical column (0.5 mm × 0.5 mm × 0.5 mm) at single-cell resolution and fast volume rates (3-6 Hz). We achieved this by tailoring the point-spread function of our microscope to the structures of interest while maximizing the signal-to-noise ratio using a home-built fiber laser amplifier with pulses that are synchronized to the imaging voxel speed. This enabled in vivo recording of calcium dynamics of several thousand neurons across cortical layers and in the hippocampus of awake behaving mice.


Conflict of interest statement

Competing Financial Interests

The authors declare no competing financial interests.

Figures
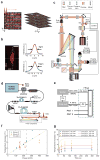
Figure 1
Figure 1. Schematic and principle of scanned temporal focusing imaging system
(a) Schematic of the s-TeFo imaging. A large field-of-view is raster-scanned using an enlarged sculpted PSF and a one-pulse-per voxel excitation-acquisition scheme. Volumetric image acquisition is achieved by translating the objective axially (along z-axis) via a high-speed long-range piezo. Scale bar is 100μm. (b) Measured axial confinement of the sculpted point-spread-function (PSF) of the laterally symmetric TeFo-spot using 0.5μm sized beads. Corresponding x and z profiles showing lateral and axial confinement of excitation, a.u., arbitrary units. Scale bar is 10μm. (c) Overview of the s-TeFo microscope. The main dichroic mirror and a mirror are mounted on a slider in order to switch between two-photon scanning and wide-field epi-fluorescent imaging mode. EOM, electro-optical modulator, BS, beam-splitter, PBS, polarizing beam-splitter. (d) Sketch of the laser design, showing the ytterbium (Yb) oscillator seed, and two subsequent amplification stages based on polarization-maintaining large mode area Yb-doped fibers (Yb-PLMA). Free-space and in-fiber Faraday isolator prevent back-reflections. Pulses with a central wavelength of 1035nm are compressed to near Fourier limited duration (180 fs) using a pair of gratings. FCAOM, fiber-coupled acousto-optic modulator (e) The data acquisition is synchronized with the laser by utilizing the Yb-oscillator signal as the external clock of the FPGA with an additional synchronization signal supplied by the output of the laser (see c and Methods for details). Δt represents an electronic delay while AND performs a coincidence measurement of the photo-multiplier tube (PMT) signals with the sync signals. (f) Steady-state temperature increase measured in-situ in the mouse brain during imaging, depending on the effective average laser power used. Dashed line indicates highest average laser power used in the experiments. Simulations were done following Ref. . (g) Measured (dots) as well as simulated (line) average temperature change from start of imaging, and thus laser illumination, for various scanning conditions. The discrepancy between simulation and experiment are attributed to blood vessels which provide increased heat transport away from the imaging site. Error bars denote standard deviation.
Figure 2
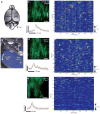
Figure 2. High-speed single plane Ca2+-imaging in mouse posterior parietal cortex at 158fps using s-TeFo
(a) Sketch of the adult mouse brain, indicating the injection and imaging sites. M1 primary motor cortex, PPC posterior parietal cortex. Scale bar is 2mm. (b) Photograph of the animal mounted below the imaging objective via a head bar holder on a homebuilt running disc. The animal is additionally supported by a stabilizer attached to a body jacket. (c) Top left: Time averaged intensity projection image at Layer 2/3 (200μm depth) in mouse PPC expressing GCAMP6m. Right: Calcium traces of 114 active neurons identified in this plane. Each row shows the time-series activity of an individual neuron. Color indicates percent fluorescence changes (ΔF/F0); scaling is indicated by the color bar on the right. Typical calcium transients consisted of an estimated (30±10)*103 detected photons (~3 photons per digitized count). Bottom left: Zoom-into a single trace (dashed box) is shown. Grey: raw data, red: moving average of 10 time points. (d) Same as in c, but at Layer-4 (depth of 360μm) in the same animal. (e) Same as in c, but at Layer-5 (depth of 470μm) of a GCAMP6f expressing mouse. The time-averaged laser powers used during imaging for the three different depths at the sample during imaging were approx. 100, 156 and 220mW in c, d and e, respectively. Scale bar is 100μm in c, d. Representative recordings out of ten data sets.
Figure 3
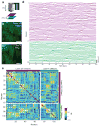
Figure 3. Fast dual-plane Ca2+-imaging in mouse posterior parietal cortex at 10Hz
(a) Recording of two axially separated planes was achieved by rapid z-scanning of the objective with a piezo (10 Hz), between two imaging planes at 150μm and 350μm below the dura, corresponding to layer 2/3 and layer 4 respectively. (b, c) Time averaged intensity projection images of the two planes in PPC expressing GCAMP6m. (d) Extracted, raw Ca2+-traces of a 100sec recording from the planes shown in (a-c), displaying fluorescence changes (ΔF/F0) over time. Dual-plane frame rate was 10Hz. Color codes for cortical layer of the neuron in (a). (e) Matrix showing correlation coefficient (R) calculated from all the time series shown in d, with neurons grouped by agglomerative hierarchical clustering per plane (color bar on the right). The dashed boxes show small clusters of correlated neurons within each plane which also exhibit a positive correlation across the two planes (arrows 1 and 2) as well as two clusters that do not share correlations across layers (arrow 3). The time-averaged laser powers used during imaging for the two different depths at the sample during imaging were 73 and 170mW, in b and c respectively. Scale bar is 100μm in b, c. Representative recording out of three data sets.
Figure 4
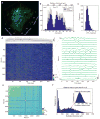
Figure 4. Fast volumetric imaging of Ca2+-dynamics across cortical layers in mouse posterior parietal cortex
(a) Three dimensional volume view (rendering) of the time-averaged, raw fluorescence recorded from a 500×500×500μm volume in the cortex (PPC) in an awake mouse. (b) Number of active (blue) and inactive (grey) GCAMP6m expressing neurons identified in each axial plane. Depth from brain surface and approximate cortical layer correspondence indicated on top. c) Distribution of maximum fluorescence change (ΔF/F0) of all neurons within the acquisition period. (d) Time-series heat map of all active neurons (2826 from a total of 4306) during a ~330sec recording. Volume acquisition rate is 3Hz. Zoom-in of individual traces shows distinct calcium transients (right panel). Graph on top of the heat map shows average fluorescence level of all neurons during the recording (black line) as well as s.e.m (grey shading), indicating negligible photo-bleaching. (e) Matrix showing correlation coefficient (R) calculated from all the time series shown in d, with neurons grouped by agglomerative hierarchical clustering (color bar on the right). (f) Distribution of all neuronal pair distances with high correlation (R>0.5). Red line shows scaled envelope of all neuronal pair distances, plotted in the inset. Results show enhancement of highly correlated, spatially close neuron pairs compared to all neuron pairs. The time-averaged laser powers used during volumetric imaging were between 95 and 195mW, depending on depth, cycling between these values in sync with the objective piezo and blanked during resonant mirror turnaround and piezo flyback (see Methods). Representative recording out of five data sets.
Figure 5
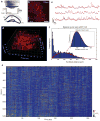
Figure 5. Fast volumetric imaging of Ca2+-dynamics in mouse hippocampus CA1
(a) Schematic drawing of the hippocampal window preparation, indicating corpus callosum (CC), and region of hippocampus proper Cornu Ammonis (CA1, CA3) as well as dentate gyrus (DG). The red box shows the approximate imaging volume. (b) Time averaged intensity projection image at 100μm depth in mouse hippocampus CA1. Scale bar is 100μm. (c) Representative Ca2+-traces of individual neurons imaged at 158fps in a single plane. Grey: raw data, red: moving average of 10 time points. (d) 3D rendering of time-averaged imaging volume (500×500×200μm). (e) Time-series heat map of all 1416 active neurons from a total of 1994 identified neurons within the imaging volume during a ~260sec recording. Images were acquired at a volume rate of ~6Hz. (f) Distribution of all neuronal pair distances with elevated correlation (R>0.3). Red line shows scaled envelope of all neuronal pair distances, plotted in the inset. This shows enhancement of correlated, spatially close neuron pairs compared to all neuron pairs. Time-averaged laser powers in the sample during imaging were 100mW in c and between 86 and 120mW in d, e depending on depth. Calcium indicator was cytosolic jRGECKO1a. Representative recording of three data sets.

References

    1. Chen TW, et al. Ultrasensitive fluorescent proteins for imaging neuronal activity. Nature. 2013;499:295–300. - PMC - PubMed
    1. Huisken J, Swoger J, Del Bene F, Wittbrodt J, Stelzer EH. Optical sectioning deep inside live embryos by selective plane illumination microscopy. Science. 2004;305:1007–1009. - PubMed
    1. Ahrens MB, Orger MB, Robson DN, Li JM, Keller PJ. Whole-brain functional imaging at cellular resolution using light-sheet microscopy. Nature methods. 2013;10:413–420. doi: 10.1038/nmeth.2434. - DOI - PubMed
    1. Chen B-C, et al. Lattice light-sheet microscopy: Imaging molecules to embryos at high spatiotemporal resolution. Science. 2014;346 doi: 10.1126/science.1257998. - DOI - PMC - PubMed
    1. Levoy M, Ng R, Adams A, Footer M, Horowitz M. Light field microscopy. Acm Transactions on Graphics. 2006;25:924–934. doi: 10.1145/1141911.1141976. - DOI