. 2016 Dec;48(12):1535-1543.
doi: 10.1038/ng.3704. Epub 2016 Oct 31.

Mycobacterium tuberculosis lineage 4 comprises globally distributed and geographically restricted sublineages

David Stucki #  1   2 Daniela Brites #  1   2 Leïla Jeljeli #  3   4 Mireia Coscolla  1   2 Qingyun Liu  5 Andrej Trauner  1   2 Lukas Fenner  1   2   6 Liliana Rutaihwa  1   2 Sonia Borrell  1   2 Tao Luo  7 Qian Gao  5 Midori Kato-Maeda  8 Marie Ballif  1   2   6 Matthias Egger  6 Rita Macedo  9 Helmi Mardassi  4 Milagros Moreno  10 Griselda Tudo Vilanova  11 Janet Fyfe  12 Maria Globan  12 Jackson Thomas  13 Frances Jamieson  14 Jennifer L Guthrie  14 Adwoa Asante-Poku  15 Dorothy Yeboah-Manu  15 Eddie Wampande  16 Willy Ssengooba  16   17 Moses Joloba  16 W Henry Boom  18 Indira Basu  19 James Bower  19 Margarida Saraiva  20   21 Sidra E G Vaconcellos  22 Philip Suffys  22 Anastasia Koch  23 Robert Wilkinson  23   24   25 Linda Gail-Bekker  23 Bijaya Malla  1   2 Serej D Ley  1   2   26 Hans-Peter Beck  1   2 Bouke C de Jong  27 Kadri Toit  28 Elisabeth Sanchez-Padilla  29 Maryline Bonnet  29 Ana Gil-Brusola  30 Matthias Frank  31 Veronique N Penlap Beng  32 Kathleen Eisenach  33 Issam Alani  34 Perpetual Wangui Ndung'u  35 Gunturu Revathi  36 Florian Gehre  27   37 Suriya Akter  27 Francine Ntoumi  31   38 Lynsey Stewart-Isherwood  39 Nyanda E Ntinginya  40 Andrea Rachow  41 Michael Hoelscher  41 Daniela Maria Cirillo  42 Girts Skenders  43 Sven Hoffner  44 Daiva Bakonyte  45 Petras Stakenas  45 Roland Diel  46 Valeriu Crudu  47 Olga Moldovan  48 Sahal Al-Hajoj  49 Larissa Otero  50 Francesca Barletta  50 E Jane Carter  51   52 Lameck Diero  52 Philip Supply  53 Iñaki Comas  54   55 Stefan Niemann  3   56 Sebastien Gagneux  1   2
Affiliations

Mycobacterium tuberculosis lineage 4 comprises globally distributed and geographically restricted sublineages

David Stucki et al. Nat Genet. 2016 Dec.

Abstract

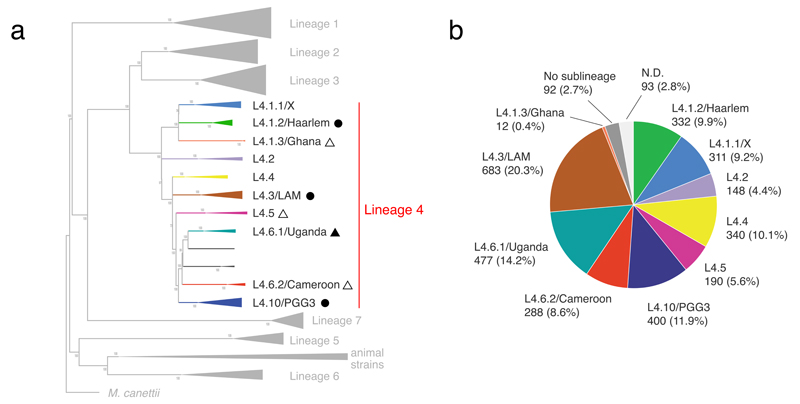
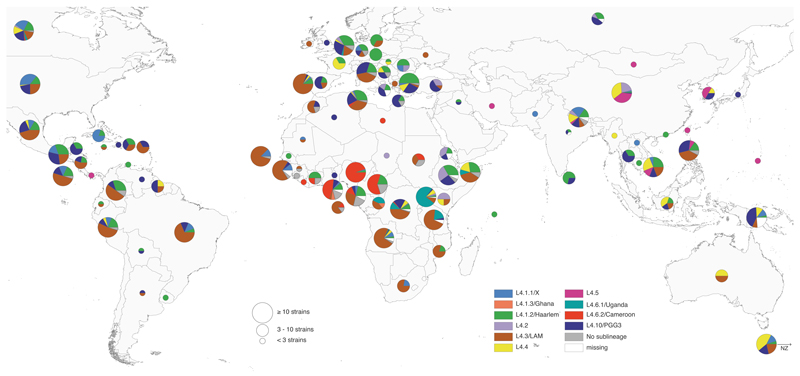
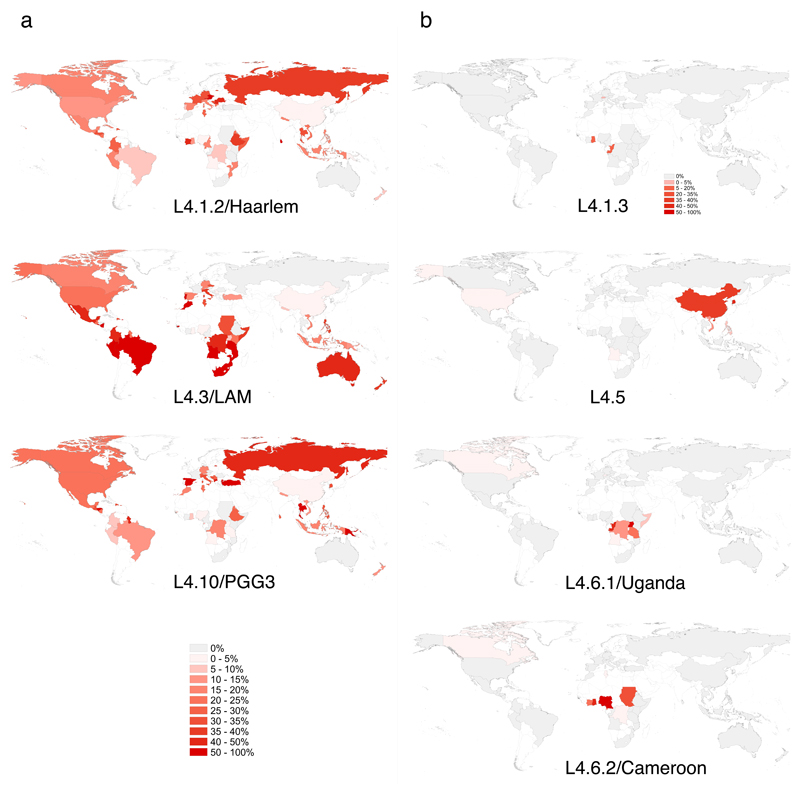
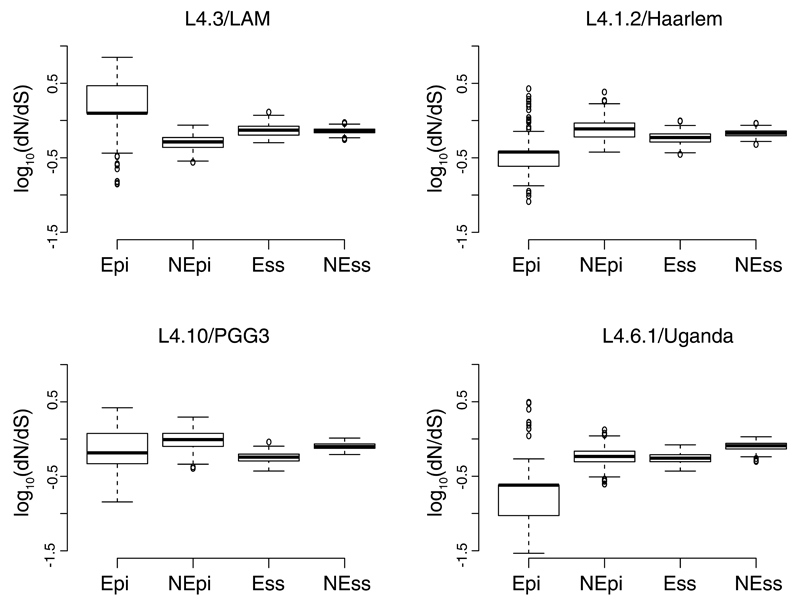
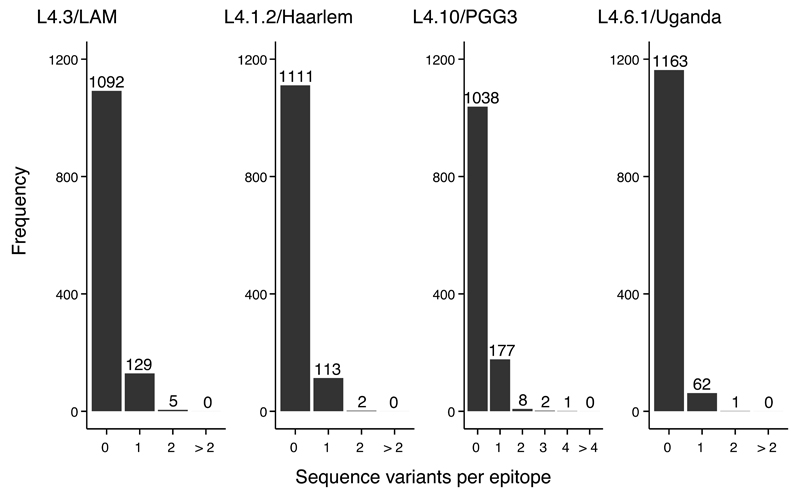
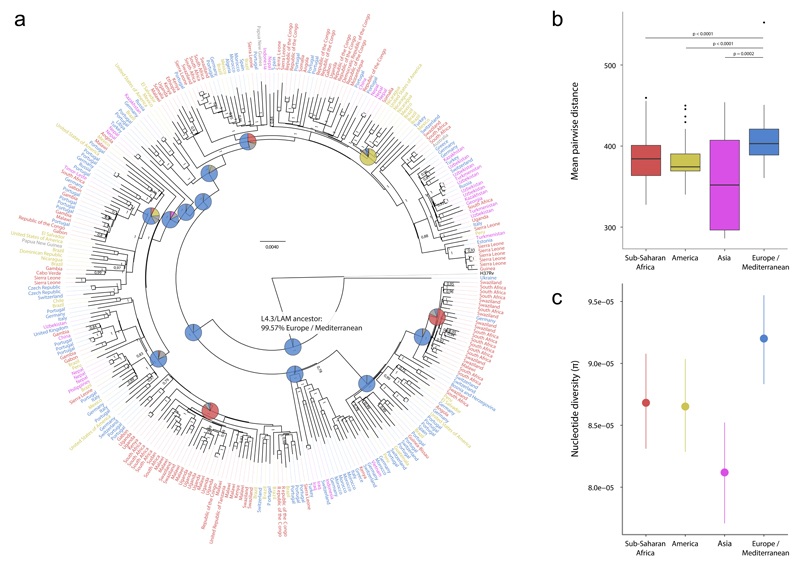
Generalist and specialist species differ in the breadth of their ecological niches. Little is known about the niche width of obligate human pathogens. Here we analyzed a global collection of Mycobacterium tuberculosis lineage 4 clinical isolates, the most geographically widespread cause of human tuberculosis. We show that lineage 4 comprises globally distributed and geographically restricted sublineages, suggesting a distinction between generalists and specialists. Population genomic analyses showed that, whereas the majority of human T cell epitopes were conserved in all sublineages, the proportion of variable epitopes was higher in generalists. Our data further support a European origin for the most common generalist sublineage. Hence, the global success of lineage 4 reflects distinct strategies adopted by different sublineages and the influence of human migration.


Conflict of interest statement

Statement The authors have no competing interests as defined by Springer Nature, or other interests that might be perceived to influence the results and/or discussion reported in this paper.

Figures

Figure 1
Figure 1. Definition and global frequency of Lineage 4 sublineages.
(a) We defined 10 sublineages based on the analysis of 72 MTBC Lineage 4 genome sequences published previously,. Sublineages were labeled according to Coll et al. (whenever possible) and previous designations based on spoligotyping (see Supplementary Fig. 1). Black triangles indicate sublineages identified as specialists, black circles indicate generalists. Filled shapes indicate sublineages, for which we performed deep genomic analyses. (b) Global proportion of each sublineage. A total of 3,366 MTBC Lineage 4 isolates were screened for sublineage-specific SNPs. L4.3/LAM was the most frequent sublineage globally.
Figure 2
Figure 2. Global distribution of Lineage 4 sublineages.
Pie charts showing proportions of the 10 Lineage 4 sublineages among all MTBC Lineage 4 isolates in each country. Circle sizes correspond to the number of isolates analyzed per country. A total of 3,366 MTBC Lineage 4 isolates were included. Color codes are as in Fig. 1.
Figure 3
Figure 3. Country-specific proportions of sublineages reveal generalists and specialists.
(a) The generalist sublineages L4.1.2/Haarlem, L4.3/LAM and L4.10/PGG3 were found globally at high proportions. (b) The locally restricted specialist sublineages L4.1.3/Ghana, L4.5, L4.6.1/Uganda and L4.6.2/Cameroon occurred at high frequencies in only a few countries and were restricted to certain geographical regions. Intensity of red indicates proportion of the sublineage among all Lineage 4 isolates in each country. Countries with fewer than three isolates in total are shown as “no data” and are filled white. A total of 3,366 Lineage 4 isolates were included in this analysis. The color scale for all sublineages is as indicated in Panel a, except for sublineage L4.1.3/Ghana (separate scale shown).
Figure 4
Figure 4. Pair-wise ratios of rates of nonsynonymous to synonymous substitutions (dN/dS) in generalist and specialist sublineages for different gene categories.
Abbreviations: Epi experimentally confirmed human T cell epitopes; nEpi – non-epitope regions of T-cell antigens, both obtained from the Immune Epitope Database; Ess – essential genes; nEss – non-essential genes. Wilcoxon rank sum tests: L4.6.1/Uganda (N=203) Epi vs nEpi, W=4952, p<0.001; L4.6.1/Uganda (N=203) Ess vs nEss, W=1415, p<0.001; L4.3/LAM (N=293) Epi vs nEpi, W=74540, p<0.001, L4.3/LAM (n=293) Ess vs nEss W=45067, p-value=0.29; L4.1.2/Haarlem (N=228) Epi vs nEpi, W=6561, p<0.001, L4.1.2/Haarlem (N=228) Ess vs nEss W=13369, p<0.001; L4.10/PGG3 (N=301) Epi vs nEpi, W= 27335, p<0.001, L4.10/PGG3 (N=301) Ess vs nEss W= 3103, p<0.001.
Figure 5
Figure 5. Frequency distribution of the number of epitopes with nonsynonymous variants in generalist and specialist sublineages.
A total of 1,226 T cell epitopes were included in the analysis. The number above each bar corresponds to epitope counts. Generalist sublineages L4.3/LAM, L4.1.2/Haarlem and (L4.10/PGG3. Specialist sublineage L4.6.1/Uganda. Tests: L4.6.1/Uganda vs L4.3/LAM Χ2= 27.04, p<0.001; L4.6.1/Uganda vs L4.1.2/Haarlem Χ2=15.75, p<0.001; L4.6.1/Uganda vs L4.1.2/PGG3 Χ2= 68.24, p<0.001.
Figure 6
Figure 6. Genome-based phylogeny and diversity by continent of 293 strains of the L4.3/LAM sublineage.
(a) Bayesian phylogeny with label colors indicating continent of strain origin: blue, Europe/Mediterranean; red, Sub-Saharan Africa; yellow, America; pink, Asia. Numbers on nodes indicate posterior probabilities. Pie charts indicate reconstructed ancestral geographical regions of the internal nodes. The hypothetical L4.3/LAM-ancestor is labeled and a European origin for this ancestor was supported using a Bayesian Method (shown) and a Maximum Parsimony method (Supplementary Fig. 14). The pie colors correspond to the colors of the taxa labels. (b) Boxplot of pairwise genetic distances (number of polymorphisms) of L4.3/LAM strains by continent (p-values from Wilcoxon rank sum test). (c) Nucleotide diversity per site (π), measured by continent. Error bars indicate 95% confidence intervals. MTBC isolates from countries of the continent group “Oceania“ (UN category; including Australia and New Zealand, Melanesia, Micronesia and Polynesia) were excluded for the genetic diversity analysis in panels B and C due the low number of samples.

Comment in

References

    1. Futuyma DJ, Moreno G. The Evolution of Ecological Specialization. Annual Review of Ecology and Systematics. 1988;19:207–233.
    1. Woolhouse ME, Webster JP, Domingo E, Charlesworth B, Levin BR. Biological and biomedical implications of the co-evolution of pathogens and their hosts. Nat Genet. 2002;32:569–77. - PubMed
    1. Woolhouse ME, Taylor LH, Haydon DT. Population biology of multihost pathogens. Science. 2001;292:1109–12. - PubMed
    1. Kirzinger MW, Stavrinides J. Host specificity determinants as a genetic continuum. Trends Microbiol. 2012;20:88–93. - PubMed
    1. Vouga M, Greub G. Emerging bacterial pathogens: past and beyond. Clin Microbiol Infect. 2016;22:12–21. - PMC - PubMed

Publication types