. 2016 Dec;19(12):1743-1749.
doi: 10.1038/nn.4430. Epub 2016 Oct 31.

A viral strategy for targeting and manipulating interneurons across vertebrate species

Affiliations

A viral strategy for targeting and manipulating interneurons across vertebrate species

Jordane Dimidschstein et al. Nat Neurosci. 2016 Dec.

Erratum in

  • Corrigendum: A viral strategy for targeting and manipulating interneurons across vertebrate species.
    Dimidschstein J, Chen Q, Tremblay R, Rogers SL, Saldi GA, Guo L, Xu Q, Liu R, Lu C, Chu J, Avery MC, Rashid MS, Baek M, Jacob AL, Smith GB, Wilson DE, Kosche G, Kruglikov I, Rusielewicz T, Kotak VC, Mowery TM, Anderson SA, Callaway EM, Dasen JS, Fitzpatrick D, Fossati V, Long MA, Noggle S, Reynolds JH, Sanes DH, Rudy B, Feng G, Fishell G. Dimidschstein J, et al. Nat Neurosci. 2017 Jun 27;20(7):1033. doi: 10.1038/nn0717-1033c. Nat Neurosci. 2017. PMID: 28653691 No abstract available.

Update in

  • Addendum: A viral strategy for targeting and manipulating interneurons across vertebrate species.
    Dimidschstein J, Chen Q, Tremblay R, Rogers SL, Saldi GA, Guo L, Xu Q, Liu R, Lu C, Chu J, Avery MC, Rashid MS, Baek M, Jacob AL, Smith GB, Wilson DE, Kosche G, Kruglikov I, Rusielewicz T, Kotak VC, Mowery TM, Anderson SA, Callaway EM, Dasen JS, Fitzpatrick D, Fossati V, Long MA, Noggle S, Reynolds JH, Sanes DH, Rudy B, Feng G, Fishell G. Dimidschstein J, et al. Nat Neurosci. 2017 Jun 27;20(7):1033. doi: 10.1038/nn0717-1033d. Nat Neurosci. 2017. PMID: 28653689 No abstract available.

Abstract

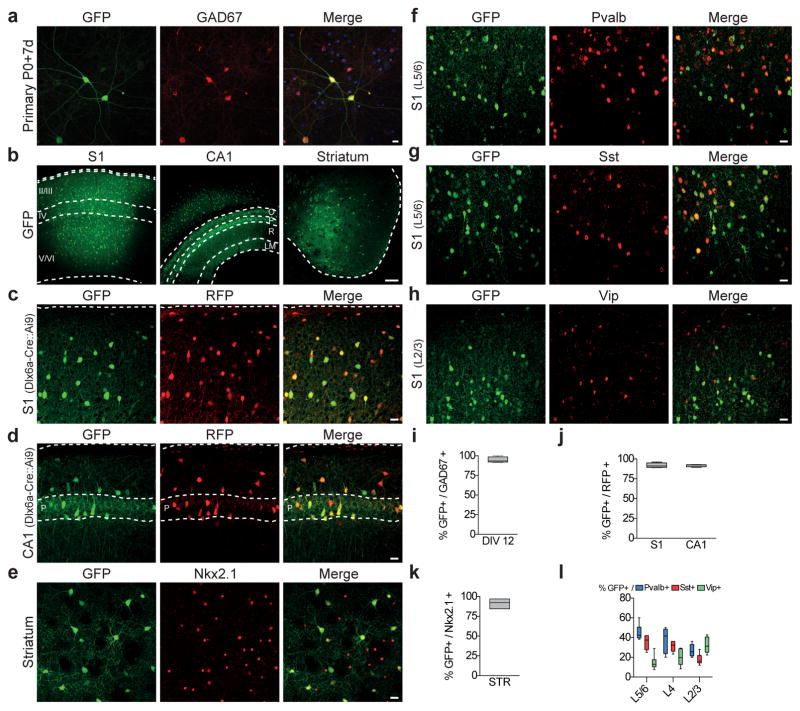
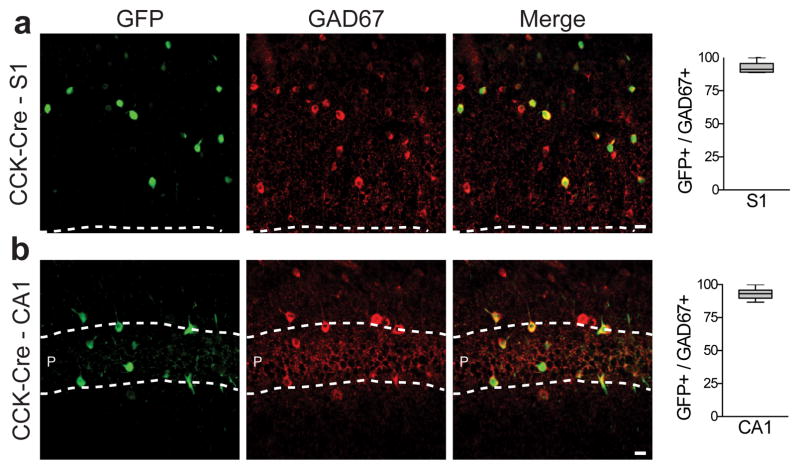
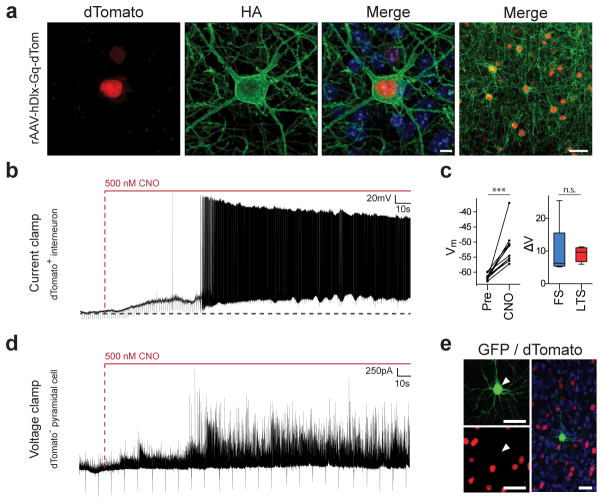
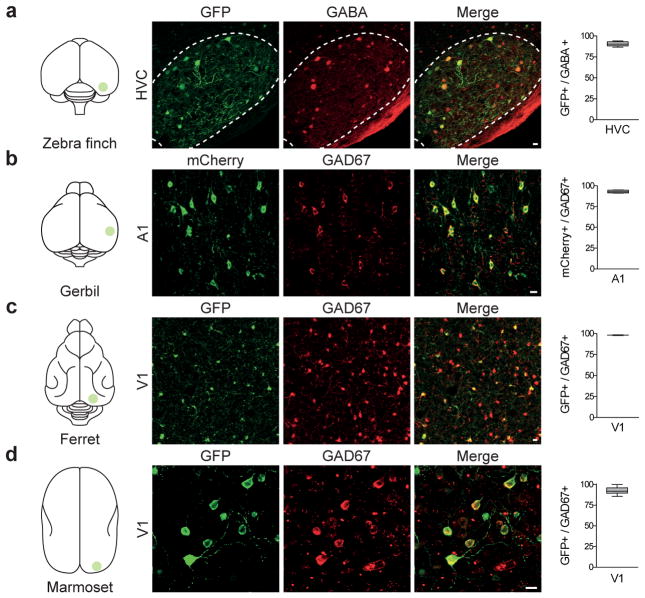
A fundamental impediment to understanding the brain is the availability of inexpensive and robust methods for targeting and manipulating specific neuronal populations. The need to overcome this barrier is pressing because there are considerable anatomical, physiological, cognitive and behavioral differences between mice and higher mammalian species in which it is difficult to specifically target and manipulate genetically defined functional cell types. In particular, it is unclear the degree to which insights from mouse models can shed light on the neural mechanisms that mediate cognitive functions in higher species, including humans. Here we describe a novel recombinant adeno-associated virus that restricts gene expression to GABAergic interneurons within the telencephalon. We demonstrate that the viral expression is specific and robust, allowing for morphological visualization, activity monitoring and functional manipulation of interneurons in both mice and non-genetically tractable species, thus opening the possibility to study GABAergic function in virtually any vertebrate species.


Conflict of interest statement

COMPETING FINANCIAL INTERESTS

The authors declare competing financial interests: The New York University Langone Medical Center has filed patent applications related to this work with J.D and G.F listed as inventors.

Figures

Figure 1
Figure 1. rAAV with mDlx enhancer restricts reporter expression to GABAergic interneurons
(a) P0 Primary cortical cultures were infected with rAAV-mDlx-GCaMP6f at DIV8 and analyzed at DIV 19 by immunostaining using GFP and GAD67 antibodies. Representative example of co-localization between GFP and GAD67 (quantitation of this is shown in i). (b–h) Adult C57Bl6 (n=16) or Dlx6aCre::Ai9 (n=4) mice were stereotactically injected with 50–100nl of rAAV-mDlx-GFP in (c) somatosensory cortex (S1), (d) hippocampus (CA1) and (e) striatum, and were analyzed by immuno-staining for the indicated markers after 7 days. Representative example of GFP expression and co-localization between GFP and the indicated marker in the indicated brain region. (i) Quantitation of co-localization of rAAV-mediated viral expression of GFP and GAD67 in DIV19 cultured cortical neurons (94.7 ± 1.8%, n=875 cells from 5 coverslips). (jl) Quantification of the proportion of cells co-expressing GFP and the indicated marker in the indicated anatomical regions. GFP/RFP, Dlx6a-Cre::Ai9, S1: 92.8 ± 1.2%, n= 657 cells from 4 animals; GFP/RFP, Dlx6a-Cre::Ai9, CA1: 91.8 ± 0.9%, n= 210 cells from 4 animals; GFP/NKX2.1, C57Bl6, Str: 36.4 ± 2.6%, n= 284 cells from 3 animals; GFP/PV, C57Bl6, S1: L2/3: 26.9 ± 2.5%; L4: 37.7 ± 5.1%; L5/6: 45.1 ± 3.2%; total n=577 from 3 animals; GFP/SST, C57Bl6, S1: L2/3: 17.8 ± 2.3%; L4: 32.3 ± 1.6%; L5/6: 35.4 ± 3.0%; total n=577 from 3 animals; GFP/VIP, C57Bl6, S1: L2/3: 32.6 ± 3.3%; L4: 20.0 ± 3.4%; L5/6: 14.6 ± 3.0%; total n=701 from 4 animals. Quantification are indicated in the text as mean ± s.e.m and are represented as box-and-whisker plot with upper and lower whiskers represent the maximum and minimum value respectively and the box represent upper, median and lower quartile. Dashed lines represent limits of the indicated anatomical structures. Roman numbers represent cortical layers, O - oriens, P - pyramidal, R - radiatum, LM - laconosum moleculare. Scale bars represent 10μm (a), 15μm (c–h) or 100μm (b).
Figure 2
Figure 2. rAAV-mDlx-Flex-GFP allows intersectional targeting of CCK-expressing interneurons
Adult CCK-Cre mice (n=4) were injected with rAAV-mDlx-Flex-GFP in somatosensory cortex (S1) or hippocampus (CA1) and were analyzed after 2 weeks by immunostaining for GAD67 immunoreactivity after 2 weeks. (a,b) Representative example of co-localization between GFP and GAD67 and corresponding quantifications (S1: 92.4 ± 1.4%, n= 319 cells from 4 animals; CA1: 93.2 ± 1.1%, n= 219 cells from 4 animals). Quantification are indicated in the text as mean ± s.e.m and are represented as box-and-whisker plot with upper and lower whiskers represent the maximum and minimum value respectively and the box represent upper, median and lower quartile. Dashed lines represent limits of the indicated anatomical structures. Scale bars represent 10μm.
Figure 3
Figure 3. rAAV-hDLX-Gq-DREADD allows chemogenetic modulation of interneuronal activity in mice
Adult C57Bl6 mice (n=18) were stereotactically injected with rAAV-hDlx-HA-Gq-DREADD-P2A-NLS-dTomato in somatosensory cortex and were either analyzed by immunostaining for the indicated markers after 7 days or sectioned for electrophysiological recording after 4 weeks. (a) Representative example of co-localization between dTomato and HA-tagged Gq-DREADD in somatosensory cortex layer VI. Note the expected membrane localization of the Gq-DREADD. (b) Effect of CNO on membrane potential and firing measured in current clamp configuration of a LTS interneuron. Horizontal dash line indicates baseline membrane potential (−60 mV). (c) Left panel: population data of effect of CNO on membrane potential. Average membrane potential (for a period of 25sec) 30min pre- and 2min post-CNO for individual cells (n=10 cells). Right panel: change in membrane potential for FS (10.2 ± 3.2mV, n=6 cells) and LTS cells (9.6 ± 0.7mV, n=4 cells). [AU QUERY: Please include test statistic and exact –values for these test] (d) Effect of CNO on inhibitory drive measured in voltage clamp configuration from a whole-cell recording of a pyramidal neuron within the area of viral infection. (e) Post-hoc immunostaining of a biocytin filled pyramidal neuron within the site of viral injection surrounded by interneurons infected by the rAAV-hDlx-HA-Gq-DREADD-P2A-NLS-dTomato. Nuclei were counterstained with Dapi (blue). Arrowheads point to the recorded cell. Unpaired T-test: *** = p-value <0.001, n.s. = non-significant. Quantification are indicated in the text as mean ± s.e.m and are represented as box-and-whisker plot with upper and lower whiskers represent the maximum and minimum value respectively and the box represent upper, median and lower quartile. Vertical dash lines in indicate CNO entry in the bath. Scale bars represent 5μm (a, left panels), or 20μm (a, right panel and e).
Figure 4
Figure 4. rAAV-mDlx is selectively expressed within GABAergic interneurons in various non-genetic model organisms
(a) Adult Zebra Finches (n=6) were injected with rAAV-mDlx-GFP in HVC, and analyzed by immunostaining for GABA immunoreactivity after 2–4 weeks. Representative example of co-localization between GFP and GABA and corresponding quantification (90.6 ± 1.1%, n=104 cells, 4 animals). (b) Adult Gerbils (n=4) were injected with rAAV-mDlx-ChR2-mCherry in V1, and analyzed by immunostaining for GAD67 immunoreactivity after 2–4 weeks. Representative example of co-localization between mCherry and GAD67 and corresponding quantification (94.0 ± 0.3%, n=318 cells, 4 sections from 1 animal). (c) Juvenile ferrets (n=4) were injected with rAAV-mDlx-GCaMP6f in V1, and analyzed by immunostaining for GAD67 immunoreactivity after 2 weeks. Representative example of co-localization between GFP and GAD67 and corresponding quantification (98.2 ± 0.5%, n=1647 cells, 2 animals). (d) A marmoset (n=1) was injected with rAAV-mDlx-GFP in the visual cortex (V1) and analyzed by immunostaining for GAD67 immunoreactivity after 3 months. Representative example of co-localization between GFP and GAD67 and corresponding quantification (92.6 ± 1.2%, n=215 cells, 3 sections from 1 animal). Quantification are indicated in the text as mean ± s.e.m and are represented as box-and-whisker plot with upper and lower whiskers represent the maximum and minimum value respectively and the box represent upper, median and lower quartile. Dashed lines represent limits of the indicated anatomical structures. Scale bars represent 10μm.
Figure 5
Figure 5. rAAV-Dlx restricts expression to interneurons derived from iPSCs and human embryonic stem cells
(a) Neuronal cultures derived from human iPSCs were inoculated with rAAV-mDlx-GFP at DIV50 and analyzed by immunostaining for GABA immunoreactivity 10 days after inoculation (10 DPI). Representative example of co-localization between GFP and GABA and corresponding quantification (92.3 ± 1.3%, n=307 cells, 6 coverslips from 2 independent experiments). (b) Co-culture of excitatory neurons derived from hESCs and GABAergic interneurons derived from a transgenic hESC line expressing Citrine under the control of Lhx6 promoter were inoculated with rAAV-hDlx-Gq-DREADD at day1 of co-culture. Cells expressing dTomato were analyzed by immunostaining for Citrine and α-Stem-121 immunoreactivity 21 days after inoculation (21 DPI). Representative example of co-localization between dTomato and Citrine and corresponding quantification (93.6 ± 0.3%, n=128 cells, 2 coverslips from 2 independent experiments). Quantification are indicated in the text as mean ± s.e.m and are represented as box-and-whisker plot with upper and lower whiskers represent the maximum and minimum value respectively and the box represent upper, median and lower quartile. White arrowheads represent cells expressing the reporter dTomato. Scale bar represents 10μm (a) and 20μm (b).

References

    1. Rudy B, Fishell G, Lee S, Hjerling-Leffler J. Three groups of interneurons account for nearly 100% of neocortical GABAergic neurons. Dev Neurobiol. 2011;71:45–61. - PMC - PubMed
    1. Marín O. Interneuron dysfunction in psychiatric disorders. Nat Rev Neurosci. 2012:1–14. doi: 10.1038/nrn3155. - DOI - PubMed
    1. Kepecs A, Fishell G. Interneuron cell types are fit to function. Nature. 2014;505:318–326. - PMC - PubMed
    1. Taniguchi H, et al. A Resource of Cre Driver Lines for Genetic Targeting of GABAergic Neurons in Cerebral Cortex. 2011;71:995–1013. - PMC - PubMed
    1. Nathanson JL, Yanagawa Y, Obata K, Callaway EM. Preferential labeling of inhibitory and excitatory cortical neurons by endogenous tropism of adeno-associated virus and lentivirus vectors. Neuroscience. 2009;161:441–450. - PMC - PubMed

Publication types