. 2017 Jan;20(1):107-114.
doi: 10.1038/nn.4433. Epub 2016 Oct 31.

The spatial structure of correlated neuronal variability

Affiliations

The spatial structure of correlated neuronal variability

Robert Rosenbaum et al. Nat Neurosci. 2017 Jan.

Abstract

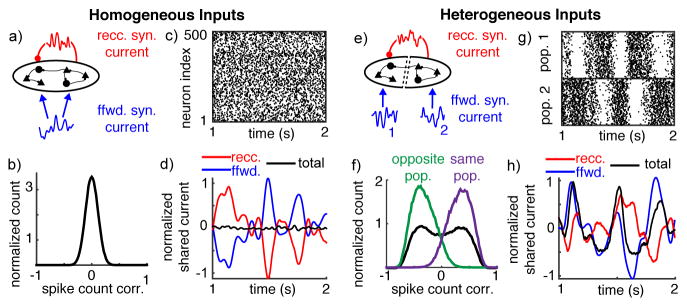
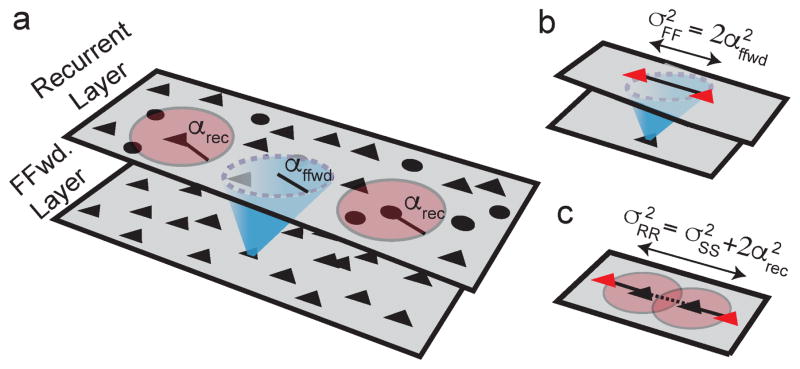
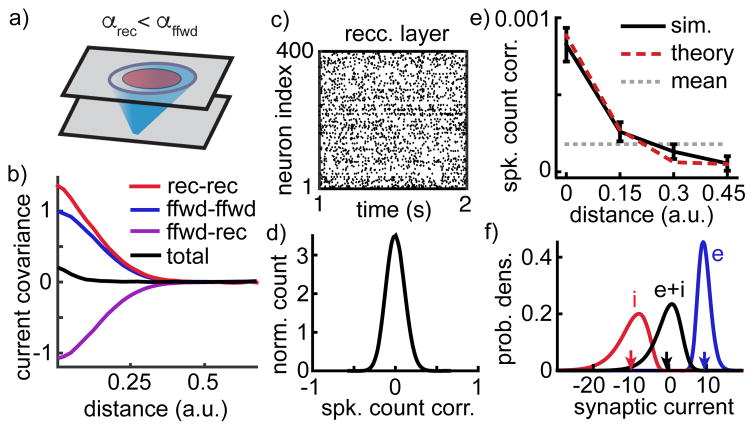
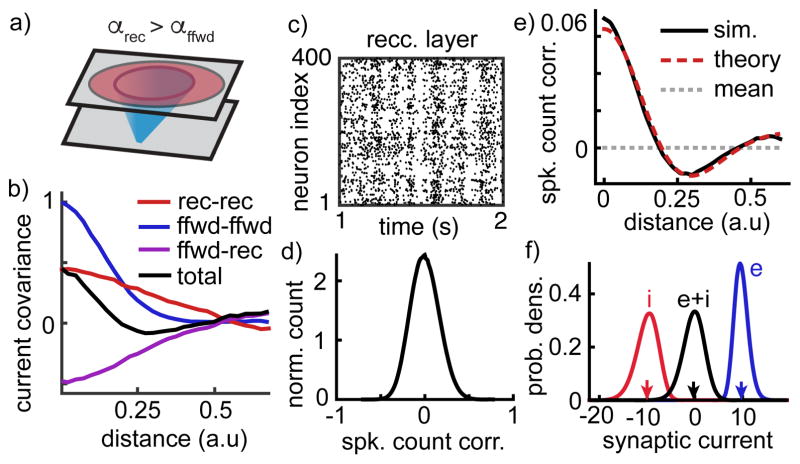
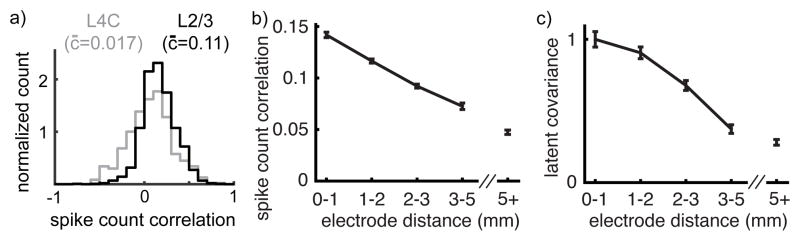
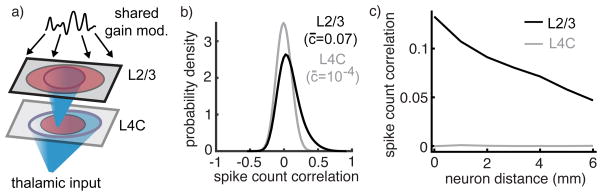
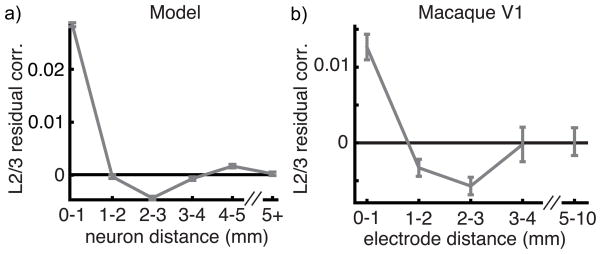
Shared neural variability is ubiquitous in cortical populations. While this variability is presumed to arise from overlapping synaptic input, its precise relationship to local circuit architecture remains unclear. We combine computational models and in vivo recordings to study the relationship between the spatial structure of connectivity and correlated variability in neural circuits. Extending the theory of networks with balanced excitation and inhibition, we find that spatially localized lateral projections promote weakly correlated spiking, but broader lateral projections produce a distinctive spatial correlation structure: nearby neuron pairs are positively correlated, pairs at intermediate distances are negatively correlated and distant pairs are weakly correlated. This non-monotonic dependence of correlation on distance is revealed in a new analysis of recordings from superficial layers of macaque primary visual cortex. Our findings show that incorporating distance-dependent connectivity improves the extent to which balanced network theory can explain correlated neural variability.


Conflict of interest statement

The authors declare no competing financial interests.

Figures

Figure 1
Figure 1. Heterogeneous feedforward input breaks asynchrony in balanced recurrent networks
a) Homogeneous network diagram. A population of 20,000 recurrently connected excitatory and inhibitory neurons receives globally correlated feedforward input. b) Normalized histogram of pairwise spike count correlations between 1000 randomly selected neurons. All histograms are normalized by their integral. c) Raster plot of 500 randomly chosen neurons plotted over 1 second. d) Shared fluctuations in the feedforward (blue) and recurrent (red) synaptic inputs cancel so that shared fluctuations in the total synaptic currents (black) are weak. Curves were computed by averaging the synaptic input currents to 500 neurons, convolving with a Gaussian-shaped kernel (σ = 15 ms), subtracting the mean and dividing by the neurons’ rheobase. e–h) Same as a–d except neurons were separated into two populations with separate feedforward inputs. Currents in (h) are from neurons within population 2. Histograms in (f) show correlations from neuron pairs randomly selected from both populations (black) from the same population (purple) and from opposite populations (green).
Figure 2
Figure 2. Correlation and projection widths in spatially extended networks
a) Network schematic. Black triangles and circles represent excitatory and inhibitory neurons. Red discs indicate recurrent synaptic projections. Recurrent connection probability decays with distance with width parameter αrec. Blue cone denotes feedforward synaptic projections from a separate layer, with width parameter αffwd. b) Correlations introduced by overlapping feedforward input to neurons in the recurrent layer (shared blue input to red triangles) decay with distance twice as slowly as feedforward connection probability (σ2FF = 2 α2ffwd). c) The spatial width, σ2RR, of correlations between two neurons’ recurrent inputs (input from black triangles to red triangles) is equal to width of spike train correlations (σ2SS, dashed line) plus twice the width of recurrent projections (2 α2rec, solid lines).
Figure 3
Figure 3. The asynchronous state in a spatially extended network model
a) Network schematic. As in Figure 2 with recurrent projections narrower than feedforward projections (αrec = 0.5 αffwd). b) Average covariance between different sources of synaptic currents to excitatory neuron pairs as a function of distance. Positive covariance between neurons’ feedforward input currents (blue) and between their recurrent input currents (red) cancel with negative covariance between one neuron’s feedforward and the other neuron’s recurrent input (purple) to produce weak covariance between their total input (black). Curves were computed from input currents to 400 randomly selected excitatory neurons and were normalized by the peak feedforward input covariance. c) Spike rasters of the 400 excitatory neurons comprising the center 20×20 square of neurons in the recurrent layer. d) Normalized histogram of pairwise spike count correlation between 5000 randomly selected neurons. e) Mean spike count correlation between neurons (±SEM) as a function of their distance. Solid black curve computed from the correlations between 5000 randomly sampled neurons. Dashed red curve is from mathematical calculations (see Supplementary Note S.1). Gray dashed line shows mean across all sampled pairs. f) Distribution of excitatory (blue), inhibitory (red) and total (black) synaptic currents across the membranes of 400 randomly selected excitatory neurons, measured in units of the neurons’ rheobase. Arrows indicate mean values.
Figure 4
Figure 4. Broad recurrent projections lead to a correlated balanced state
a–f) Same as Figure 3a–e except recurrent projections were changed to be broader than feedforward projections (αrec = 2.5 αffwd). This change prevented the recurrent network from canceling positive feedforward input correlations (b), resulting in population-wide spike count correlations with increased standard deviation (c,d) and with positive correlations between nearby neurons but negative correlations between more distant neurons (e). Nevertheless, the network maintains balance (f).
Figure 5
Figure 5. Dependence of correlations on layer and distance in macaque V1
a) Histogram of pairwise correlations between neurons in superficial (putative L2/3, black) and middle (putative L4C, gray) layers of macaque primary visual cortex. Legends give average correlation. b) Average pairwise correlation between putative L2/3 neurons (±SEM) as a function of the distance between the electrodes on which the neurons were recorded. c) Average latent covariance between putative L2/3 neurons (±SEM). Latent covariance was computed by averaging the entries of ccT computed using GPFA. Data points in (c) were normalized by the peak at 0–1 mm.
Figure 6
Figure 6. Dependence of correlations on layer and distance in a spatially extended, multi-layer network model
a) Network schematic. Thalamic input to L4C is broader than recurrent projections within L4C. Projections from L4C to L2/3 are narrower than recurrent excitatory (but not inhibitory) projections within L2/3. Neurons in L2/3 also receive a shared gain modulation. b) Histograms of pairwise correlations between randomly selected neurons in each layer. c) Average pairwise correlation between neurons in each layer as a function of the distance between the neurons.
Figure 7
Figure 7. Residual correlations in macaque V1 and in a model
a) Residual correlation between neurons within the model L2/3 network as a function of distance. b) Residual correlations between putative L2/3 neurons in macaque primary cortex (same data as Figure 5b). Residual correlation approximates spike count correlations after a single source of shared latent variability is removed. Both plots show mean ± SEM. Correlations decreased in the first two bins (p<10−12; un-paired t-test), increased from the third to fourth bin (p = 0.019) and from the third to the fifth bin (p = 0.0067).

Comment in

  • Correlations demystified.
    Latham PE. Latham PE. Nat Neurosci. 2016 Dec 27;20(1):6-8. doi: 10.1038/nn.4455. Nat Neurosci. 2016. PMID: 28025982 No abstract available.

References

    1. Ermentrout B. Neural networks as spatio-temporal pattern-forming systems. Reports on progress in physics. 1998;61:353.
    1. Faisal A, Selen L, Wolpert DM. Noise in the nervous system. Nat Rev Neurosci. 2008;9:292–303. - PMC - PubMed
    1. Pouget A, Beck JM, Ma WJ, Latham PE. Probabilistic brains: knowns and unknowns. Nature neuroscience. 2013;16:1170–1178. - PMC - PubMed
    1. Shamir M. Emerging principles of population coding: in search for the neural code. Current opinion in neurobiology. 2014;25:140–148. - PubMed
    1. Softky WR, Koch C. The highly irregular firing of cortical cells is inconsistent with temporal integration of random EPSPs. J Neurosci. 1993;13:334–50. - PMC - PubMed

Publication types