Multicenter Study
. 2016 Oct 31;11(10):e0165309.
doi: 10.1371/journal.pone.0165309. eCollection 2016.

Prospective, Multicentre, Nationwide Clinical Data from 600 Cases of Acute Pancreatitis

Affiliations
Multicenter Study

Prospective, Multicentre, Nationwide Clinical Data from 600 Cases of Acute Pancreatitis

Andrea Párniczky et al. PLoS One. .

Abstract

Objective: The aim of this study was to analyse the clinical characteristics of acute pancreatitis (AP) in a prospectively collected, large, multicentre cohort and to validate the major recommendations in the IAP/APA evidence-based guidelines for the management of AP.

Design: Eighty-six different clinical parameters were collected using an electronic clinical research form designed by the Hungarian Pancreatic Study Group.

Patients: 600 adult patients diagnosed with AP were prospectively enrolled from 17 Hungarian centres over a two-year period from 1 January 2013.

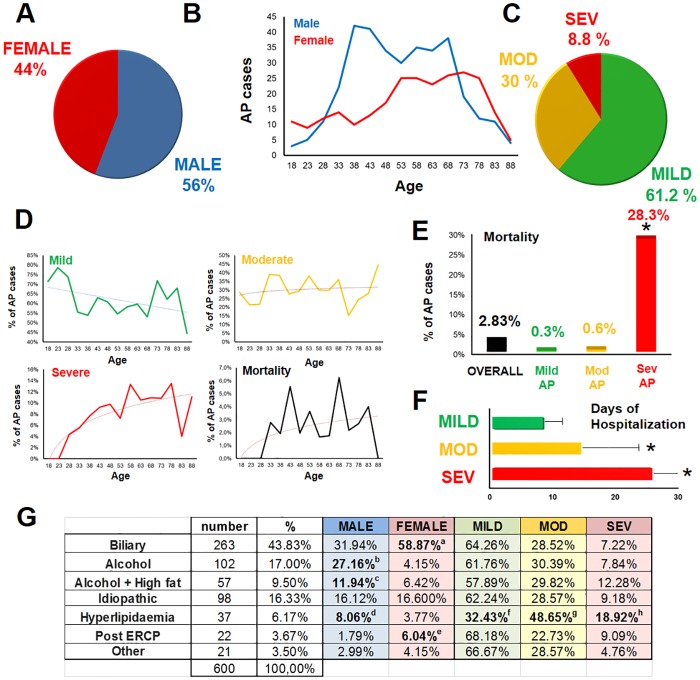
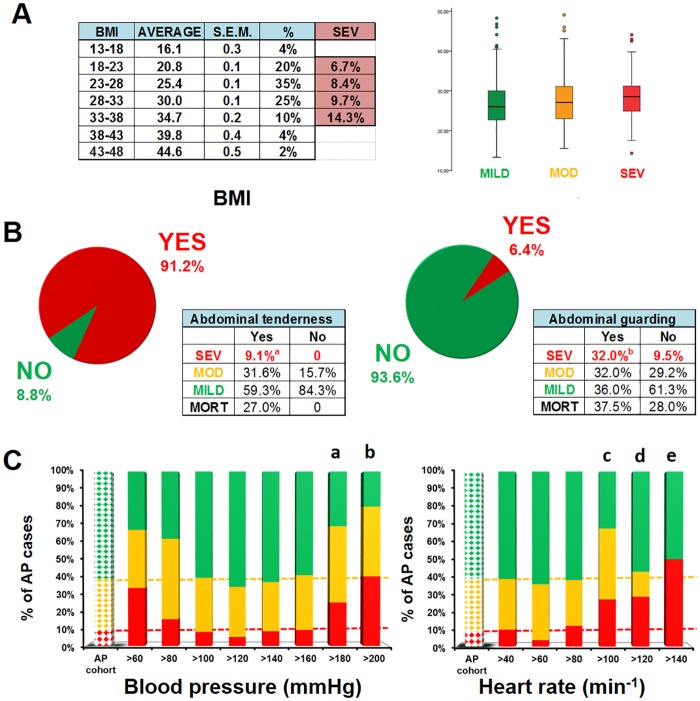
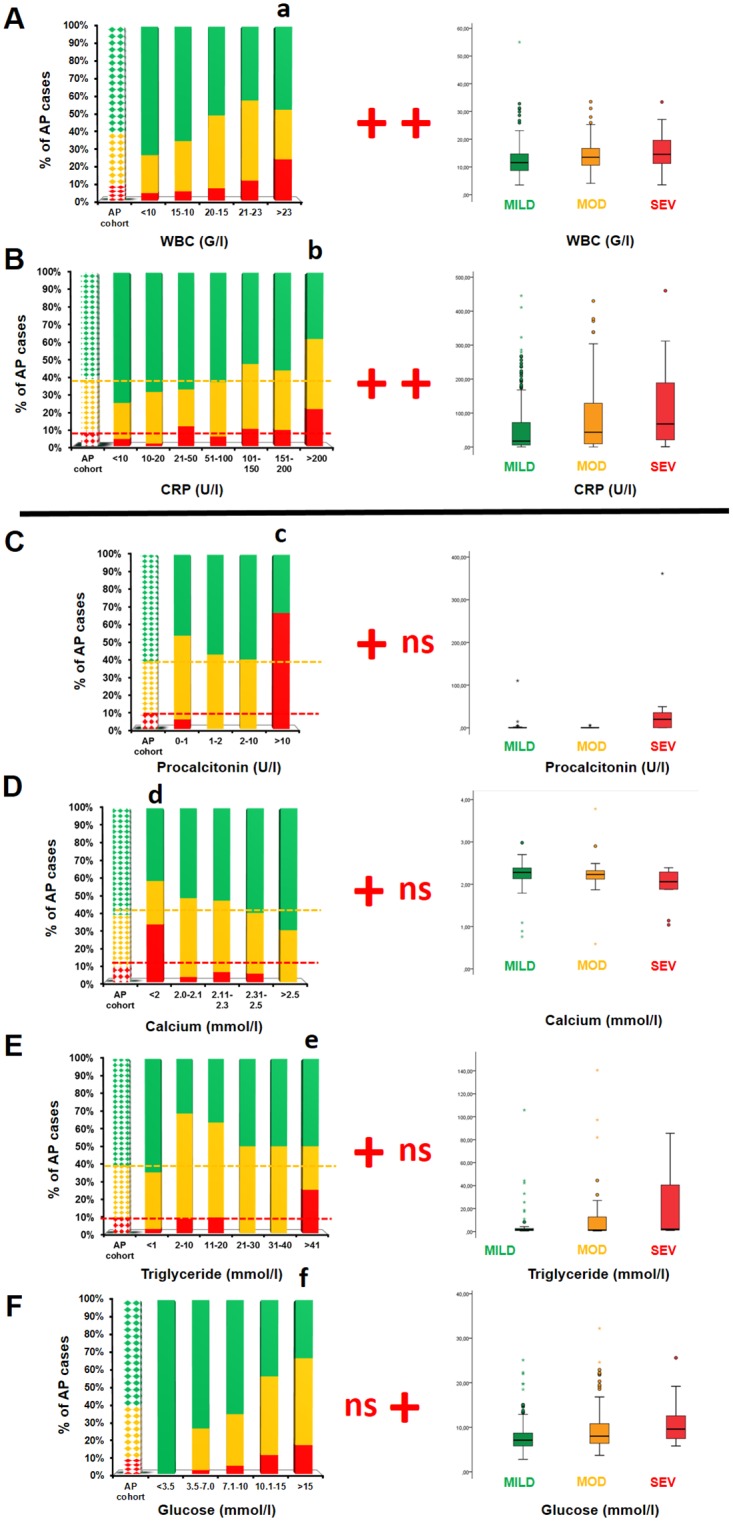
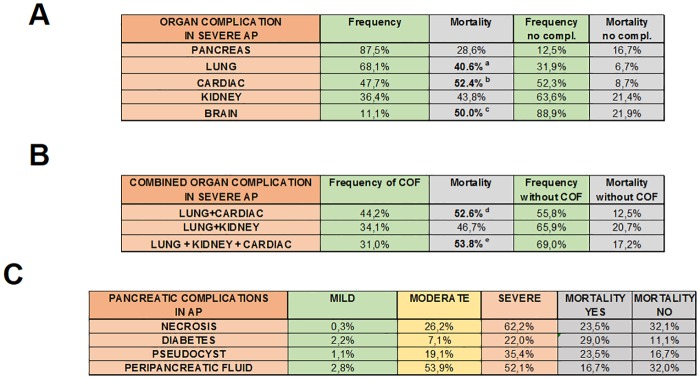
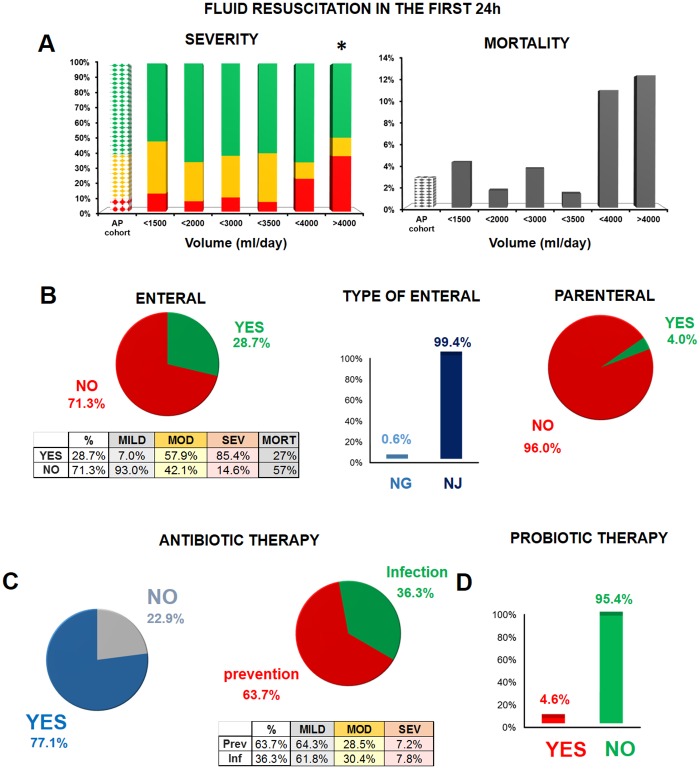
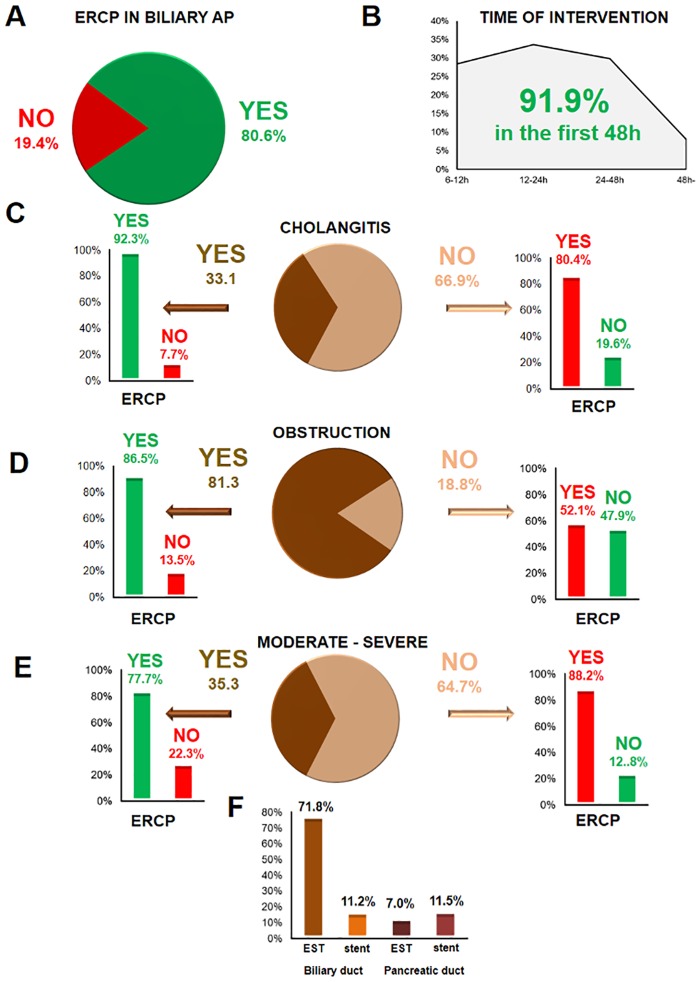
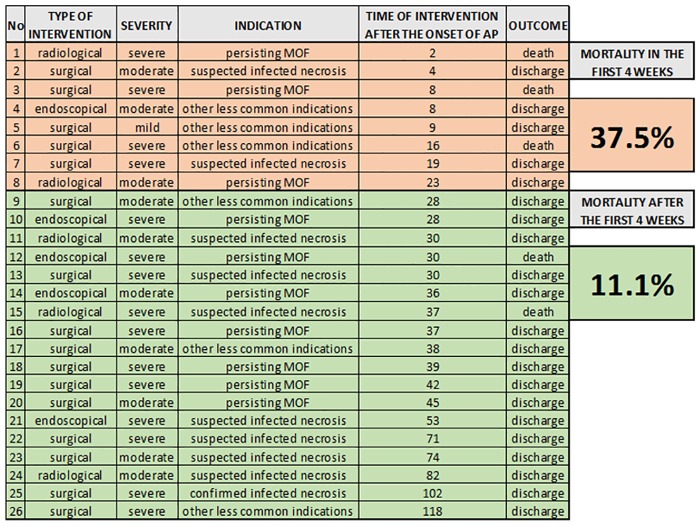
Main results: With respect to aetiology, biliary and alcoholic pancreatitis represented the two most common forms of AP. The prevalence of biliary AP was higher in women, whereas alcoholic AP was more common in men. Hyperlipidaemia was a risk factor for severity, lack of serum enzyme elevation posed a risk for severe AP, and lack of abdominal pain at admission demonstrated a risk for mortality. Abdominal tenderness developed in all the patients with severe AP, while lack of abdominal tenderness was a favourable sign for mortality. Importantly, lung injury at admission was associated with mortality. With regard to laboratory parameters, white blood cell count and CRP were the two most sensitive indicators for severe AP. The most common local complication was peripancreatic fluid, whereas the most common distant organ failure in severe AP was lung injury. Deviation from the recommendations in the IAP/APA evidence-based guidelines on fluid replacement, enteral nutrition and timing of interventions increased severity and mortality.

Conclusions: Analysis of a large, nationwide, prospective cohort of AP cases allowed for the identification of important determinants of severity and mortality. Evidence-based guidelines should be observed rigorously to improve outcomes in AP.


Conflict of interest statement

The authors have declared that no competing interests exist.

Figures

Fig 1
Fig 1. Epidemiology and aetiology.
A. Sex distribution of AP cases. B. Age distribution of AP cases. C. AP severity groups. Mod: moderate; sev: severe. D. Age distribution of mild, moderate and severe AP cases and mortality. E. Overall mortality and distribution in the severity groups. p<0.001 was between the severe and other groups according to Fisher’s exact test. F. Days of hospitalization. Mann-Whitney U test with Bonferroni correction was used to compare the group pairs (p<0.001 between groups). G. Aetiology of AP. (a: p<0.001; b: p<0.001; c: p = 0.022, d: p = 0.030; e: p = 0.006; f: p<0.001; g: p = 0.011; h: p = 0.025).
Fig 2
Fig 2. Diagnosis, anamnestic data and symptoms at admission.
A. Anamnestic data. The percentages of severe AP and mortality in severe AP are also shown in relation to alcohol consumption, smoking, diabetes and history of earlier AP. B. Relationship between time of onset of abdominal pain and presentation at ER units. C. Time of onset of abdominal pain and presentation at ER in the three severity groups and association with mortality in the severe group. D. Diagnosis. Distribution of diagnostic criteria in the overall cohort (pie chart) and in the three severity groups (table) and association with mortality in severe AP (table). P: pain; E: enzyme elevation; I: imaging alteration. O p = 0.189 (Fisher’s exact test) * p = 0.005 (Chi-square test) *** p<0.001 (Chi-square test). E. Type and localisation of abdominal pain. EPI: epigastric pain; URA: upper right abdomen; ULA: upper left abdomen; MD: middle abdomen; L: lower abdomen; D: diffuse. F. Symptoms in the entire cohort and in the severe AP group and association with mortality in the severe AP group. O p = 0.189 (Fisher’s exact test) OO p = 0.051 (Chi-square test) * p = 0.029 (Chi-square test).
Fig 3
Fig 3. Physical examination at admission.
A. Body Mass Index (BMI) in the three AP severity groups. BMI values for 90% of the cohort were between 18 and 38. Although the tendency suggests that a rise in BMI increases the risk for severe AP, statistical analyses showed no significant differences between the groups. B. Abdominal tenderness and guarding in the three AP severity groups. Both abdominal tenderness and guarding were more frequent in severe AP (a: p = 0.025; b: p<0.001; Chi-square test). Mortality in the severe AP group is shown. C. Systolic blood pressure and heart rate in the three AP severity groups. The first dotted column represents the entire cohort. Green: mild AP; yellow: moderate AP; red: severe AP. (a: p = 0.027; b: p = 0.016; c: p<0.001; d: p = 0.071; e: p = 0.042; Chi-square test).
Fig 4
Fig 4. Laboratory parameters in AP.
The only parameters shown are where statistical differences were found between the AP severity groups. Green: mild AP; yellow: moderate AP; red: severe AP; ns: no significant difference (p>0.05); +: significant difference (p<0.05). In the left-hand panel of graphs, laboratory parameters were analysed by distinct values, grouped in ranges. The first dotted column represents the AP severity groups of the entire cohort. Here, the Chi-square test was employed. In the right-hand panel of graphs, the average laboratory parameters were compared in the three AP severity groups. Here, we used the Kruskal–Wallis test and Mann–Whitney U test with a Bonferroni correction to compare the pairs of groups under examination. A. White blood cell count (WBC, n = 21–204). A WBC count above 23,000/μL was associated with elevated risk of severe AP (a: p = 0.020), and the average WBC counts also showed significant differences between the mild versus moderate and mild versus severe AP groups (p<0.001). B. C-reactive protein (CRP: n = 32–144). CRP above 200 mg/L was associated with severe AP (b: p = 0.007). In addition, average CRP levels differed significantly between the mild versus moderate and mild versus severe AP groups (p<0.001). C. Procalcitonin (PCT, n = 5–54). PCT levels above 10 U/L were associated with elevated risk of severe AP (c: p<0.001); however, average PCT levels did not differ significantly between the three AP severity groups (p = 0.143). D. Calcium (Ca, n = 12–40). Ca levels below 2 mmol/L were associated with a heightened risk of severe AP (d: p = 0.004); however, the average calcium levels did not differ significantly between the three AP severity groups (p = 0.077). E. Triglycerides (Tg: n = 10–48). Tg levels above 41 mmol/L were associated with greater risk of severe AP (e: p = 0.012); however, average Tg levels did not differ significantly between the three AP severity groups (p = 0.153). F. Glucose. (n = 3–175). Significant differences in severity associated with particular glucose levels were not found (f: p = 0.191); however, average glucose levels differed significantly between the mild versus moderate and mild versus severe AP groups (p<0.001).
Fig 5
Fig 5. Frequency of organ failure and mortality in AP.
A. Frequency of individual organ failure (pancreas, lung, cardiac, kidney and brain) and mortality in severe AP. B. Frequency of combined organ failure and mortality in severe AP. C. Frequency of pancreatic complications and mortality in AP. Mortality was only calculated in severe AP. a: p = 0.020 (Fisher’s exact test); b: p = 0.002 (Chi-square test); c: p = 0.043 (Fisher’s exact test); d: p = 0.003 (Chi-square test); e: p = 0.030 (Fisher’s exact test).
Fig 6
Fig 6. Conservative therapy in AP.
A. Effect of fluid resuscitation on severity and mortality in the first 24 hours. The first dotted column represents the AP severity groups and mortality for each group in the entire cohort. Green: mild AP; yellow: moderate AP; red: severe AP; *: p = 0.030 (Fisher’s exact test on severity) versus the cohort (n = 8–185). A polynomial regression curve was fitted to demonstrate the mortality trend (n = 8–185). B. Enteral and parenteral feeding in AP. Mortality is shown for the severe AP group. NG: nasogastric feeding; NJ: nasojejunal feeding. C. Antibiotic therapy and its indications in AP. Table shows the indications for antibiotic therapy in the three severity groups. D. Probiotic therapy in AP.
Fig 7
Fig 7. Endoscopic therapy in AP.
A. ERCP in biliary pancreatitis. B. Time of intervention after hospital admission. C–E. Indication for ERCP in the presence of cholangitis, obstruction, and moderate or severe AP. Unjustified ERCP (mild AP with neither cholangitis nor obstruction) was only performed in 3.8% of the cases. F. Interventions during ERCP. EST: endoscopic sphincterotomy.
Fig 8
Fig 8. Type, indication and outcome of interventions in AP.
Data show the mortality differences between early and late interventions in AP.

References

    1. Gompertz M, Lara I, Fernandez L, Miranda JP, Mancilla C, Watkins G, et al. [Mortality of acute pancreatitis in a 20 years period]. Rev Med Chil. 2013;141(5):562–7. Epub 2013/10/04. 10.4067/S0034-98872013000500002 S0034-98872013000500002 [pii]. . - DOI - PubMed
    1. Roberts SE, Akbari A, Thorne K, Atkinson M, Evans PA. The incidence of acute pancreatitis: impact of social deprivation, alcohol consumption, seasonal and demographic factors. Aliment Pharmacol Ther. 2013;38(5):539–48. Epub 2013/07/19. 10.1111/apt.12408 - DOI - PMC - PubMed
    1. Peery AF, Dellon ES, Lund J, Crockett SD, McGowan CE, Bulsiewicz WJ, et al. Burden of gastrointestinal disease in the United States: 2012 update. Gastroenterology. 2012;143(5):1179–87 e1–3. Epub 2012/08/14. 10.1053/j.gastro.2012.08.002 S0016-5085(12)01157-2 [pii]. - DOI - PMC - PubMed
    1. McKay CJ, Evans S, Sinclair M, Carter CR, Imrie CW. High early mortality rate from acute pancreatitis in Scotland, 1984–1995. Br J Surg. 1999;86(10):1302–5. Epub 1999/10/30. bjs1246 [pii] 10.1046/j.1365-2168.1999.01246.x . - DOI - PubMed
    1. Nawaz H, Mounzer R, Yadav D, Yabes JG, Slivka A, Whitcomb DC, et al. Revised Atlanta and determinant-based classification: application in a prospective cohort of acute pancreatitis patients. Am J Gastroenterol. 2013;108(12):1911–7. Epub 2013/10/16. 10.1038/ajg.2013.348 ajg2013348 [pii]. . - DOI - PubMed

Publication types