

The Role of Microbial Community Composition in Controlling Soil Respiration Responses to Temperature
- PMID: 27798702
- PMCID: PMC5087920
- DOI: 10.1371/journal.pone.0165448
The Role of Microbial Community Composition in Controlling Soil Respiration Responses to Temperature
Abstract
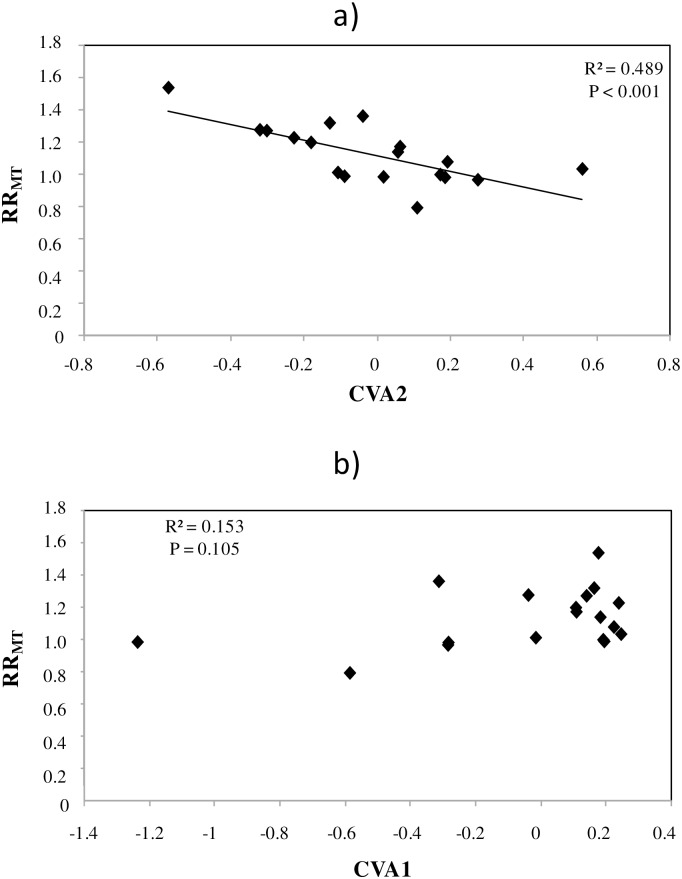
Rising global temperatures may increase the rates of soil organic matter decomposition by heterotrophic microorganisms, potentially accelerating climate change further by releasing additional carbon dioxide (CO2) to the atmosphere. However, the possibility that microbial community responses to prolonged warming may modify the temperature sensitivity of soil respiration creates large uncertainty in the strength of this positive feedback. Both compensatory responses (decreasing temperature sensitivity of soil respiration in the long-term) and enhancing responses (increasing temperature sensitivity) have been reported, but the mechanisms underlying these responses are poorly understood. In this study, microbial biomass, community structure and the activities of dehydrogenase and β-glucosidase enzymes were determined for 18 soils that had previously demonstrated either no response or varying magnitude of enhancing or compensatory responses of temperature sensitivity of heterotrophic microbial respiration to prolonged cooling. The soil cooling approach, in contrast to warming experiments, discriminates between microbial community responses and the consequences of substrate depletion, by minimising changes in substrate availability. The initial microbial community composition, determined by molecular analysis of soils showing contrasting respiration responses to cooling, provided evidence that the magnitude of enhancing responses was partly related to microbial community composition. There was also evidence that higher relative abundance of saprophytic Basidiomycota may explain the compensatory response observed in one soil, but neither microbial biomass nor enzymatic capacity were significantly affected by cooling. Our findings emphasise the key importance of soil microbial community responses for feedbacks to global change, but also highlight important areas where our understanding remains limited.
Conflict of interest statement
The authors have declared that no competing interests exist.
Figures


References
-
- Post WM, Emanuel WR, Zinke PJ, Stangenberger AG. Soil carbon pools and world life zones. Nature. 1982;298: 156–159.
-
- Jobbagy EG, Jackson RB. The vertical distribution of soil organic carbon and its relation to climate and vegetation. Ecological Applications. 2000;10: 424–436.
-
- Reay D, Grace J. Greenhouse Gas Sinks (eds Reay D. S. et al. ) 1–10 (CABI Publishing, Oxfordshire, 2007). 2007.
MeSH terms
Substances
LinkOut - more resources
Full Text Sources
Other Literature Sources
