. 2016 Oct 1;30(19):2199-2212.
doi: 10.1101/gad.284992.116.

Loss of Uhrf1 in neural stem cells leads to activation of retroviral elements and delayed neurodegeneration

Affiliations

Loss of Uhrf1 in neural stem cells leads to activation of retroviral elements and delayed neurodegeneration

Vidya Ramesh et al. Genes Dev. .

Abstract

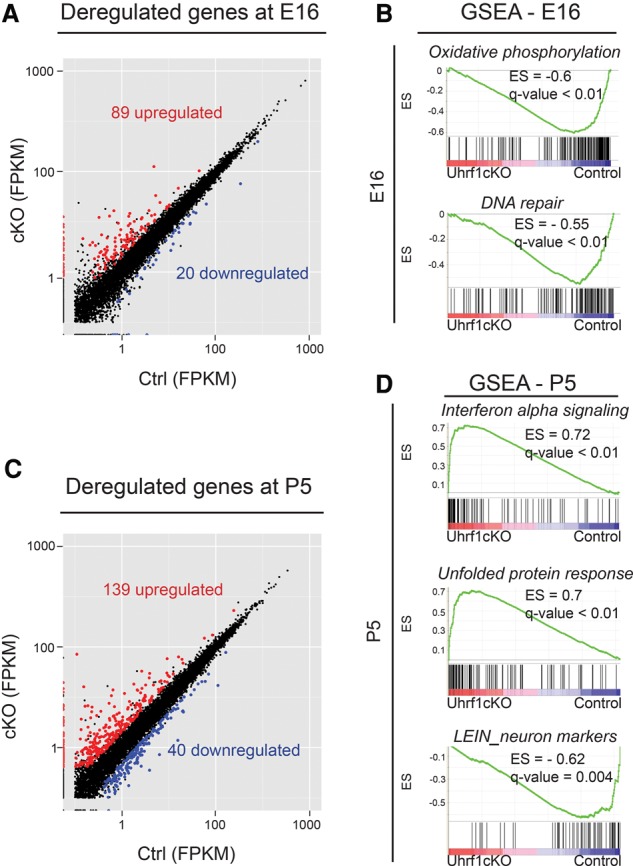
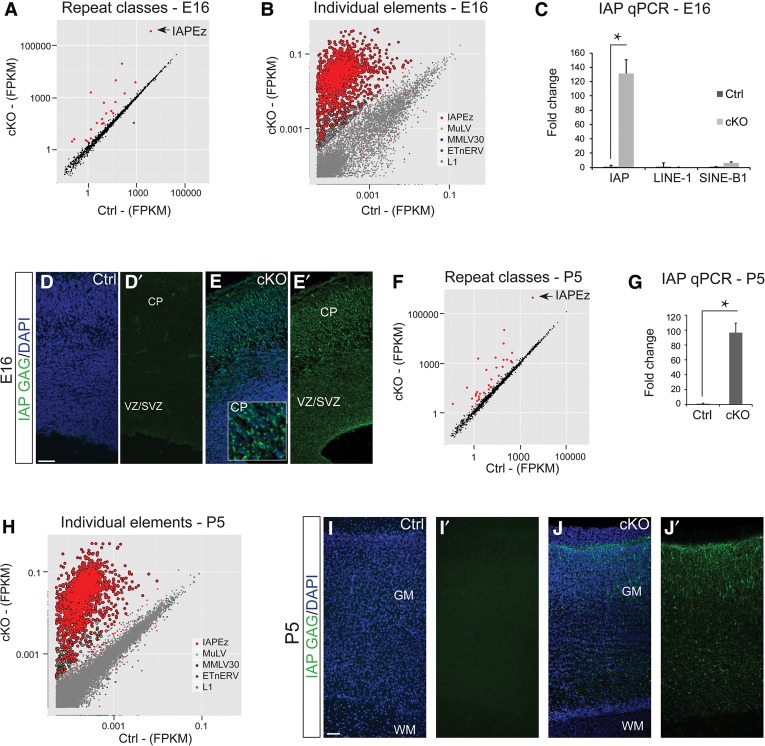
In order to understand whether early epigenetic mechanisms instruct the long-term behavior of neural stem cells (NSCs) and their progeny, we examined Uhrf1 (ubiquitin-like PHD ring finger-1; also known as Np95), as it is highly expressed in NSCs of the developing brain and rapidly down-regulated upon differentiation. Conditional deletion of Uhrf1 in the developing cerebral cortex resulted in rather normal proliferation and neurogenesis but severe postnatal neurodegeneration. During development, deletion of Uhrf1 lead to global DNA hypomethylation with a strong activation of the intracisternal A particle (IAP) family of endogenous retroviral elements, accompanied by an increase in 5-hydroxymethylcytosine. Down-regulation of Tet enzymes rescued the IAP activation in Uhrf1 conditional knockout (cKO) cells, suggesting an antagonistic interplay between Uhrf1 and Tet on IAP regulation. As IAP up-regulation persists into postnatal stages in the Uhrf1 cKO mice, our data show the lack of means to repress IAPs in differentiating neurons that normally never express Uhrf1 The high load of viral proteins and other transcriptional deregulation ultimately led to postnatal neurodegeneration. Taken together, these data show that early developmental NSC factors can have long-term effects in neuronal differentiation and survival. Moreover, they highlight how specific the consequences of widespread changes in DNA methylation are for certain classes of retroviral elements.

Keywords: 5hmC; IAP; Tet; neural stem cells; neuronal differentiation.


Figures

Figure 1.
Figure 1.
Immunostaining for Uhrf1 in the telencephalon from embryonic to adult stages. Confocal images of coronal sections of an E14 telencephalon (AD) and a P5 cerebral cortex (EG) as well as the subependymal zone (SEZ) (H,I) and dentate gyrus (J,K) of 2-mo-old mice stained as indicated. In F and G, white arrows indicate nuclei positive for only Uhrf1, while yellow arrows indicate Uhrf1/Ki67-double-positive nuclei. BrdU in I and K was given 1 h prior to analysis. Bars: F,G, 25 µm; all other panels, 50 µm. (IZ) Intermediate zone; (GM) gray matter; (WM) white matter; (LGE) lateral ganglionic eminence; (SGZ) subgranular zone.
Figure 2.
Figure 2.
Cortex-specific Uhrf1 cKO results in a delayed neurodegenerative phenotype. (A) Schematic drawing of a targeted allele in Uhrf1 floxed mice obtained from EUCOMM (European Conditional Mouse Mutagenesis Program). Green arrows indicate the positions of qPCR primers, red arrows are loxP sites flanking exon 4 of Uhrf1, and gray bars are exons. (B,C) Confocal images of coronal sections of E12 control (Ctrl; Emx1Cre+/− Uhrf1fl/+) (B) and E12 Uhrf1 cKO (cKO; Emx1Cre+/− Uhrf1fl/fl) (C) embryos showing a decrease of Uhrf1 immunostaining in the cKO cortex but not in the LGE. (DG) Confocal images of coronal sections of E14 (D,E) and P7 (F,G) cortices in control and cKO stained with DAPI showing the comparable thickness and cellular architecture of the E14 cerebral cortex (D,E), while the P7 cKO cerebral cortex is reduced in thickness (F,G). (H) Macroscopic image of the full brain of a 1-mo-old control and cKO. Note the prominent reduction of the cerebral cortex hemispheres in the cKO at the right. (IN) Confocal images of coronal sections of the cerebral cortex at 1 mo of age immunostained as indicated. (I,J) Images show pronounced thinning of the cKO cerebral cortex due to reduced NeuN+ neurons of all layers. (K–N) Images show reduction of both upper- and lower-layer neurons (Cux1 for the upper layers and FoxP2 for the lower layers). (OR) Confocal images of coronal sections of the cerebral cortex at E14 (O,P) and P2 (Q,R) stained for TUNEL and nuclei stained with DAPI. The insets show TUNEL+ cells in the cKO. (S) Histogram showing fold change of TUNEL+ cells in cKO cerebral cortices over controls at the times indicated from E12 to P7. Error bars indicate standard error of mean. n = 4 or 5 for all stages except P7, where n = 2. (*) Significance with P-value of <0.05. Bar, 50 µm. (UL) Upper layers; (LL) lower layer.
Figure 3.
Figure 3.
Transcriptional deregulation in Uhrf1 cKO cerebral cortices at embryonic and postnatal stages. (A) Graph showing deregulated genes at E16 in the cerebral cortex of cKO. Red dots indicate genes with significantly increased expression, while blue dots indicate genes with significantly reduced expression in the cKO cerebral cortex compared with controls. Significantly regulated genes have a P-value of <0.05 and fold change of >2. The X-axis and Y-axis values are FPKM from 100-base-pair (bp) paired-end RNA-seq. (B) Graphs showing gene set enrichment analysis (GSEA) at E16 on hallmark and curated data sets. Uhrf1 cKOs show underrepresentation of genes involved in oxidative phosphorylation and DNA repair. False discovery rate (FDR), <25%. (C) Graph showing RNA-seq results for coding genes from P5 cortices of cKOs compared with controls, as described for A. (D) Graphs showing GSEA at P5. (Top) Similar to E16, expression of genes involved in interferon α signaling is overrepresented also at P5 in cKO cortices. Genes involved in the unfolded protein response are also overrepresented (middle), and the LEIN neuron markers (curated data set) are underrepresented in expression in the P5 cKO (bottom). FDR, <25%.
Figure 4.
Figure 4.
Activation of IAP retroviral elements in Uhrf1 cKO cerebral cortices. (A) Graph depicting activation of classes of repeat elements in E16 cKO cerebral cortices. Red dots indicate repeat classes with significantly increased expression, and blue dots indicate repeat classes with significantly down-regulated expression in the cKO cerebral cortices compared with controls. The X-axis and Y-axis values are FPKM from 100-bp paired-end RNA-seq. (B) Graph depicting individual repeat elements in E16 cKO cerebral cortices. The X-axis and Y-axis values are FPKM from 100-bp paired-end RNA-seq. (C) RT-qPCR graph for IAP in E16 control and cKO cortices and L1 and SINE-B1 elements in E14 control and cKO cortices. (*) P-value = 0.01. n = 4 per condition. Error bars indicate standard error of mean. (D,E) Confocal images of coronal sections of E16 cortices of controls (D) and cKOs (E) immunostained for the Gag protein show a strong increase in immunoreactivitity in the cKO cortex (E). (F,H) Graph depicting activation of repeat classes (F) and individual repeat elements (H) in the P5 cKO cortex compared with the control cortex as described in A and B. (G) qPCR graph for IAP in P5 control and cKO cortices and L1 and SINE-B1 elements in P5 control and cKO cortices. (*) Significance with P-value of <0.0001. n = 4 for each condition. Error bars indicate standard error of mean. (I,J) Confocal images of coronal sections of P5 control (I) and cKO (J) cortices immunostained for the Gag protein, with high levels in the cKO cortex. Bar, 50 µm. (GM) Gray matter; (WM) white matter.
Figure 5.
Figure 5.
Changes in DNA methylation in Uhrf1 cKO cerebral cortices. (A,B) Confocal images of coronal sections of E14 control (A) and cKO (B) cerebral cortices stained for 5mC and DAPI. (B) Note that 5mC is much reduced in the cKO cortex but not LGE. (C) Restriction digests of E16 genomic DNA from controls and Uhrf1 cKO digested with HpaII and MspI and analyzed on a 0.5% agarose gel. (1 kb) One-kilobase DNA ladder. Note that both enzymes recognize the CCGG sequence; however, HpaII is unable to cut DNA when the internal cytosine is methylated. As much more DNA was cut in the Uhrf1 cKO samples, this indicates less DNA methylation upon Uhrf1 deletion. (D,E) Ox-RRBS in E16 control and cKO cortices, with graphs depicting the percentage of regions hypomethylated (X-axis) per chromosome (Y-axis) (D) and the percentage of hypomethylation in each repeat element class (E). Error bars indicate standard error of mean between the values from each independent element from each class. (F) Ox-BS in E16 control and cKO cortices showing a loss of 5mC in Uhrf1 cKO cortices. High-throughput sequencing was performed on the IAP Gag region and L1. The plot displays 27 CpGs present on IAP Gag loci, nine CpGs present on L1 loci, and their methylation status. The Y-axis indicates the percentage of methylation, and the X-axis indicates individual CpGs. (*) P-value ≤ 0.001; (**) P-value < 0.0001.
Figure 6.
Figure 6.
Mechanisms of IAP activation in the Uhrf1 cKO cerebral cortices. (AD) Confocal images of coronal sections of E14 (A,B) and E16 (C,D) control and cKO cortices immunostained for 5hmC. (E) Graph depicting repeat element classes in hmeDIP of E16 VZ tissue. The X-axis and Y-axis values are log2 fold enrichment for controls and cKOs from 50-bp single-end DNA sequencing. P-value < 0.05. Red dots indicate significantly up-regulated classes in the cKO with a greater than twofold change. (F) Plot of hmeDIP peaks on IAP in E16 VZ control and cKO. The Y-axis indicates RPKM (reads per kilobase per million mapped reads) values, and the X-axis indicates the IAP sequence. (G) Epifluorescence images of NSCs immunostained for Uhrf1 and DAPI in conditions without Cre and with Cre protein added to the cultures. (H) qPCR for Uhrf1 showing strong down-regulation of Uhrf1 mRNA 4 d after Cre protein addition to the cultures. (*) P-value = 0.02. n = 4 for −Cre; n = 8 for +Cre. Error bars indicate standard error of mean. (I) Graph indicating loss of 5mC on IAP Gag and L1 loci in Uhrf1 floxed NSCs. High-throughput sequencing was performed on IAP and L1. The plot displays 27 CpGs present on IAP Gag loci, nine CpGs present on L1 loci, and their methylation status. (*) P-value ≤ 0.001; (**) P-value < 0.0001. (J) Graph indicating the percentage gain of 5hmC on IAP and L1 in Uhrf1 floxed NSCs with and without Cre protein and E16 Uhrf1 cKO cortical tissue compared with controls. The Y-axis indicates the percentage gain of 5hmC. (K) qPCR for IAP showing much reduced expression in the Tet2/3 shRNA condition compared with scrambled shRNA. Uhrf1 floxed NSCs were transfected with scrambled shRNA or Tet2/3 shRNA and simultaneously treated with Cre protein. qPCR was performed after 4 d in vitro. (*) Significance. Unpaired t-test P-value of 0.02 for no Cre versus Cre/scrambled; paired t-test P-value of 0.04 for Cre/scrambled versus Cre/Tet2,3 shRNA. n = 4 for each condition. Error bars indicate standard error of mean. (L) qPCR for IAP showing much reduced expression in the Tet2/3 shRNA GFP-positive cells compared with GFP-negative cells in vivo. Uhrf1 cKO embryos were electroporated at E13, and the GFP-positive and GFP-negative cells were isolated by FACS 3 d later. (*) P-value = 0.02, paired t-test. Error bars indicate standard error of mean. Paired statistical analysis was performed on these data, since the cells were from the same embryo either transfected or untransfected. Moreover, each pair of control and cKO showed a similar trend, with high variation between replicate pairs. (M) Model of IAP regulation in controls and Uhrf1 cKOs. In controls, IAP is highly methylated by Uhrf1, preventing access for Tet and possibly certain transcription factors to the IAP loci. In Uhrf1 cKOs, the absence of Uhrf1 leads to reduced 5mC, increased 5hmC and Tet activity, and possibly increased access for transcription factors. This allows transcription from the IAP locus. Bar, 50 µm. (TF) Transcription factor; (MBP) methylated DNA-binding protein.

References

    1. Babbio F, Pistore C, Curti L, Castiglioni I, Kunderfranco P, Brino L, Oudet P, Seiler R, Thalman GN, Roggero E, et al. 2012. The SRA protein UHRF1 promotes epigenetic crosstalks and is involved in prostate cancer progression. Oncogene 31: 4878–4887. - PubMed
    1. Beckervordersandforth R, Tripathi P, Ninkovic J, Bayam E, Lepier A, Stempfhuber B, Kirchhoff F, Hirrlinger J, Haslinger A, Lie DC, et al. 2010. In vivo fate mapping and expression analysis reveals molecular hallmarks of prospectively isolated adult neural stem cells. Cell Stem Cell 7: 744–758. - PubMed
    1. Berkyurek AC, Suetake I, Arita K, Takeshita K, Nakagawa A, Shirakawa M, Tajima S. 2014. The DNA methyltransferase Dnmt1 directly interacts with the SET and RING finger-associated (SRA) domain of the multifunctional protein Uhrf1 to facilitate accession of the catalytic center to hemi-methylated DNA. J Biol Chem 289: 379–386. - PMC - PubMed
    1. Booth MJ, Branco MR, Ficz G, Oxley D, Krueger F, Reik W, Balasubramanian S. 2012. Quantitative sequencing of 5-methylcytosine and 5-hydroxymethylcytosine at single-base resolution. Science 336: 934–937. - PubMed
    1. Bostick M, Kim JK, Esteve PO, Clark A, Pradhan S, Jacobsen SE. 2007. UHRF1 plays a role in maintaining DNA methylation in mammalian cells. Science 317: 1760–1764. - PubMed

MeSH terms