. 2016 Oct 1;30(19):2213-2225.
doi: 10.1101/gad.285726.116.

Post-transcriptional control of executioner caspases by RNA-binding proteins

Affiliations

Post-transcriptional control of executioner caspases by RNA-binding proteins

Deni Subasic et al. Genes Dev. .

Abstract

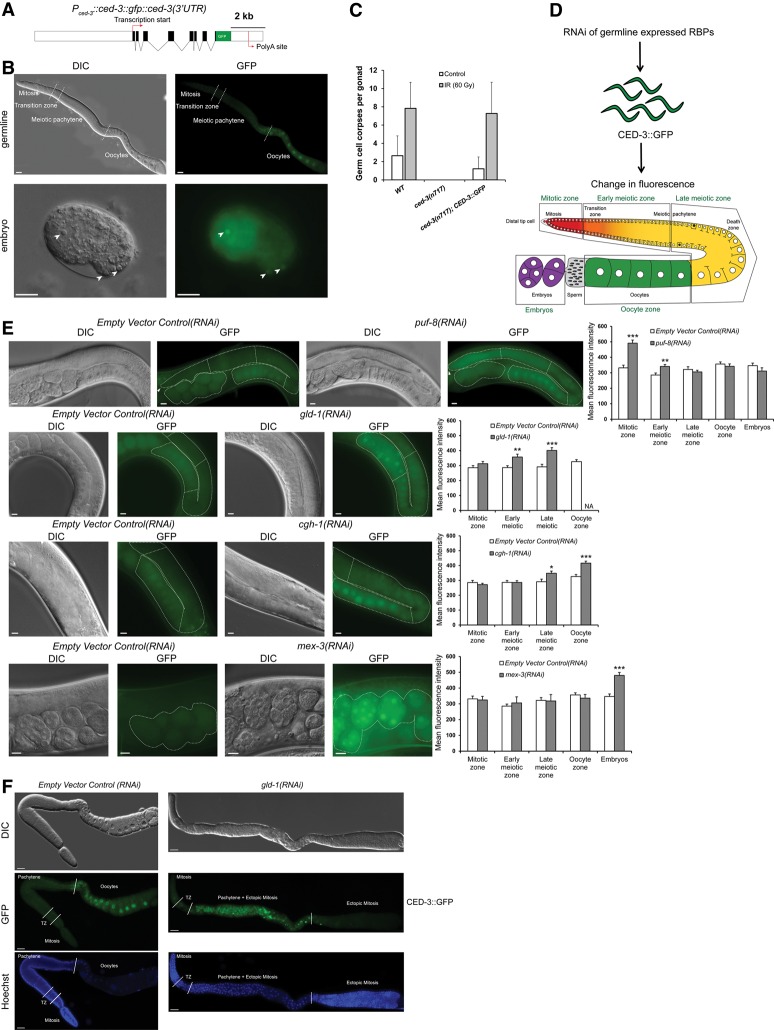
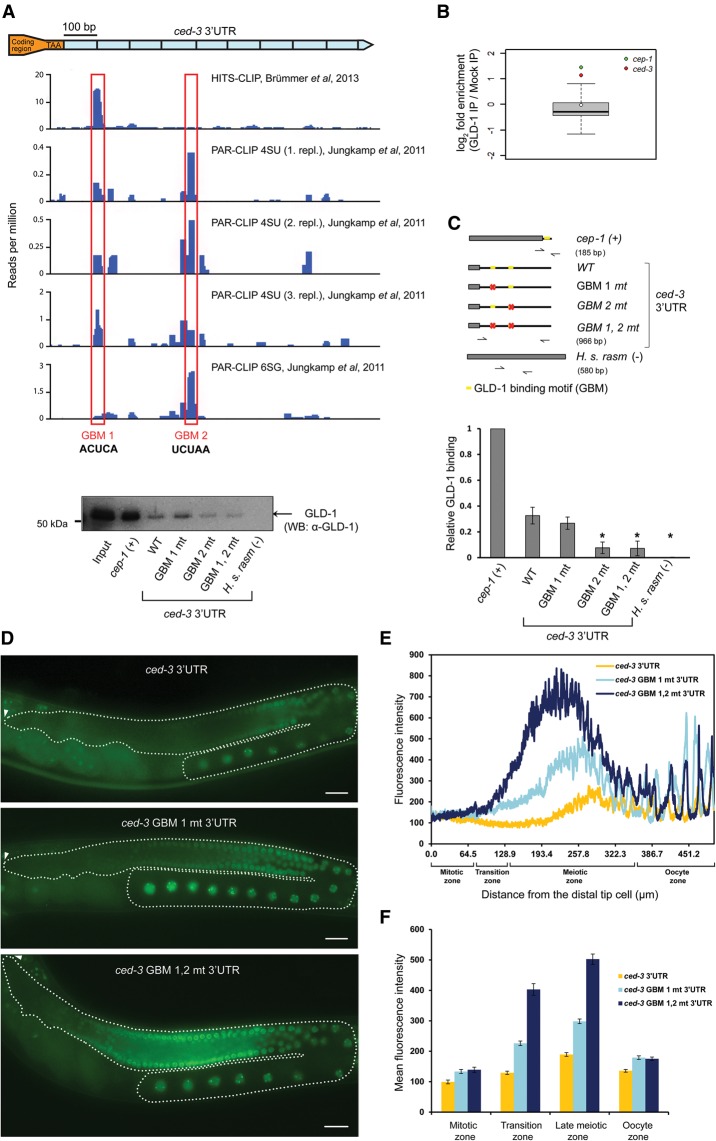
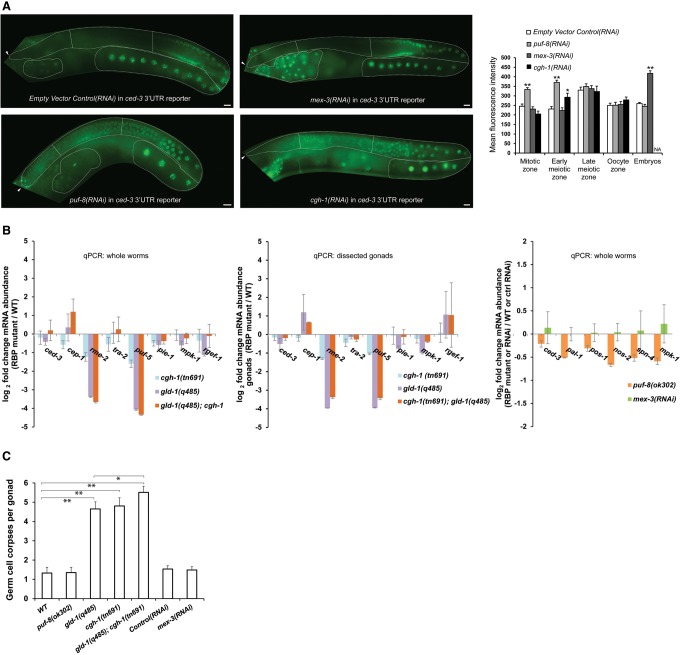
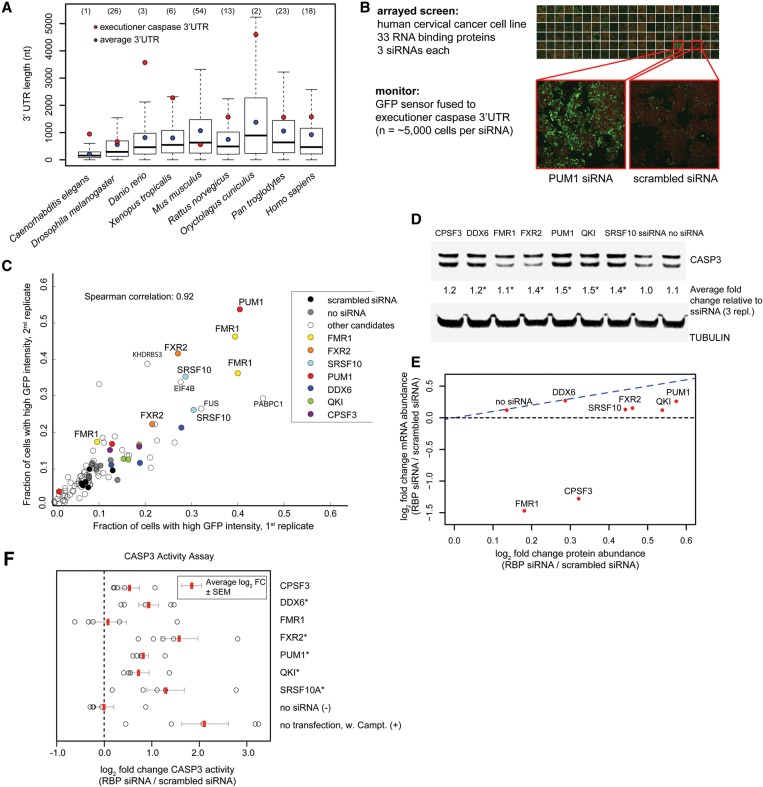
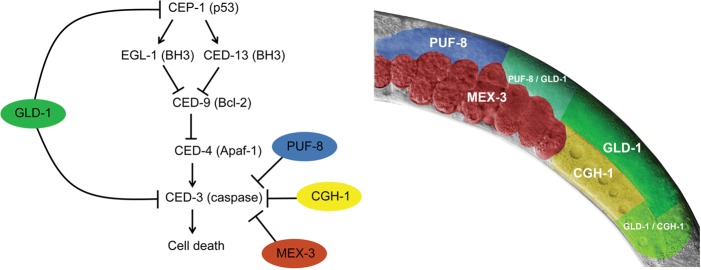
Caspases are key components of apoptotic pathways. Regulation of caspases occurs at several levels, including transcription, proteolytic processing, inhibition of enzymatic function, and protein degradation. In contrast, little is known about the extent of post-transcriptional control of caspases. Here, we describe four conserved RNA-binding proteins (RBPs)-PUF-8, MEX-3, GLD-1, and CGH-1-that sequentially repress the CED-3 caspase in distinct regions of the Caenorhabditis elegans germline. We demonstrate that GLD-1 represses ced-3 mRNA translation via two binding sites in its 3' untranslated region (UTR), thereby ensuring a dual control of unwanted cell death: at the level of p53/CEP-1 and at the executioner caspase level. Moreover, we identified seven RBPs that regulate human caspase-3 expression and/or activation, including human PUF-8, GLD-1, and CGH-1 homologs PUM1, QKI, and DDX6. Given the presence of unusually long executioner caspase 3' UTRs in many metazoans, translational control of executioner caspases by RBPs might be a strategy used widely across the animal kingdom to control apoptosis.

Keywords: CED-3; GLD-1; RNA-binding proteins; apoptosis; caspase; caspase-3; translational control.


Figures

Figure 1.
Figure 1.
RNAi screen for CED-3 regulators identified four conserved RBPs (PUF-8, GLD-1, CGH-1, and MEX-3) that negatively regulate CED-3 expression in different regions of the germline. (A) Structure of the reporter fusion with GFP [Pced-3::ced-3(genomic)::gfp::ced-3(3′ UTR)] used in this study. The promoter and 3′ untranslated region (UTR) elements are marked as white boxes, exons are marked as black boxes, and introns are marked as lines. (B) The CED-3 translational reporter (CED-3::GFP) shows germline and embryonic expression. Differential interference contrast (DIC) and GFP images of an adult germline and an embryo expressing CED-3::GFP are shown. White arrowheads indicate apoptotic corpses in the embryo enriched in CED-3 expression. Bar, 10 µm. (C) The CED-3::GFP translational reporter rescues the absence of physiological and irradiation-induced germ cell death in ced-3(n717) mutants. Error bars represent SD from two independent experiments. n = 25 animals per experiment. (D) Scheme of RNAi screen via feeding used to identify germline-expressed RBPs that regulate CED-3 expression. Four different germline areas (the mitotic, early meiotic, late meiotic, and oocyte zones) and fertilized embryos were monitored for change in fluorescence. (E) DIC and GFP images of the four positives from the screen that altered CED-3 expression: PUF-8 in the mitotic and early meiotic zones, GLD-1 in the early and late meiotic zones, CGH-1 in the late meiotic and oocyte zones, and MEX-3 in embryos. Empty vector control(RNAi) was used as a control. Average mean GFP fluorescence intensity was quantified in the five zones in 10–20 animals. Dashed lines outline the gonads, and arrowheads indicate the positions of the distal tip cells. Different zones selected for quantification (as in D) are separated with straight dashed white lines. Error bars represent SEM. n ≥ 10. Asterisks represent the P-value for a paired t-test comparing the reporter GFP intensity in RBP(RNAi)-treated and empty vector control(RNAi)-treated animals. (*) P < 0.05; (**) P < 0.01; (***) P < 0.001. Bar, 10 µm. (F) DIC, GFP, and Hoechst images of dissected gonads show increased CED-3::GFP expression in the meiotic pachytene region but not in the tumorous ectopic proliferative zone of fully depleted gld-1(RNAi) animals carrying the CED-3::GFP reporter. Bar, 10 µm. See also Supplemental Figures S2 and S4.
Figure 2.
Figure 2.
Two GBMs in the ced-3 3′ UTR mediate ced-3 mRNA repression by GLD-1. (A) GLD-1 binds to the ced-3 3′ UTR: HITS-CLIP of GLD-1::STREP/HA (Brümmer et al. 2013) and PAR-CLIP of GLD-1::GFP::Flag (Jungkamp et al. 2011) identified two candidate GBMs in the ced-3 3′ UTR. (B) Following GLD-1 immunoprecipitation, ced-3 mRNA showed a level of enrichment similar to that of the p53 tumor suppressor homolog cep-1, a known GLD-1 target (Schumacher et al. 2005). Data are from Scheckel et al. (2012). (C) The two GBMs are essential for GLD-1 binding to the ced-3 3′ UTR in vitro. Wild-type and GBM-mutated ced-3 3′ UTRs were biotinylated and tested for their ability to interact with GLD-1 from worm extracts. The constructs used are shown at the left. cep-1 was used as a positive control, and human rasm was used as a negative control. GLD-1's presence in the immunoprecipitation sample was verified by Western blot with monoclonal anti-GLD-1 antibodies. The right chart shows relative GLD-1 binding as measured by band intensity quantification obtained from four independent Western blot experiments. An asterisk represents the P-value for a paired t-test comparing the construct with wild-type ced-3 3′ UTR binding. (*) P < 0.005. (D) GBM mutations caused a strong increase of GFP::H2B expressions in the meiotic region of the germline. GFP images of adult gonads expressing GFP::H2B fused to either a wild-type ced-3 3′ UTR [Ppie-1::gfp::h2b::ced-3(3UTR)] or a ced-3 3′ UTR in which one (ced-3 GBM 1 mt 3′ UTR) or both (ced-3 GBM 1,2 mt 3′ UTR) GBMs were mutated. Dashed lines outline the gonads, and arrowheads indicate the positions of the distal tip cells. Bar, 20 µm. (E) Quantification of GFP::H2B fluorescence intensity in ced-3 3 3′ UTR reporters as a function of distance from the distal tip cell shows additive contribution of the two GBMs in ced-3 repression. Average fluorescence intensities of three animals are plotted. (F) Mean fluorescence intensity in the four distinct areas of the germline of ≥15 animals. Error bars represent SEM. n ≥ 15. See also Supplemental Figure S3.
Figure 3.
Figure 3.
Failure to translationally repress ced-3 in the death zone is associated with increased germ cell death apoptosis. (A) ced-3 3′ UTR is sufficient for exerting the PUF-8- and MEX-3-mediated repression of ced-3 expression. GFP images of adult gonads expressing the ced-3 3′ UTR reporter [Ppie-1::gfp::h2b::ced-3(3UTR)] treated with empty vector control(RNAi), puf-8(RNAi), mex-3(RNAi), and cgh-1(RNAi). Gonads are outlined with a dashed line, and arrowheads indicate the positions of the distal tip cells. Average mean fluorescence intensities measured in the four germline zones and fertilized embryos are plotted at the right. Different zones selected for quantification are separated with straight dashed white lines. Error bars represent SEM. n ≥ 10. Asterisks indicate significant P-values. (*) P < 0.05; (**) P < 0.00001. Bar, 10 µm. (B) gld-1(q485), cgh-1(tn691), gld-1(q485);cgh-1(tn691), puf-8(ok302), and mex-3(RNAi) animals show no changes in ced-3 mRNA abundance. (Charts 1,2) Quantitative RT–PCR (qRT–PCR) of known GLD-1 targets (cep-1, rme-2, tra-2, puf-5, pie-1, and mpk-1) (Wright et al. 2011) and a negative control rgef-1, a pan-neuronally expressed transcript in whole animals and gonads, respectively. As reported previously, GLD-1 and CGH-1 stabilize certain mRNA targets (rme-2 and puf-5) important for oocyte-to-embryo transition (Scheckel et al. 2012). (Chart 3) qRT–PCR of potential PUF-8 targets (pal-1, pos-1, spn-4, and mpk-1) and of the MEX-3 target nos-2 (Pagano et al. 2009; Mainpal et al. 2011; Pushpa et al. 2013) on whole animals. Results were normalized to a set of housekeeping and stably behaving transcripts (pgk-1, cdc-42, and Y45F10). mex-3(RNAi) data were compared with the empty vector control(RNAi). Error bars indicate SD from three (charts 1 and 2) and two (chart 3) biological replicates. (C) Physiological germ cell apoptosis is increased in gld-1(q485)-treated, cgh-1(tn691)-treated, and gld-1(q485);cgh-1(tn691)-treated but not in puf-8(ok302)-treated and mex-3(RNAi)-treated animals. Error bars represent SD from three independent experiments. n ≥ 15 animals per experiment. Asterisks indicate significant P-values from paired t-tests. (*) P < 0.05; (**) P < 0.0001.
Figure 4.
Figure 4.
Post-transcriptional regulation of human CASP3. (A) Executioner caspase 3′ UTRs are unusually long. Box plots show the distribution of 3′ UTR lengths across animal phyla. 3′ UTR lengths of executioner caspases (ced-3 in C. elegans, drICE in Drosophila, and caspase-3 in other species) are marked with a red dot. Median 3′ UTR length is represented with a line, average 3′ UTR is represented with a blue dot, and the whiskers extend to the most extreme data point, which is no more than 1.5 times the interquartile range from the box. Percentiles for the executioner caspase 3′ UTR length within a species are given in the parentheses above each organism. 3′ UTR lengths were extracted from the Ensemble Genes 75 database. (B) Image-based siRNA screen for post-transcriptional regulation of the caspase-3 3′ UTR. HeLa cells were treated with siRNAs against 33 RBPs. Caspase-3 levels were measured using the GFP::caspase-3 3′ UTR reporter (green), and cell outlines were detected by succinimidyl ester (red). (C) The fraction of cells with elevated level of GFP::caspase-3 3′ UTR reporter following knockdown of RBP. Three different siRNAs (represented as points) were used per gene. (D) Western blot of total CASP3 levels upon siRNA-mediated knockdown of candidate RBPs. The average fold changes in total CASP3 abundance following siRNA relative to scrambled siRNA and normalized to tubulin are shown. n = 3 biological replicates. (*) P < 0.05, paired t-test. (E) Comparison of mean caspase-3 protein with mRNA fold changes (log2) following knockdown of candidate RBPs. Caspase-3 protein and transcript levels (n = 3 biological replicates) were quantified by Western blot and bDNA single-molecule fluorescence in situ hybridization, respectively. (F) CASP3 activity following knockdown of the RBP candidates, measured via cleavage of the fluorogenic caspase-3 Ac-DEVD-AMC substrate. Treatment with the apoptosis-inducing agent camptothecin was used as a positive control. n = 5 biological replicates. Average log2 fold change (FC) in CASP3 activity (RBP siRNA/scrambled siRNA) is marked with red bar. Error bars represent SEM. (*) P < 0.05, paired t-test.
Figure 5.
Figure 5.
Sequential regulation of ced-3 mRNA translation by PUF-8, GLD-1, CGH-1, and MEX-3. Model of sequential translation inhibition of ced-3 in the C. elegans germline and embryos. GLD-1 regulates apoptosis in two points of the apoptotic pathway: upstream at the level of p53 tumor suppressor cep-1 and at the point of no return, where it coregulates ced-3 together with PUF-8, CGH-1, and MEX-3. At the right is an image of the adult C. elegans gonad, adding spatial context to the ced-3 regulation by RBPs: PUF-8 inhibits ced-3 in the mitotic and early meiotic zones, GLD-1 inhibits ced-3 throughout the early and late meiotic zones, CGH-1 inhibits ced-3 in the late meiotic zone and oocytes, and MEX-3 inhibits ced-3 in the embryos. Whether MEX-3, PUF-8, and CGH-1 regulate ced-3 directly or indirectly via other factors remains to be determined.

Similar articles

Cited by

References

    1. Ariz M, Mainpal R, Subramaniam K. 2009. C. elegans RNA-binding proteins PUF-8 and MEX-3 function redundantly to promote germline stem cell mitosis. Dev Biol 326: 295–304. - PMC - PubMed
    1. Ascano M, Mukherjee N, Bandaru P, Miller JB, Nusbaum JD, Corcoran DL, Langlois C, Munschauer M, Dewell S, Hafner M, et al. 2012. FMRP targets distinct mRNA sequence elements to regulate protein expression. Nature 492: 382–386. - PMC - PubMed
    1. Bailly A, Gartner A. 2013. Germ cell apoptosis and DNA damage responses. Adv Exp Med Biol 757: 249–276. - PubMed
    1. Battich N, Stoeger T, Pelkmans L. 2013. Image-based transcriptomics in thousands of single human cells at single-molecule resolution. Nat Methods 10: 1127–1133. - PubMed
    1. Betel D, Koppal A, Agius P, Sander C, Leslie C. 2010. Comprehensive modeling of microRNA targets predicts functional non-conserved and non-canonical sites. Genome Biol 11: R90. - PMC - PubMed

MeSH terms

LinkOut - more resources