Review
. 2016 Oct 31;13(1):19.
doi: 10.1186/s12987-016-0040-3.

Fluid and ion transfer across the blood-brain and blood-cerebrospinal fluid barriers; a comparative account of mechanisms and roles

Affiliations
Review

Fluid and ion transfer across the blood-brain and blood-cerebrospinal fluid barriers; a comparative account of mechanisms and roles

Stephen B Hladky et al. Fluids Barriers CNS. .

Abstract

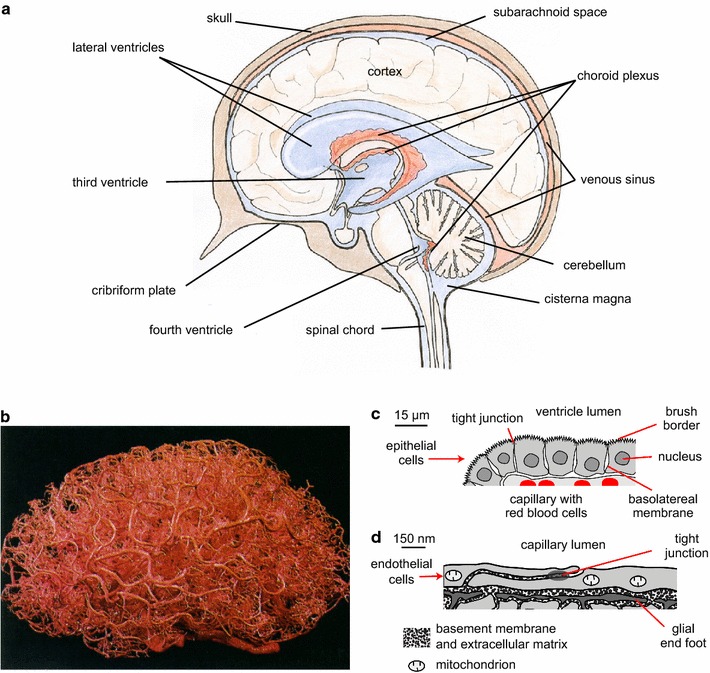
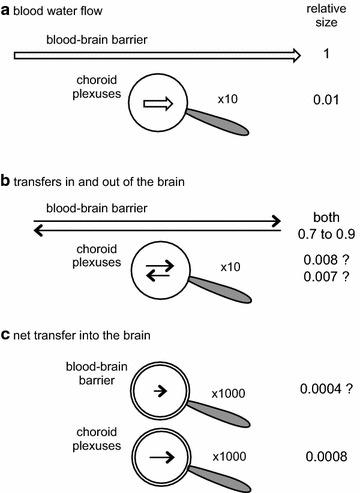
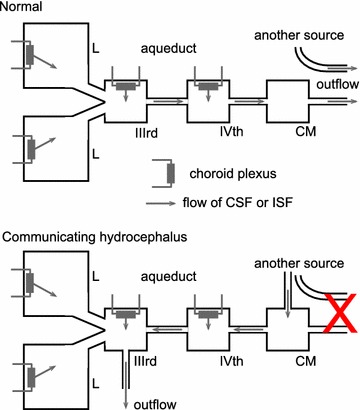
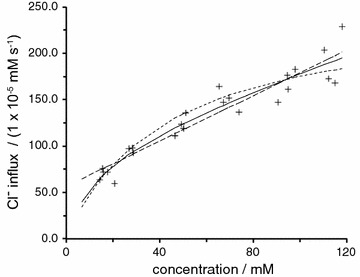
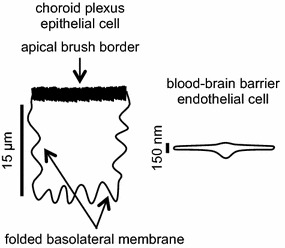
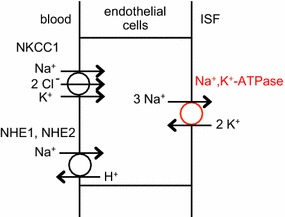
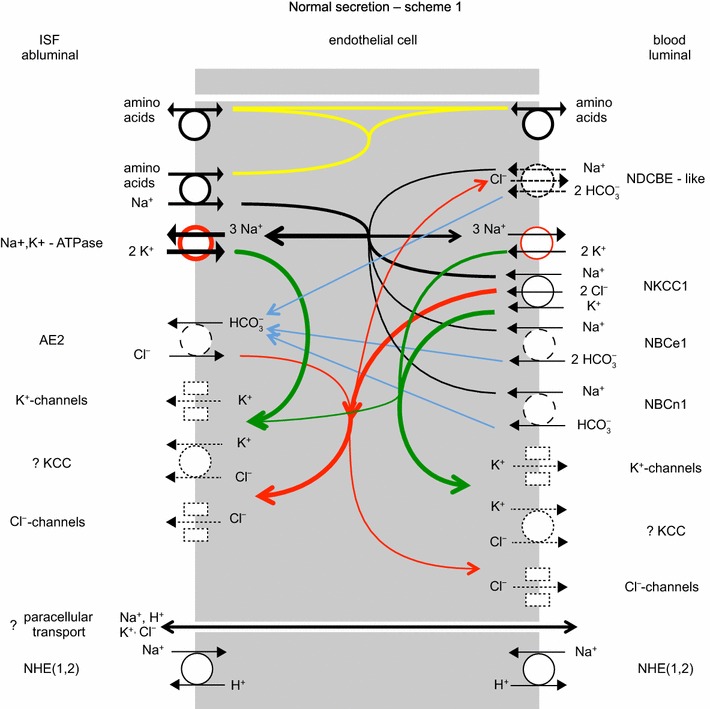
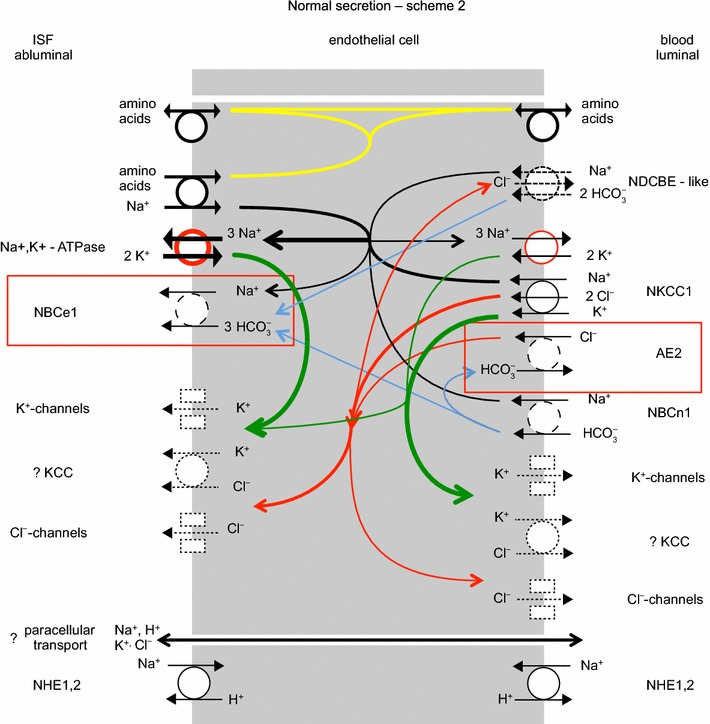
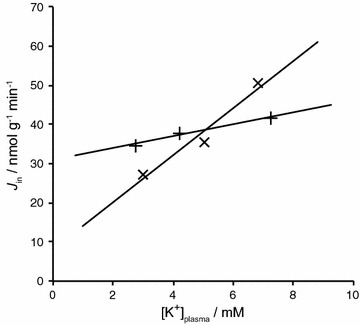
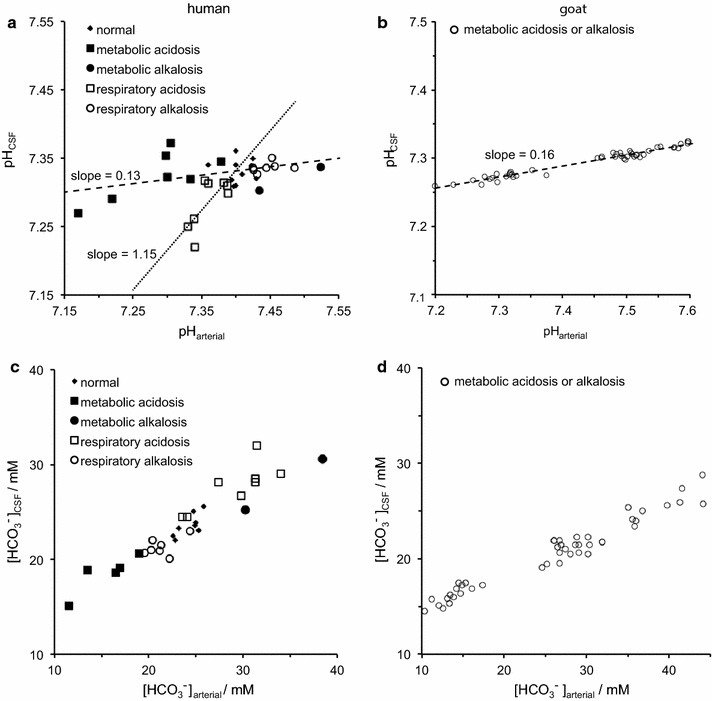
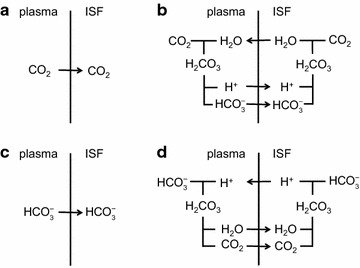
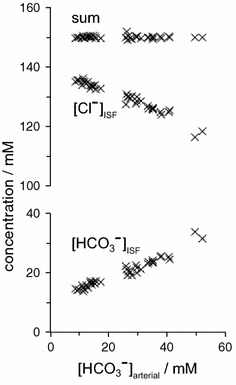
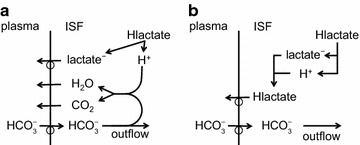
The two major interfaces separating brain and blood have different primary roles. The choroid plexuses secrete cerebrospinal fluid into the ventricles, accounting for most net fluid entry to the brain. Aquaporin, AQP1, allows water transfer across the apical surface of the choroid epithelium; another protein, perhaps GLUT1, is important on the basolateral surface. Fluid secretion is driven by apical Na+-pumps. K+ secretion occurs via net paracellular influx through relatively leaky tight junctions partially offset by transcellular efflux. The blood-brain barrier lining brain microvasculature, allows passage of O2, CO2, and glucose as required for brain cell metabolism. Because of high resistance tight junctions between microvascular endothelial cells transport of most polar solutes is greatly restricted. Because solute permeability is low, hydrostatic pressure differences cannot account for net fluid movement; however, water permeability is sufficient for fluid secretion with water following net solute transport. The endothelial cells have ion transporters that, if appropriately arranged, could support fluid secretion. Evidence favours a rate smaller than, but not much smaller than, that of the choroid plexuses. At the blood-brain barrier Na+ tracer influx into the brain substantially exceeds any possible net flux. The tracer flux may occur primarily by a paracellular route. The blood-brain barrier is the most important interface for maintaining interstitial fluid (ISF) K+ concentration within tight limits. This is most likely because Na+-pumps vary the rate at which K+ is transported out of ISF in response to small changes in K+ concentration. There is also evidence for functional regulation of K+ transporters with chronic changes in plasma concentration. The blood-brain barrier is also important in regulating HCO3- and pH in ISF: the principles of this regulation are reviewed. Whether the rate of blood-brain barrier HCO3- transport is slow or fast is discussed critically: a slow transport rate comparable to those of other ions is favoured. In metabolic acidosis and alkalosis variations in HCO3- concentration and pH are much smaller in ISF than in plasma whereas in respiratory acidosis variations in pHISF and pHplasma are similar. The key similarities and differences of the two interfaces are summarized.

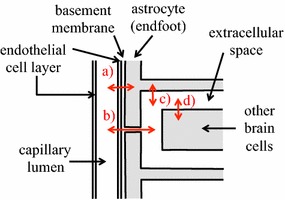
Keywords: Astrocyte endfeet; Bicarbonate transport; Blood–brain barrier; Brain interstitial fluid; Cerebrospinal fluid; Chloride transport; Choroid plexus; Electroneutrality; Endothelial; Epithelial; Fluid secretion; Ion channels; Ion transporters; Neurovascular unit; Paracellular transport; Potassium regulation; Potassium transport; Sodium transport; Tight junctions; Transcellular transport; Water channels; pH regulation.


Figures

Fig. 1
Fig. 1
Locations and functions of the choroid plexuses and the blood brain barrier. a The choroid plexuses are discrete structures located in the cerebral ventricles, which are filled with cerebrospinal fluid. Fluid can flow from the ventricles into the cisterna magna and from there to the subarachnoid spaces of the brain and spinal cord. b A cast of the vascular system of a human brain. The blood–brain barrier, which comprises the lining of the smallest and most numerous branches of the vascular system, the microvessels, is present almost everywhere in the brain. c Diagram of a cross section of part of a single villus of a choroid plexus as would be seen by light microscopy. The apical brush border is well separated from most of the basolateral membrane. d Diagram of a cross section of a microvessel wall and adjacent parenchyma as could be seen in an electron micrograph. Note the difference in scales in c and d. ad are reproduced with permission: a from [26] as relabelled in [15], b from [536] (promotional and commercial use of the material in print, digital or mobile device format is prohibited without the permission from the publisher Wolters Kluwer. Please contact healthpermissions@wolterskluwer.com for further information), c, d from [15]. For an image of part of a choroid plexus see Fig. 5
Fig. 2
Fig. 2
Comparison of a blood water flow and b, c transfers of water across the blood–brain barrier and the choroid plexuses. For the choroid plexus flow and transfers in and out of the brain are shown through a ×10 magnifying glass. The very much smaller net flows of water across both barriers are shown magnified ×1000. Arrow lengths are an approximate guide to sizes of the transfers. The water flow along the blood vessels, ~85% of blood flow, is ~100-fold greater than that to the choroid plexuses. Because the transfers of water across the interfaces are blood flow limited, the transfers in and out of the brain are also ~100-fold greater at the blood–brain barrier. By contrast because net transfers reflect active secretion of fluid, the very much smaller net transfer of water is almost certainly greater across the plexuses than across the blood–brain barrier
Fig. 3
Fig. 3
Diagram illustrating possible schemes for neurovascular coupling, i.e. regulation of blood flow changes associated with nerve activity. Two forms of control are shown, a simple feedback based on the signal to be regulated, e.g. pCO2, and b feedback plus feed-forward. The feed-forward element, signal2, possibly from astrocytes in b, allows blood flow to increase with smaller changes in the primary quantity to be regulated, signal1
Fig. 4
Fig. 4
Scenarios for transport from blood into the brain. Substances are transported across the endothelial cells (left) into the basement membrane. In scheme (1) net onward transport is entirely via the clefts between the astrocyte endfeet (right). This may be the pattern for Na+ and Cl. In scheme (2) net onward transport occurs both via the clefts and across the endfoot membrane into the astrocytes. This may be the pattern for glucose and K+. In scheme (3) net transport across the endfoot membrane is from the astrocyte into the basement membrane. The combination of substances arriving across the endothelial cells and from the astrocytes then enters the ISF via the clefts. This may be the pattern for water. There are other possible schemes, e.g. with the directions reversed which may occur when K+ is being transported from the brain to the blood
Fig. 5
Fig. 5
Immunofluorescence staining of ion transporters in the choroid plexus of the IVth ventricle in a mouse or b rat. The Na+, K+-ATPase (red) is prominent in the apical brush border of the epithelial cells facing the lumen of the ventricle. The Na+, HCO3 cotransporter, NCBE/NBCn2 (green) is localized to the basolateral membranes of the epithelial cells facing the stroma (interstitium) in which are embedded the capillaries. Nuclei are stained with To-pro 3 DNA stain (blue). Scale bar 100 µm. Previously unpublished images provided by Dr. Jeppe Praetorius. Antibodies: Na+, K+-ATPase α1-subunit [537]; Slc4a10/Ncbe/NBCn2 [538] and To-pro 3 DNA stain (invitrogen). For a similar fluorescence image localizing NBCe2 to the brush border see [539]. For images that localize Na+, K+-ATPase to the brush border, AQP1 primarily but not exclusively to the brush border, and Ncbe/NBCn2 and AE2 to the basolateral membrane see [540, 541]
Fig. 6
Fig. 6
Ion transporters and transport pathways involved in normal secretion by the choroid plexus based on the description in Damkier et al. [4] with some modifications. See also [542]. On the CSF side, Na+, K+-ATPase actively transports Na+ out of and K+ into the epithelial cell, maintaining the gradients that drive the other ion movements indicated. The red circle used in the symbol for this pump indicates that energy for the transport is input from hydrolysis of ATP. Arrows within the cell indicate transfers: in black Na+, in green K+, in red Cl, and in blue HCO3 . On the blood side, dashed arrows in the symbol for the Na+, HCO3 -cotransporter, NCBE/NBCn2, indicate the involvement of H+ and Cl if the transporter is NCBE, but not if the transporter is NBCn2. On the CSF side, transport via the Na+, K+, 2 Cl-cotransporter, NKCC1, could be in either direction depending on the concentrations of Na+, K+, and Cl on the two sides of the membrane: for the concentrations in Table 1 transport is outward as shown. The electrical potential inside the cells is substantially negative while the CSF is somewhat positive relative to the fluid on the blood side of the epithelium. The source of the current that maintains the potential in the CSF may be the blood–brain barrier (see Sects. 3.7, 6.4 with its associated footnotes)
Fig. 7
Fig. 7
Net transport by the Cl-dependent Na+, HCO3 -cotransporter, NCBE, in the basolateral membrane of the choroid plexus epithelial cells would be equivalent to the transport of 1 Na+ and 2 HCO3 into the cell and 1 Cl out. Carbonic anhydrase catalyzes the steps indicated by c.a.
Fig. 8
Fig. 8
Schematic diagram of brain structures, CSF flows and perfusion pipette positions related to the perfusion studies and other investigations discussed in this section. Most of the CSF is produced by the choroid plexuses located in the lateral (L), IIIrd and IVth ventricles. Net CSF flow then normally proceeds through the cisterna magna (CM) to the subarachnoid spaces (SA), which for this purpose include the basal cisterns. Outflow from the brain occurs via a number of routes including perineural routes through the cribriform plate (cp), the arachnoid villi (av), perineural pathways at roots of nerves (nr) including those in the spinal cord, and, in addition, perivascular routes and dural lymphatics that are not shown [543, 544]. Any fluid secreted by the blood–brain barrier within the parenchyma can flow into CSF in the subarachnoid spaces or leave the brain by perivascular and perhaps perineural pathways without first mixing with the CSF that is sampled at the cisterna magna. Flows are investigated using a number of perfusion techniques. In ventriculo-cisternal perfusion, fluid is injected via a pipette or cannula at (a) and withdrawn at (b). For ventriculo-lumbar perfusion the withdrawal is at (c) while for ventriculo-subarachnoid perfusion at d. For spinal perfusion fluid is injected at (b) or (e) and withdrawn at (c). In non-communicating hydrocephalus as discussed in this review, the aqueduct connecting the IIIrd and IVth ventricles is blocked as indicated at (i). In hydrocephalus induced by injection of kaolin into the cisterna magna the block is at the cisterna magna and at its connections to the IVth ventricle and the subarachnoid spaces as indicated at (ii). The causative pathology in communicating hydrocephalus is unknown but outflow of CSF is somehow hindered (see Fig. 9). In kaolin induced hydrocephalus the major escape route for CSF is now thought to be along the spinal canal, through spinal parenchyma to the subarachnoid space and out via the nerve roots. In non-communicating hydrocephalus (point 3i) and possibly in communicating hydrocephalus (points 3iii) there is a route of escape of CSF from the lateral and IIIrd ventricles, indicated in the diagram as being from the IIIrd ventricle
Fig. 9
Fig. 9
A schematic diagram of one interpretation of the differences in CSF flow in normal subjects and those with communicating hydrocephalus. In normal subjects, CSF is secreted by the choroid plexuses into the lateral (L), IIIrd and IVth ventricles. Some fluid is also secreted into the parenchyma, presumably by the blood–brain barrier. The magnitude of the net flow through the cerebral aqueduct is close to the sum of the secretions into the lateral and IIIrd ventricles. Fluid passes through the IVth ventricle and cisterna magna (CM) on its way to routes of outflow from the brain, i.e. via arachnoid villi, nerve tracts through the cribriform plate, and both perivascular and perineural pathways. At least some of these routes allow exit of fluid from the parenchyma without it ever mixing with CSF in the large cavities. In communicating hydrocephalus there is some deficit in the normal route of outflow indicated by the red X. The observation of reversed net flow through the cerebral aqueduct implies that another source of fluid enters CSF at some point, shown in the diagram as the cisterna magna, and, when combined with the secretion from the choroid plexus in the IVth ventricle, it equals the flow through the aqueduct. Some other pathway allowing fluid to escape from the ventricles must exist perhaps emerging from the IIIrd ventricle as shown. One possibility is flow through swollen periventricular parenchyma eventually reaching an exit route, perhaps either perivascular or perineural. Fluid exit via absorption across the blood–brain barrier is unlikely because this would require substantial alteration of barrier properties (see Sect. 5.1 with the caveats in sections 3.2 and 2.7 in [15]
Fig. 10
Fig. 10
Unidirectional Cl influx into parietal cortex as a function of [Cl]plasma. The Cl influx has been calculated as the transfer constant, k, taken from Fig. 3a in [269] times [Cl]plasma. The short-dashed curve is plotted using the expression for transport by a saturable transporter with k = V max/(K m + [Cl]plasma), maximum transport rate, V max = 250 mM s−1, and Michaelis constant, K m = 43 mM as described by Smith and Rapoport [269]. The solid curve is the best fit for a model with a single saturable component plus an unsaturable component. 53% of the influx is unsaturable at [Cl]plasma = 118 mM. As shown by the long-dashed line, it is even possible to fit the data more closely than by Smith and Rapoport’s expression by assuming a high affinity, saturable component and an unsaturable component with 72% of the uptake unsaturable at 118 mM. The fitting is described in more detail in footnote 14
Fig. 11
Fig. 11
Schematic diagram emphasizing differences between choroid plexus epithelial and blood–brain barrier endothelial cells relevant to the detection of transporters. Note the difference in scale bars
Fig. 12
Fig. 12
Transporters localized to membranes of the endothelial cells of the blood–brain barrier. The Na+, K+-ATPase and the Na+/H+-exchangers, NHE1 and NHE2, are also present on the opposite sides of the cell but at lower densities
Fig. 13
Fig. 13
mRNA expression relative to that of the Na+/H+-exchanger, NHE1, in rat brain endothelial cells, choroid plexus and kidney cortex. At the blood–brain barrier expression of mRNAs for anion exchangers 2 and 3, AE2 and AE3, the Na+/H+-exchanger, NHE1, the charge-transporting Na+, HCO3 -cotransporter, NBCe1 and the neutral Na+, HCO3 -cotransporter, NBCn1, are prominent. Those for the Cl-dependent Na+, HCO3 -cotransporters, NCBE/NBCn2, and NDCBE are clearly detected. Redrawn from data in [336]
Fig. 14
Fig. 14
Types of transporters that load or extrude acid from brain endothelial cells. In the presence of CO2/HCO3 acid is added (i.e. HCO3 is removed) primarily by either Cl/HCO3 exchange (AE: AE2 and possibly AE3) or a Na+, HCO3 cotransporter operating in a 3:1 mode (NBC: probably NBCe1). Acid is extruded by Na+ driven transport by several Na+, HCO3 cotransporters either Cl-independent (NBC: e.g. NBCn1 (n = 1) and NBCe1 in a 2:1 mode (n = 2) or Cl-dependent (NDCBE-like). In the absence of CO2/HCO3 the principal loader is here called the “leak” and the principal extruder is a Na+/H+-exchanger (NHE). The classification into loaders and extruders follows that used in [399, 545]
Fig. 15
Fig. 15
Effects of Na+ or Cl removal on pHi in the presence of CO2/HCO3 . a When NaCl is replaced by n-methyl-d-glucosamine chloride, NMDG Cl, there is a progressive acidification of cells that is initially somewhat faster. Replacement of the Na+ allows pHi to recover. The dashed line indicates the drift in pHi observed when no substitution is made. It is attributed to the “leak” described in the text. This trace is the mean of four experiments. b When NaCl is replaced by Na gluconate there is a transient rapid alkalinization of the cells. This trace is from a single experiment. Both a and b are replotted from data sets used in [336]. Both effects are statistically significant, see Table 3 in [336]
Fig. 16
Fig. 16
Simplified scheme for explaining the initial results of ion substitutions and inhibition by 4,4′-diisothiocyano-2,2′-stilbenedisulfonic acid (DIDS). In a the rates of acid loading by Cl/HCO3 exchange and acid extrusion by Na+, HCO3 -cotransport are nearly in balance and the pH is stable. In b removal of external Na+ reverses the direction of the Na+ gradient and Na+, HCO3 -cotransport is acid loading until the internal Na+ is depleted. While both types of transport are acid loading, pHi falls, i.e. there is cellular acidification. In c removal of external Cl reverses the direction of the Cl gradient and Cl/HCO3 exchange is acid extruding until the internal Cl is depleted. While both types of transport are acid extruding, pHi increases, i.e. there is cellular alkalinization. In d DIDS blocks both types of transport and there is little acid loading or extrusion and only slow if any change in pHi
Fig. 17
Fig. 17
One possible scheme for ion transport by the blood–brain barrier. The Na+-pump is shown with more on the abluminal than luminal side of the endothelial cells. Transporters shown with solid circles have been identified in the membrane indicated; those with dashed circles have been identified at a molecular level but not localized; while those with dotted circles or rectangles have been identified only functionally. The red circle used in the symbol for the Na+, K+-ATPase indicates that energy for the transport is input from hydrolysis of ATP. Arrows within the cell indicate transfers: in black Na+, in green K+, in red Cl, and in blue HCO3 . The electrical potential and ion concentrations inside the cells in vivo are not known. In primary cell culture the potential is about −40 mV [see e.g. 332]. Note that, in contrast to the choroid plexuses, at the blood–brain barrier there are likely to be conductances in both the luminal and abluminal membranes. NHE(1,2) is shown separately from the rest as it is unlikely to be active when pHi is in the normal range. However, it is strongly activated by low pHi as may occur in hypoxia/ischemia
Fig. 18
Fig. 18
A second possible scheme for ion transport by the blood–brain barrier. This differs from the first, shown in Fig. 17, by swapping the positions of NBCe1 and AE2. For the key to lines and colours see the legend to Fig. 17. The consequences of the swap are considered in Sects. 4.6.1, 4.6.2
Fig. 19
Fig. 19
Schematic diagram of K+ exchanges that are thought to be most important in regulation of [K+]ISF and brain K+ content: a between plasma and astrocytes via the endothelial cells, the basement membrane surrounding them and K+ channels in astrocyte endfoot membranes; b between plasma and ISF via the endothelial cells, the basement membrane and clefts between the endfeet; c between astrocytes and ISF; and d between ISF in the extracellular space and brain cells
Fig. 20
Fig. 20
Tracer influx of K+ into brain parenchyma with acute (X) or chronic (+) variations in plasma [K+] as calculated by Stummer et al. [361] from their data for 86Rb+ entry
Fig. 21
Fig. 21
Classic studies on the regulation of CSF pH. pH (a, b) and [HCO3 ] (c, d) in CSF are plotted against values of the same parameters in arterial blood plasma. a, c are for humans with acid–base disorders as indicated (taken from the compilation in Table 2 of [52] with all of the data shown). b, d are for goats exposed to different [HCO3 ]arterial over a week by systemic administration of NH4Cl or NaHCO3 (data extracted from Fig. 2 of [352] with pHarterial calculated as in their Fig. 3). pH is regulated by controlling the ratio [HCO3 ]/pCO2 (see Sect. 6.1.1). A metabolic disturbance of pH is one in which the causal event is a change in [HCO3 ] while a respiratory disturbance of pH is one in which the causal event is a change in pCO2. All of the data reported for goats are for metabolic disturbances. As can be seen in both humans and goats, in metabolic acidosis and alkalosis (dashed lines) pHCSF changes by much less than pHarterial, i.e. there is tighter regulation of pHCSF. By contrast in humans in respiratory acidosis (dotted line) the variation in pHCSF is as large or larger than the change in pHarterial. In metabolic acidosis and alkalosis the tighter control of pHCSF is a consequence of the smaller variation in CSF of [HCO3 ] (see c, d) and hence of the [HCO3 ]/pCO2 ratio than in arterial plasma. More recent data confirm the variations shown for metabolic disturbances and the general features of the responses to respiratory disturbances [185]). The relations between changes in [HCO3 ] and changes in pH are considered further in footnote 21
Fig. 22
Fig. 22
Transport schemes for CO2 (a) and (b), and for HCO3 (c) and (d). Transport of CO2 and HCO3 can be distinguished since the latter but not the former entails the transport of net charge. By contrast transport of HCO3 in one direction and transport of H+ in the other can produce the same net result. See text for further explanation. The proportion of CO2 transport that occurs by the mechanism in (b) is negligible
Fig. 23
Fig. 23
The relation between [HCO3 ]CSF and [Cl]CSF in chronic experimental metabolic acidosis and alkalosis in goats. The sum of [HCO3 ] and [Cl] is very nearly constant. Redrawn from data abstracted by V. Fencl (see [401]) from [351, 352]
Fig. 24
Fig. 24
Consequences of adding lactic acid to ISF. In a the lactic acid dissociates and the lactate is transported out of the ISF leaving the H+ behind. H+ combines with HCO3 and forms CO2 and H2O both of which can diffuse into the blood. Each molecule of lactic acid added reduces the number of HCO3 ions present in ISF by one. In b the lactic acid is transported out of the ISF to blood as lactic acid (or by cotransport of lactate and H+). There is no immediate relationship between [HCO3 ]ISF and either the rate of addition of lactic acid or [lactate]ISF

References

    1. Keep RF, Jones HC. A morphometric study on the development of the lateral ventricle choroid-plexus, choroid-plexus capillaries and ventricular ependyma in the rat. Brain Res Devel Brain Res. 1990;56:47–53. doi: 10.1016/0165-3806(90)90163-S. - DOI - PubMed
    1. Spector R, Keep RF, Snodgrass SR, Smith QR, Johanson CE. A balanced view of choroid plexus structure and function: focus on adult humans. Exp Neurol. 2015;267:78–86. doi: 10.1016/j.expneurol.2015.02.032. - DOI - PubMed
    1. Cserr HF. Physiology of choroid plexus. Physiol Rev. 1971;51:273–311. - PubMed
    1. Damkier HH, Brown PD, Praetorius J. Cerebrospinal fluid secretion by the choroid plexus. Physiol Rev. 2013;93:1847–1892. doi: 10.1152/physrev.00004.2013. - DOI - PubMed
    1. Mathiisen TM, Lehre KP, Danbolt NC, Ottersen OP. The perivascular astroglial sheath provides a complete covering of the brain microvessels: an electron microscopic 3D reconstruction. Glia. 2010;58:1094–1103. doi: 10.1002/glia.20990. - DOI - PubMed

LinkOut - more resources