. 2016 Dec 29;128(26):3061-3072.
doi: 10.1182/blood-2016-02-702373. Epub 2016 Oct 31.

Protein stabilization improves STAT3 function in autosomal dominant hyper-IgE syndrome

Affiliations

Protein stabilization improves STAT3 function in autosomal dominant hyper-IgE syndrome

Claire E Bocchini et al. Blood. .

Abstract

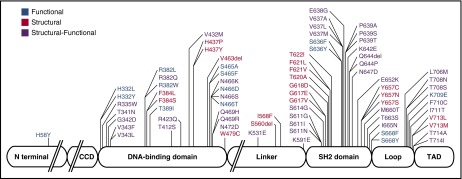
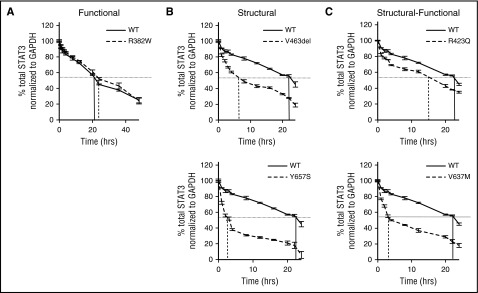
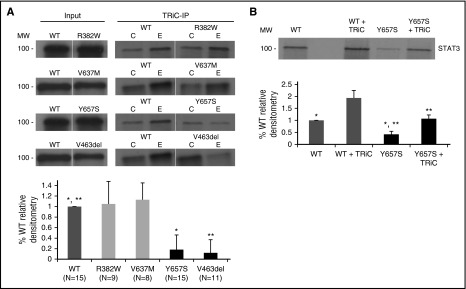
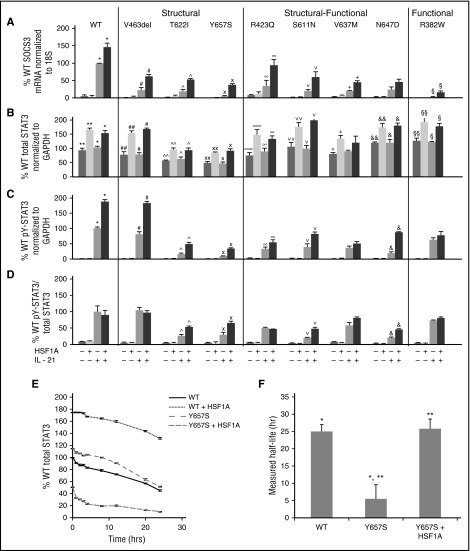
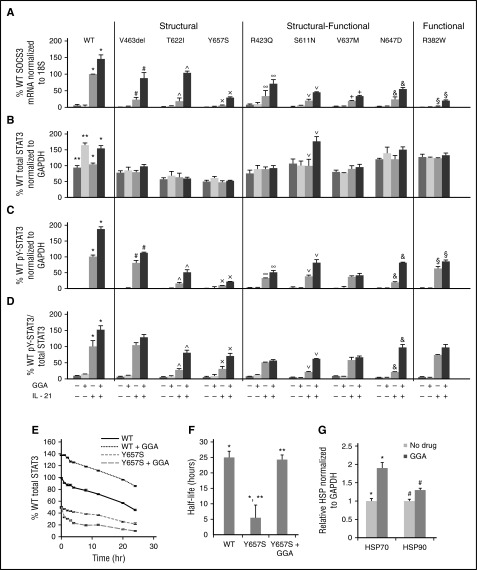
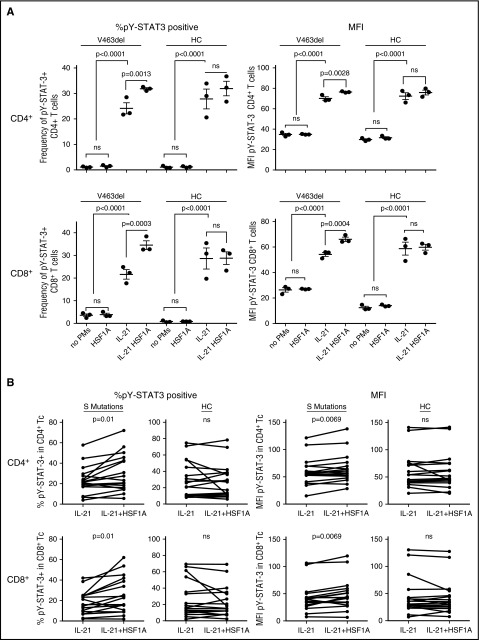
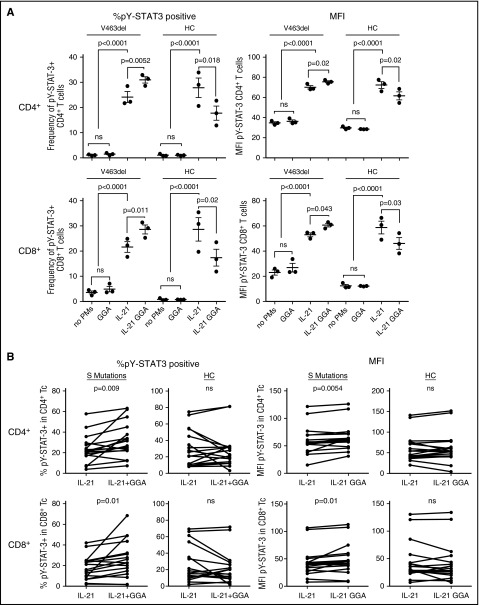
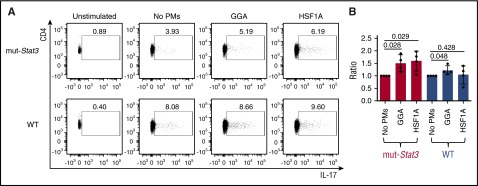
Autosomal dominant hyper-IgE syndrome (AD-HIES) is caused by dominant-negative mutations in STAT3; however, the molecular basis for mutant STAT3 allele dysfunction is unclear and treatment remains supportive. We hypothesized that AD-HIES mutations decrease STAT3 protein stability and that mutant STAT3 activity can be improved by agents that increase chaperone protein activity. We used computer modeling to characterize the effect of STAT3 mutations on protein stability. We measured STAT3 protein half-life (t1/2) and determined levels of STAT3 phosphorylated on tyrosine (Y) 705 (pY-STAT3) and mRNA levels of STAT3 gene targets in Epstein-Barr virus-transformed B (EBV) cells, human peripheral blood mononuclear cells (PBMCs), and mouse splenocytes incubated without or with chaperone protein modulators-HSF1A, a small-molecule TRiC modulator, or geranylgeranylacetone (GGA), a drug that upregulates heat shock protein (HSP) 70 and HSP90. Computer modeling predicted that 81% of AD-HIES mutations are destabilizing. STAT3 protein t1/2 in EBV cells from AD-HIES patients with destabilizing STAT3 mutations was markedly reduced. Treatment of EBV cells containing destabilizing STAT3 mutations with either HSF1A or GGA normalized STAT3 t1/2, increased pY-STAT3 levels, and increased mRNA levels of STAT3 target genes up to 79% of control. In addition, treatment of human PBMCs or mouse splenocytes containing destabilizing STAT3 mutations with either HSF1A or GGA increased levels of cytokine-activated pY-STAT3 within human CD4+ and CD8+ T cells and numbers of IL-17-producing CD4+ mouse splenocytes, respectively. Thus, most AD-HIES STAT3 mutations are destabilizing; agents that modulate chaperone protein function improve STAT3 stability and activity in T cells and may provide a specific treatment.


Figures

Figure 1.
Figure 1.
Schematic model of STAT3 delineating the domain location and category assignment for each AD-HIES single-amino-acid missense mutation or in-frame deletion. Functional mutations are shown in blue; structural mutations are shown in red; structural-functional mutations are shown in purple.
Figure 2.
Figure 2.
STAT3 protein t1/2measurements in EBV cells from AD-HIES patients. Single representative experiments are shown for EBV cells with WT STAT3 and STAT3 F mutation R382W (A), EBV cells with STAT3 S mutations V463del or Y657S (B), and EBV cells with STAT3 S-F mutations R423Q or V637M (C). STAT3 protein t1/2 was determined as time after CHX addition until STAT3 levels decreased to 50% of starting level, as indicated by vertical lines.
Figure 3.
Figure 3.
STAT3 proteins containing S mutations have decreased interaction with TRiC. In vitro transcription/translation reactions were performed in RLL containing 35S-methionine and equivalent amounts of cDNA constructs encoding WT or mutant STAT3 without or with exogenous bovine TRiC (120 nM; TRiC) as indicated. In the top half of panels A and B, an equivalent fraction of each reaction was separated by sodium dodecyl sulfate polyacrylamide gel electrophoresis, in the case of panel A either before (Input) or after immunoprecipitation with anti-TRiC (TRiC-IP; column E) or control antibody (column C). Gels were dried and autoradiographed. In the bottom half of panels A and B, bands from multiple experiments (N as indicated or ≥3 where noted) were quantitated by densitometry and the mean ± SD plotted for each STAT3 cDNA construct. Differences in means of mutant constructs from WT are indicated by asterisks (*,** P < .001, Student t test).
Figure 4.
Figure 4.
HSF1A increased STAT3 function in AD-HIES patient EBV cells. EBV cells were treated with HSF1A (3 μM) for 48 hours, then stimulated with IL-21 (50 ng/mL). SOCS3 expression was measured by quantitative RT-PCR 120 minutes after stimulation (A). Total and phosphotyrosylated STAT3 and GAPDH were measured by Luminex 30 minutes after stimulation and results shown (B-D). STAT3 protein t1/2 determined (E-F; n ≥4 for each experiment). Comparisons of means marked by symbols *, **, #, ##, ^, ^^, ×, ××, ∞∞, ∨, ∨∨, +, &, &&, §, §§ indicate P < .01; ∞ indicates P < .05 ([A-D] analysis of variance [ANOVA]; [F] Student t test).
Figure 5.
Figure 5.
GGA increased STAT3 function in AD-HIES patient EBV cells. EBV cells were treated with GGA (3 μM) for 48 hours, then stimulated with IL-21 (50 ng/mL). SOCS3 expression was measured by quantitative RT-PCR 120 minutes after stimulation (A). Total and phosphotyrosylated STAT3 and GAPDH were measured by Luminex 30 minutes after stimulation (B-D). STAT3 protein t1/2 in a single representative experiment (E) and in multiple experiments (F; N = 3). Comparisons of means marked by symbols *, **, #, ^, ×,∨, +, &, §, indicate P < .01; ∞ indicates P < .05. Levels of HSP70 and HSP90 were determined without and with GGA in 2 experiments (G); *, # indicates P < .05.
Figure 6.
Figure 6.
HSF1A increased STAT3 function in AD-HIES patient PBMCs. PBMCs from a patient with STAT3 S mutation V463del or a healthy control were each preincubated in triplicate aliquots with HSF1A and stimulated with IL-21, as noted before (A). PBMCs from 3 patients with STAT3 S mutation V463del, 1 patient with STAT3 S mutation F621V, and 7 healthy controls were incubated with HSFA1 and stimulated with IL-21, as noted before, each on ≥4 occasions (B). Results shown are percentage of pY-STAT3–positive cells and MFI in CD4+ and CD8+ T cells determined by multiparametric flow cytometry ([A] ANOVA; [B] paired Student t test). ns, not significant.
Figure 7.
Figure 7.
GGA increased STAT3 function in AD-HIES patient PBMC. PBMC from a patient with STAT3 S mutation V463del or a healthy control were each preincubated in triplicate aliquots with GGA and stimulated with IL-21, as noted before (A). PBMCs from 3 patients with STAT3 S mutation V463del, 1 patient with STAT3 S mutation F621V, and 7 healthy controls were incubated with GGA and stimulated with IL-21, as noted before, each on ≥4 occasions (B). Results shown are percentage of pY-STAT3–positive cells and MFI in CD4+ and CD8+ T cells determined by multiparametric flow cytom ([A] ANOVA; [B] paired Student t test). ns, not significant.
Figure 8.
Figure 8.
GGA and HSF1A increased IL-17A–producing cells within CD4+splenocytes from mut-Stat3 mice. Representative flow cytometry analysis (A) of TCR+ CD4+ T cells in splenocytes from mut-Stat3 or WT mice; IL-17A intracellular staining was performed upon isolation without PMA/Ionomycin stimulation (Unstimulated) or after incubation in Th17 polarizing conditions either without proteostasis modulators (no PMs) or with GGA (3 μM) or HSF1A (3 μM) and stimulation with PMA/Ionomycin. (B) The percentage of IL-17A–producing TCR+CD4+ cells measured in the presence of GGA or HSF1A was normalized to the percentage in the absence of proteostasis modulators and the mean and SD (vertical bars) plotted for each mouse in both the mut-Stat3 and WT groups (n = 4; P values determined using paired Student t test are shown).

Comment in

References

    1. Davis SD, Schaller J, Wedgwood RJ. Job’s Syndrome. Recurrent, “cold”, staphylococcal abscesses. Lancet. 1966;1(7445):1013-1015. - PubMed
    1. Holland SM, DeLeo FR, Elloumi HZ, et al. . STAT3 mutations in the hyper-IgE syndrome. N Engl J Med. 2007;357(16):1608-1619. - PubMed
    1. Jiao H, Tóth B, Erdos M, et al. . Novel and recurrent STAT3 mutations in hyper-IgE syndrome patients from different ethnic groups. Mol Immunol. 2008;46(1):202-206. - PubMed
    1. Minegishi Y, Saito M, Tsuchiya S, et al. . Dominant-negative mutations in the DNA-binding domain of STAT3 cause hyper-IgE syndrome. Nature. 2007;448(7157):1058-1062. - PubMed
    1. Freeman AF, Avila EM, Shaw PA, et al. . Coronary artery abnormalities in Hyper-IgE syndrome. J Clin Immunol. 2011;31(3):338-345. - PMC - PubMed

Publication types

MeSH terms