

Independent activation of distinct pores in dimeric TMEM16A channels
- PMID: 27799319
- PMCID: PMC5089935
- DOI: 10.1085/jgp.201611651
Independent activation of distinct pores in dimeric TMEM16A channels
Abstract
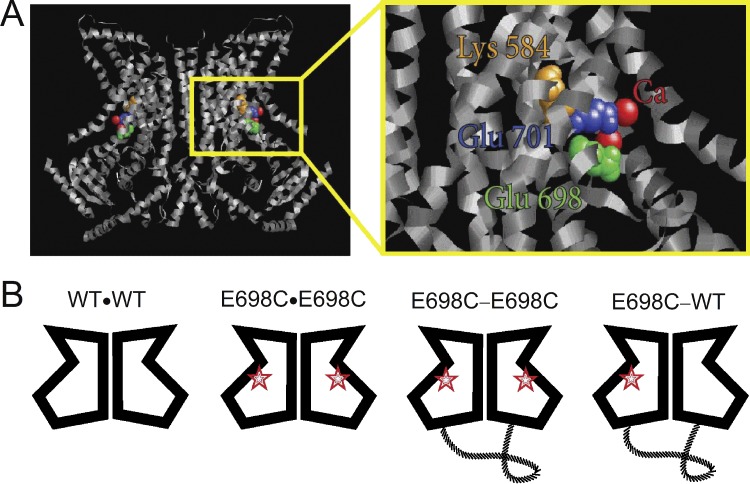
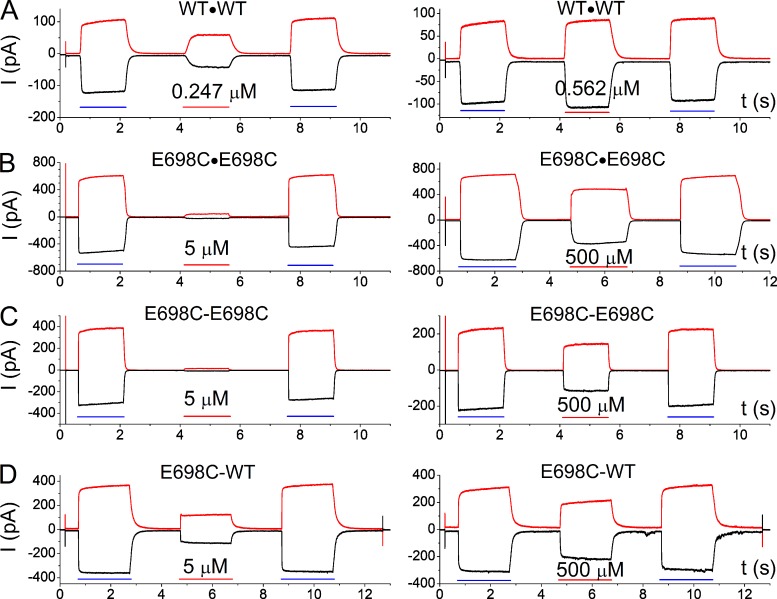
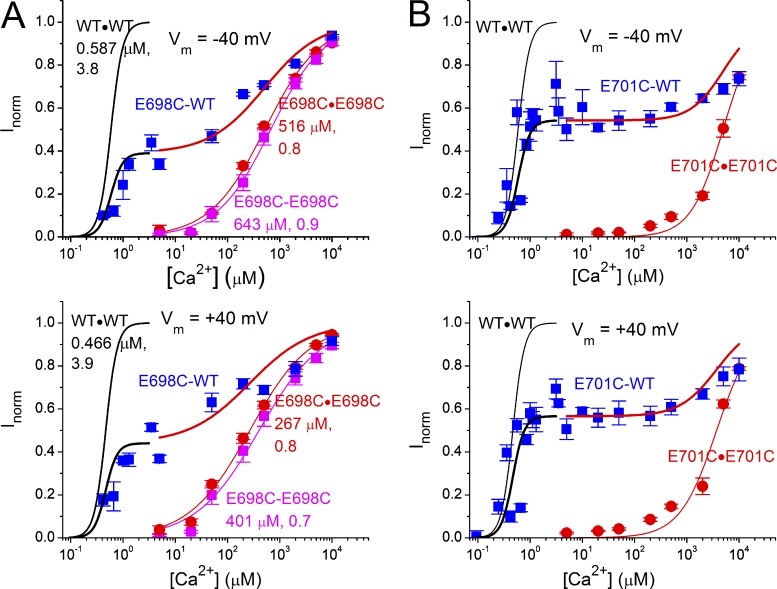
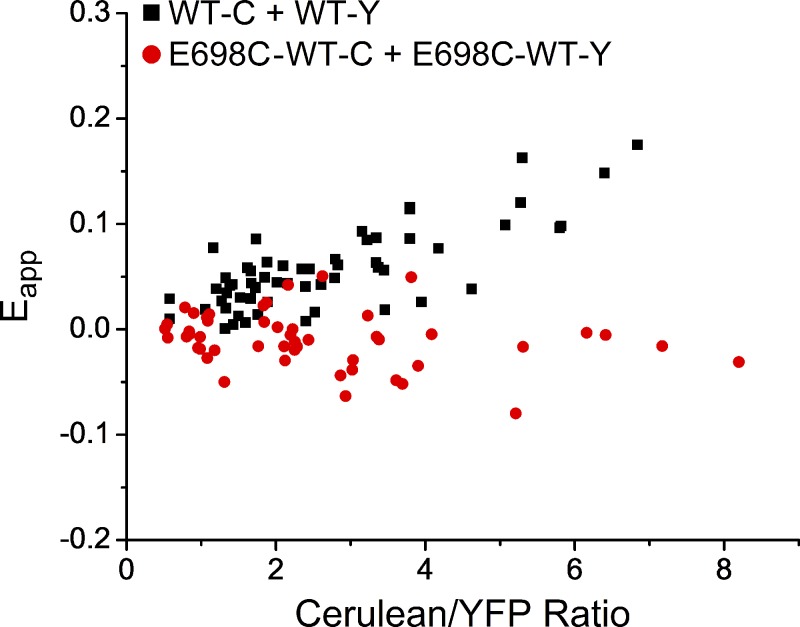
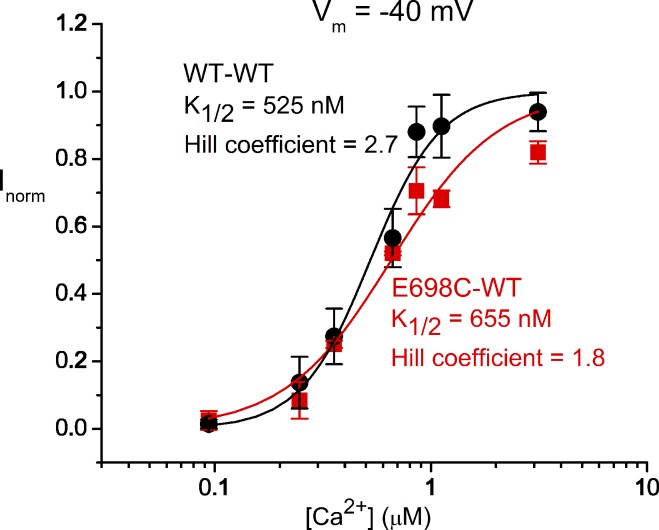
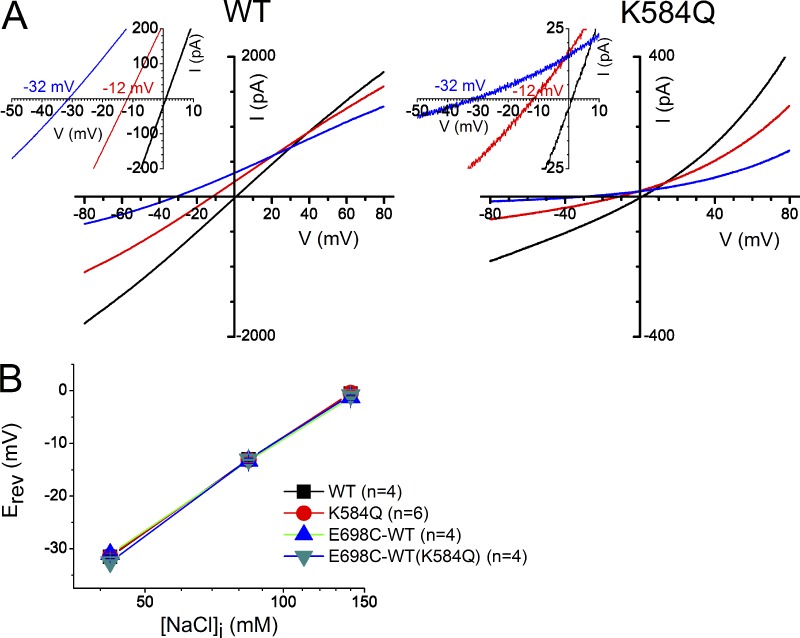
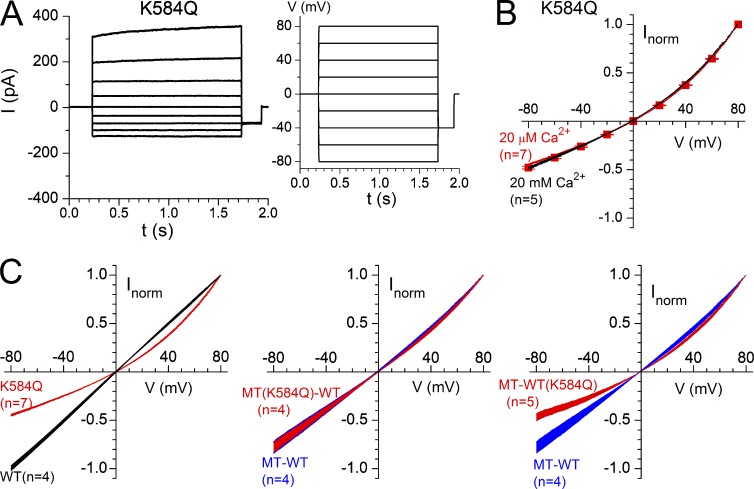
The TMEM16 family encompasses Ca2+-activated Cl- channels (CaCCs) and lipid scramblases. These proteins are formed by two identical subunits, as confirmed by the recently solved crystal structure of a TMEM16 lipid scramblase. However, the high-resolution structure did not provide definitive information regarding the pore architecture of the TMEM16 channels. In this study, we express TMEM16A channels constituting two covalently linked subunits with different Ca2+ affinities. The dose-response curve of the heterodimer appears to be a weighted sum of two dose-response curves-one corresponding to the high-affinity subunit and the other to the low-affinity subunit. However, fluorescence resonance energy transfer experiments suggest that the covalently linked heterodimeric proteins fold and assemble as one molecule. Together these results suggest that activation of the two TMEM16A subunits likely activate independently of each other. The Ca2+ activation curve for the heterodimer at a low Ca2+ concentration range ([Ca2+] < 5 µM) is similar to that of the wild-type channel-the Hill coefficients in both cases are significantly greater than one. This suggests that Ca2+ binding to one subunit of TMEM16A is sufficient to activate the channel and that each subunit contains more than one Ca2+-binding site. We also take advantage of the I-V curve rectification that results from mutation of a pore residue to address the pore architecture of the channel. By introducing the pore mutation and the mutation that alters Ca2+ affinity in the same or different subunits, we demonstrate that activation of different subunits appears to be associated with the opening of different pores. These results suggest that the TMEM16A CaCC may also adopt a "double-barrel" pore architecture, similar to that found in CLC channels and transporters.
© 2016 Jeng et al.
Figures
Similar articles
-
Independent activation of ion conduction pores in the double-barreled calcium-activated chloride channel TMEM16A.J Gen Physiol. 2016 Nov;148(5):375-392. doi: 10.1085/jgp.201611650. Epub 2016 Oct 17. J Gen Physiol. 2016. PMID: 27799318 Free PMC article.
-
X-ray structure of a calcium-activated TMEM16 lipid scramblase.Nature. 2014 Dec 11;516(7530):207-12. doi: 10.1038/nature13984. Epub 2014 Nov 12. Nature. 2014. PMID: 25383531
-
Gating modes of calcium-activated chloride channels TMEM16A and TMEM16B.J Physiol. 2015 Dec 15;593(24):5283-98. doi: 10.1113/JP271256. Epub 2015 Dec 7. J Physiol. 2015. PMID: 26728431 Free PMC article.
-
Bestrophin and TMEM16-Ca(2+) activated Cl(-) channels with different functions.Cell Calcium. 2009 Oct;46(4):233-41. doi: 10.1016/j.ceca.2009.09.003. Epub 2009 Sep 26. Cell Calcium. 2009. PMID: 19783045 Review.
-
Insights into the function and regulation of the calcium-activated chloride channel TMEM16A.Cell Calcium. 2024 Jul;121:102891. doi: 10.1016/j.ceca.2024.102891. Epub 2024 May 8. Cell Calcium. 2024. PMID: 38772195 Review.
Cited by
-
A network of phosphatidylinositol 4,5-bisphosphate binding sites regulates gating of the Ca2+-activated Cl- channel ANO1 (TMEM16A).Proc Natl Acad Sci U S A. 2019 Oct 1;116(40):19952-19962. doi: 10.1073/pnas.1904012116. Epub 2019 Sep 12. Proc Natl Acad Sci U S A. 2019. PMID: 31515451 Free PMC article.
-
Comparison of ion transport determinants between a TMEM16 chloride channel and phospholipid scramblase.J Gen Physiol. 2019 Apr 1;151(4):518-531. doi: 10.1085/jgp.201812270. Epub 2019 Jan 22. J Gen Physiol. 2019. PMID: 30670476 Free PMC article.
-
TMEM16A/ANO1: Current Strategies and Novel Drug Approaches for Cystic Fibrosis.Cells. 2021 Oct 24;10(11):2867. doi: 10.3390/cells10112867. Cells. 2021. PMID: 34831090 Free PMC article. Review.
-
Gating the pore of the calcium-activated chloride channel TMEM16A.Nat Commun. 2021 Feb 4;12(1):785. doi: 10.1038/s41467-020-20787-9. Nat Commun. 2021. PMID: 33542223 Free PMC article.
-
Dynamic change of electrostatic field in TMEM16F permeation pathway shifts its ion selectivity.Elife. 2019 Jul 18;8:e45187. doi: 10.7554/eLife.45187. Elife. 2019. PMID: 31318330 Free PMC article.
References
-
- Bolduc V., Marlow G., Boycott K.M., Saleki K., Inoue H., Kroon J., Itakura M., Robitaille Y., Parent L., Baas F., et al. . 2010. Recessive mutations in the putative calcium-activated chloride channel Anoctamin 5 cause proximal LGMD2L and distal MMD3 muscular dystrophies. Am. J. Hum. Genet. 86:213–221. 10.1016/j.ajhg.2009.12.013 - DOI - PMC - PubMed
Publication types
MeSH terms
Substances
Associated data
- Actions
Grants and funding
LinkOut - more resources
Full Text Sources
Other Literature Sources
Miscellaneous
