. 2016 Dec 29;85(1):e00586-16.
doi: 10.1128/IAI.00586-16. Print 2017 Jan.

pH Alkalinization by Chloroquine Suppresses Pathogenic Burkholderia Type 6 Secretion System 1 and Multinucleated Giant Cells

Affiliations

pH Alkalinization by Chloroquine Suppresses Pathogenic Burkholderia Type 6 Secretion System 1 and Multinucleated Giant Cells

Jennifer Chua et al. Infect Immun. .

Abstract

Burkholderia mallei and B. pseudomallei cause glanders and melioidosis, respectively, in humans and animals. A hallmark of pathogenesis is the formation of granulomas containing multinucleated giant cells (MNGCs) and cell death. These processes depend on type 6 secretion system 1 (T6SS-1), which is required for virulence in animals. We examined the cell biology of MNGC formation and cell death. We found that chloroquine diphosphate (CLQ), an antimalarial drug, inhibits Burkholderia growth, phagosomal escape, and subsequent MNGC formation. This depends on CLQ's ability to neutralize the acid pH because other alkalinizing compounds similarly inhibit escape and MNGC formation. CLQ inhibits bacterial virulence protein expression because T6SS-1 and some effectors of type 3 secretion system 3 (T3SS-3), which is also required for virulence, are expressed at acid pH. We show that acid pH upregulates the expression of Hcp1 of T6SS-1 and TssM, a protein coregulated with T6SS-1. Finally, we demonstrate that CLQ treatment of Burkholderia-infected Madagascar hissing cockroaches (HCs) increases their survival. This study highlights the multiple mechanisms by which CLQ inhibits growth and virulence and suggests that CLQ be further tested and considered, in conjunction with antibiotic use, for the treatment of diseases caused by Burkholderia.

Keywords: Burkholderia; Madagascar hissing cockroaches; acidification; actin tails; autophagy; chloroquine; multinucleated giant cells; phagosomal escape; type 3 secretion system; type 6 secretion system.


Figures

FIG 1
FIG 1
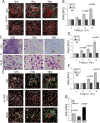
Chloroquine inhibits Burkholderia-induced MNGC formation in RAW 264.7 cells. (A, C, E) Representative confocal micrographs of macrophages infected with the indicated Burkholderia spp. for 1 h at an MOI of 5 (B. mallei SR1 [A] or B. pseudomallei 1026b [E]) or an MOI of 1 (B. thailandensis [C]) and either left untreated (control [Ctrl]) or treated with 75 μM CLQ or 10 μg/ml nocodazole (NOC) (E). At the indicated times, cells were fixed, subjected to immunofluorescence staining, and imaged with a confocal microscope. Nuclei were stained with DAPI (red), actin was stained with phalloidin (white), and bacteria were stained with anti-Burkholderia Ab (green). Bars = 50 μm (A and E). Alternatively, fixed cells were stained with Wright-Giemsa and imaged with a light microscope. Bar = 30 μm (C). (B, D, F, G) From the microscopy images, MNGC formation was quantified by manually counting all nuclei and cells in a given field, whether they were mononucleated cells or MNGCs. The number of nuclei was divided by the number of cells from an average of 3 images per coverslip per experiment to calculate the ratio of the number of nuclei/number of cells (Ratio [N/C]). Conditions that resulted mostly in mononucleated cells displayed N/C ratios of 1.0, whereas those that resulted in MNGCs displayed N/C ratios of >1. See cell fusion and the formation of MNGCs in Movie S1 in the supplemental material. The total numbers of nuclei counted for the graphs in panels B, D, F, and G were 12,425, 11,818, 18,465, and 4,720, respectively. The P values in panels B, D, and F, representing the differences between the control and experimental conditions at each time point, were calculated using an asymptotic normal test. The P values in panel G represent the differences between CLQ-treated cells and control or NOC-treated cells (P = 0.0002 between control and NOC-treated cells). Error bars represent standard errors of the means (SEMs). Data are from 2 independent experiments for B. mallei (B), 3 independent experiments for B. thailandensis (D), 3 independent experiments for B. pseudomallei (F), and 3 independent experiments for B. pseudomallei with CLQ and NOC (G). Bm, B. mallei; Bp, B. pseudomallei; Bt, B. thailandensis.
FIG 2
FIG 2
Chloroquine inhibits Burkholderia-induced cell death in RAW 264.7 cells. (A) Representative confocal microscopy images of macrophages infected with B. thailandensis at an MOI of 1 and either left untreated (control [Ctrl]) or treated with 75 μM CLQ. At the indicated times, cells were incubated with calcein AM (green; live cells) and EthD-1 (red; dead cells) for 5 min and immediately imaged. Bar = 50 μm. Similar results were observed in 3 independent experiments. (B) Macrophages were infected with B. thailandensis at an MOI of 5 and either left untreated (control) or treated with 75 μM CLQ. At the indicated times, medium from at least 3 wells per time point and treatment was collected. Medium from each well was assayed in duplicate for LDH release. LDH release is expressed as percent cytotoxicity. The P values were calculated using an unpaired t test. Error bars represent SEMs (n = 3 independent experiments). (C) Uninfected macrophages were left untreated (control) or treated with 75 μM CLQ, and at the indicated times, medium from at least 3 wells per condition was collected. For LDH release, medium from each well was assayed in duplicate. The LDH release was not significantly different between control and CLQ-treated cells, although the values for CLQ-treated cells tended to be higher than those for the control cells. Error bars represent SEMs (n = 3 independent experiments). (D) Representative confocal microscopy images of macrophages infected with B. thailandensis at an MOI of 1 and either left untreated (control) or treated with 75 μM CLQ. At the indicated times, cells were fixed and subjected to the TUNEL assay to label pyroptotic or apoptotic cells. Bar = 50 μm. Similar results were observed in 3 independent experiments.
FIG 3
FIG 3
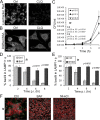
Chloroquine inhibits intracellular growth and escape from the phagosome. (A) Macrophages were infected with B. thailandensis at an MOI of 1 and left untreated (control [Ctrl]) or treated with 75 μM CLQ. Coverslips from 2 wells per treatment and time were washed in PBS to remove extracellular bacteria and then lysed in fresh plates at the indicated times. Bacterial lysate was serially diluted and plated for determination of the number of CFU in duplicate. P values were calculated by an asymptotic normal test. Error bars represent SEMs (n = 3 independent experiments). (B) Macrophages were infected with B. thailandensis at an MOI of 20 for 1 h and lysed at 2 h p.i. to determine bacterial loads. Lysed cells from 3 coverslips per condition were plated in duplicate for determination of the number of CFU. CLQ (75 μM) was added 1 h prior to infection and was present at the time of B. thailandensis addition and throughout the infection. Error bars represent SEMs (n = 3 independent experiments). Differences between control and CLQ-treated cells were not significant. (C) Growth curve obtained by plotting the optical density at 600 nm (OD600) versus time for B. thailandensis grown in LB broth (Lennox) and left untreated (control) or treated with 7.5, 75, or 750 μM CLQ. Error bars represent SEMs (n = 2 independent experiments). (D and E) B. thailandensis-infected cells (MOI = 20) with or without 75 μM CLQ treatment were fixed at the indicated times and subjected to immunostaining against Burkholderia and LAMP1. Cells were also stained for nuclei and actin and were stained with the latter to delineate the limits of the cell. The number of bacilli in LAMP1+ phagosomes (ϕ) was scored. The total number of bacilli counted was 766 for control cells and 618 for CLQ-treated cells. P values were calculated using an unpaired t test. Error bars represent SEMs (n = 3 independent experiments). (E) Representative confocal micrographs of cells infected with Burkholderia left untreated (control) or treated with CLQ. Cells were fixed at 6 h p.i. and stained against Burkholderia (green), LAMP1 (red), and nuclei (blue). Arrows, B. thailandensis in LAMP1+ phagosomes (ϕ). Bar = 10 µm. (F and G) B. thailandensis-infected cells (MOI = 20) with or without 75 μM CLQ treatment were fixed and stained for Burkholderia, actin, and nuclei as described in the legend to panels D and E. (F) The number of bacilli with actin tails was scored. The experiments used to count LAMP1+ phagosomes (D and E) were independent of the experiments used to count actin tails. The total number of bacilli counted was 1,036 for control cells and 850 for CLQ-treated cells. The P values were calculated using an unpaired t test. Error bars represent SEMs (n = 3 independent experiments). (G) Representative confocal micrographs of cells infected with Burkholderia left untreated (control) or treated with CLQ. Cells were fixed at 6 h p.i. and stained against Burkholderia (green) and actin (red). Bar = 10 µm.
FIG 4
FIG 4
Chloroquine increases the survival of B. thailandensis-infected HCs. HCs were challenged at day 0 with B. thailandensis at doses ranging from 10 to 20 LD50s and treated with CLQ or PBS on the same day, as described in Materials and Methods. Additional uninfected control groups received CLQ or PBS alone. HC survival (in percent) was monitored for 7 day. The P value represents the significance of the difference at 7 days between the B. thailandensis-infected group and the B. thailandensis-infected and CLQ-treated group and was calculated using an asymptotic normal test. Four independent experiments were performed, each with 10 or 12 HCs per group.
FIG 5
FIG 5
Chloroquine does not function through autophagy to inhibit MNGC formation. (A) Representative confocal images of uninfected cells left untreated (control) or incubated with 75 μM CLQ. At 9 h posttreatment, cells were stained with monodansylcadaverine (MDC; green, autophagosomes) and propidium iodide (PI; red, dead cells) for 5 min prior to imaging. Bar = 20 μm. (B) Representative confocal image of untreated cells infected with B. thailandensis (MOI = 10) at 9 h p.i. Cells were stained with MDC (green) and PI (red). The images in panels A and B were taken under the same laser power and gain. Data are representative of those from 3 independent experiments. (C) Representative confocal images of cells infected with B. thailandensis at an MOI of 1 and treated with 10 mM 3-methyladenine (3MA), 0.3 mM leupeptin (LEU), or 4 μM rapamycin (RAP). The cells were fixed at 12 h p.i. and stained with DAPI (nuclei; red), phalloidin (actin; white), and an anti-Burkholderia Ab (green). Data are representative of those from 2 independent experiments. Bar = 50 μm. (D) Quantification of MNGC formation as the ratio of the number of nuclei to the number of cells (R [N/C]) in B. thailandensis-infected cells (MOI = 1) left untreated (control [Ctrl]) or treated with 10 mM 3MA or 0.3 mM LEU at 18 h p.i. The total number of nuclei counted was 3,865. Error bars represent SEMs (n = 2 independent experiments). The differences between the control and the experimental treatments, based on an asymptotic normal test, were not significant. (E) Quantification of MNGC formation as the R [N/C] in B. thailandensis-infected cells (MOI = 1) left untreated (control) or treated with 4 μM RAP at 18 h p.i. The total number of nuclei counted was 2,110. Error bars represent SEMs (n = 2 independent experiments). The difference between the controls and the experimental treatments, based on an asymptotic normal test, was not significant.
FIG 6
FIG 6
Chloroquine alkalinizes endocytic compartments, and alkalinization inhibits replication, phagosomal escape, and MNGC formation. (A) Representative confocal images of LysoTracker red staining of uninfected cells untreated (control [Ctrl]) or treated with 75 μM CLQ. Data are representative of those from 3 independent experiments. Bar = 10 μm. (B) Representative confocal images of DQRed BSA fluorescence in uninfected cells untreated (control) or treated with 75 μM CLQ. Data are representative of those from 3 independent experiments. Bar = 10 μm. (C) B. thailandensis growth in LB broth (Lennox) adjusted to pH 5.0, 5.5, or 6.8 for 8 h. The statistical significance of differences between growth at pH 6.8 and that at pH 5.0 or 5.5 was calculated using an unpaired t test. Error bars represent SEMs (n = 3 independent experiments). (D and E) Macrophages were infected with B. thailandensis at an MOI of 20 and left untreated (control) or treated with 250 nM bafilomycin A (BAF) (D) or 30 mM ammonium chloride (NH4Cl) (E). At the indicated times, cells were fixed and stained for LAMP1, Burkholderia, and actin. The number of bacilli in LAMP1+ phagosomes (ϕ) was scored. The number of bacilli counted was 609 for control cells (D and E), 438 for BAF-treated cells (D), and 409 for NH4Cl-treated cells (E). The P values were calculated using an unpaired t test. Error bars represent SEMs (n = 3 independent experiments). (F) Representative confocal images of B. thailandensis-infected cells (MOI = 1) (green) untreated (control) or treated with 250 nm BAF or 30 mM NH4Cl at 15 h p.i. Actin was stained with phalloidin (white), and the nucleus was stained with DAPI (red). Data are representative of those from 3 independent experiments. Bar = 50 μm.
FIG 7
FIG 7
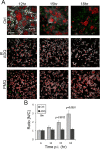
Antimalarial drugs, which have weak base properties, also inhibit MNGC formation. (A) Representative confocal images of B. thailandensis-infected cells (MOI = 1) that were left untreated (control [Ctrl]) or treated with 75 μM amodiaquine dihydrochloride dihydrate (ADQ) or 150 μM primaquine bisphosphate (PMQ) for the indicated times. Cells were labeled with phalloidin (actin; white), DAPI (nuclei; red), and anti-Burkholderia Ab (green). Data are representative of those from 2 independent experiments. Bar = 50 μm. (B) Quantification of MNGC formation as the ratio of the number of nuclei/number of cells (Ratio [N/C]) in B. mallei-infected cells (MOI = 5) left untreated (control) or treated with 75 μM ADQ at the indicated times. The total number of nuclei counted was 10,449. The P values were calculated using an asymptotic normal test. Error bars indicate SEMs (n = 2 independent experiments).
FIG 8
FIG 8
T3SS and T6SS proteins are regulated by acid pH. (A) Immunoblot analyses of BopC, BopE, and GroEL in the pellet fractions of B. mallei SR1 grown in M9 broth with 4% glycerol adjusted to pH 5 or pH 7. GroEL served as a loading control. Data are representative of those from 2 independent experiments. (B) Representative confocal images of B. mallei ΔtssM::GFP(pBHR2) grown for 3 h in LB broth (Lennox) adjusted to pH 5 or pH 7. B. mallei ΔtssM::GFP(pBHR2-VirAG) grown in broth at pH 7 served as a positive control. All images were taken under the same laser power and gain. Data are representative of those from 2 independent experiments. Bar = 10 μm. (C) Immunoblot analysis of TssM and DnaK expression when B. mallei SR1 was grown in broth adjusted to pH 5 or pH 7 for 24 h. DnaK served as a loading control. Data are representative of those from 2 independent experiments. (D) Immunoblot analysis of Hcp1 and GroEL expression when B. mallei SR1 was grown at pH 5 or pH 7 for 24 h. Hcp1 was not expressed when B. mallei DDA0746 (ΔvirG) or B. mallei DDA0742 (Δhcp1) was grown at pH 5, whereas B. mallei SR1(pBHR2-virAG) expressed Hcp1 when it was grown at pH 7. GroEL served as a loading control. Data are representative of those from 2 independent experiments. (E) Immunoblot analysis of Hcp1 and GroEL expression when B. pseudomallei AI was grown at pH 5 or pH 7 for 7 h. GroEL served as a loading control. Data are representative of those from 2 independent experiments.

References

    1. Galyov EE, Brett PJ, DeShazer D. 2010. Molecular insights into Burkholderia pseudomallei and Burkholderia mallei pathogenesis. Annu Rev Microbiol 64:495–517. doi:10.1146/annurev.micro.112408.134030. - DOI - PubMed
    1. Cheng AC, Currie BJ. 2005. Melioidosis: epidemiology, pathophysiology, and management. Clin Microbiol Rev 18:383–416. doi:10.1128/CMR.18.2.383-416.2005. - DOI - PMC - PubMed
    1. Holden MT, Titball RW, Peacock SJ, Cerdeno-Tarraga AM, Atkins T, Crossman LC, Pitt T, Churcher C, Mungall K, Bentley SD, Sebaihia M, Thomson NR, Bason N, Beacham IR, Brooks K, Brown KA, Brown NF, Challis GL, Cherevach I, Chillingworth T, Cronin A, Crossett B, Davis P, DeShazer D, Feltwell T, Fraser A, Hance Z, Hauser H, Holroyd S, Jagels K, Keith KE, Maddison M, Moule S, Price C, Quail MA, Rabbinowitsch E, Rutherford K, Sanders M, Simmonds M, Songsivilai S, Stevens K, Tumapa S, Vesaratchavest M, Whitehead S, Yeats C, Barrell BG, Oyston PC, Parkhill J. 2004. Genomic plasticity of the causative agent of melioidosis, Burkholderia pseudomallei. Proc Natl Acad Sci U S A 101:14240–14245. doi:10.1073/pnas.0403302101. - DOI - PMC - PubMed
    1. Gan YH. 2005. Interaction between Burkholderia pseudomallei and the host immune response: sleeping with the enemy? J Infect Dis 192:1845–1850. doi:10.1086/497382. - DOI - PubMed
    1. Brett PJ, DeShazer D, Woods DE. 1998. Burkholderia thailandensis sp. nov., a Burkholderia pseudomallei-like species. Int J Syst Bacteriol 48(Pt 1):317–320. - PubMed

MeSH terms

LinkOut - more resources