. 2016 Nov 7;215(3):325-334.
doi: 10.1083/jcb.201608026. Epub 2016 Oct 31.

HMGB2 orchestrates the chromatin landscape of senescence-associated secretory phenotype gene loci

Affiliations

HMGB2 orchestrates the chromatin landscape of senescence-associated secretory phenotype gene loci

Katherine M Aird et al. J Cell Biol. .

Abstract

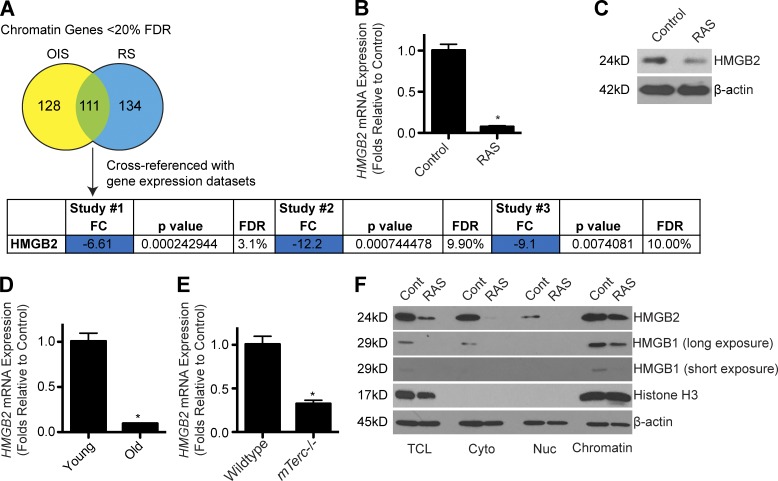
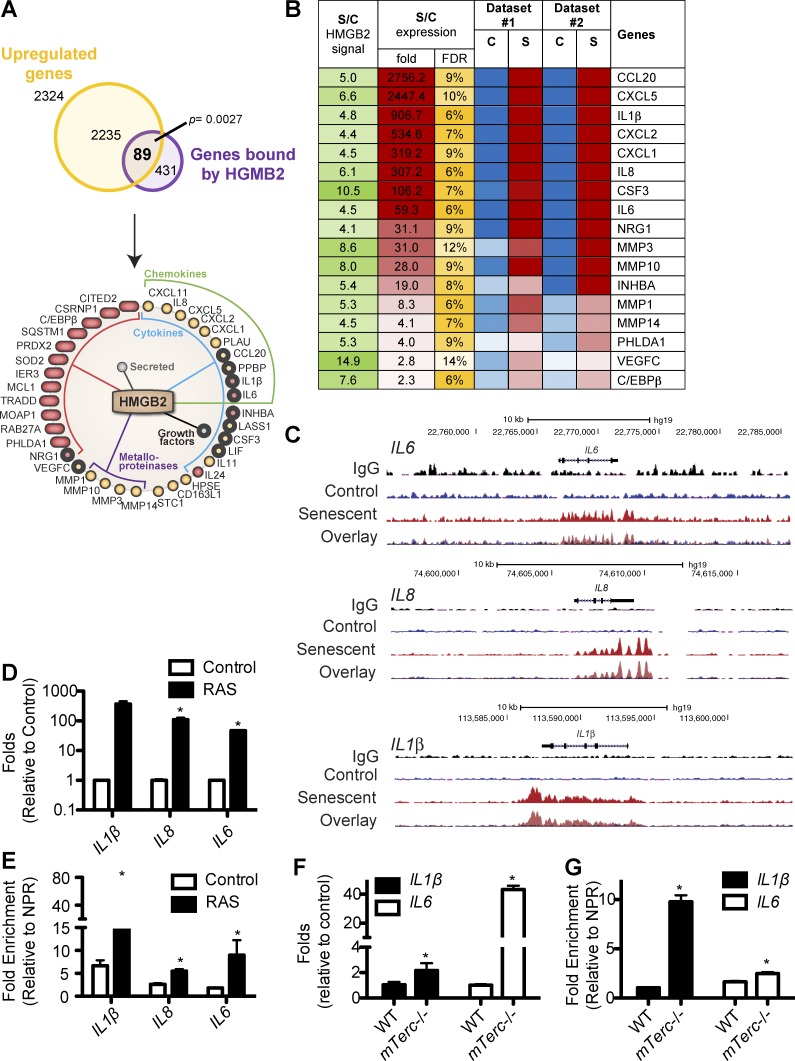
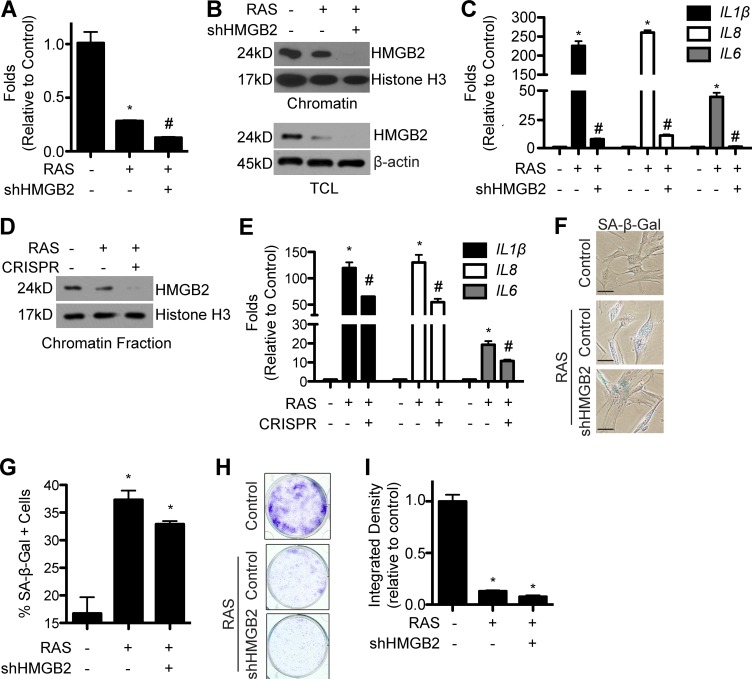
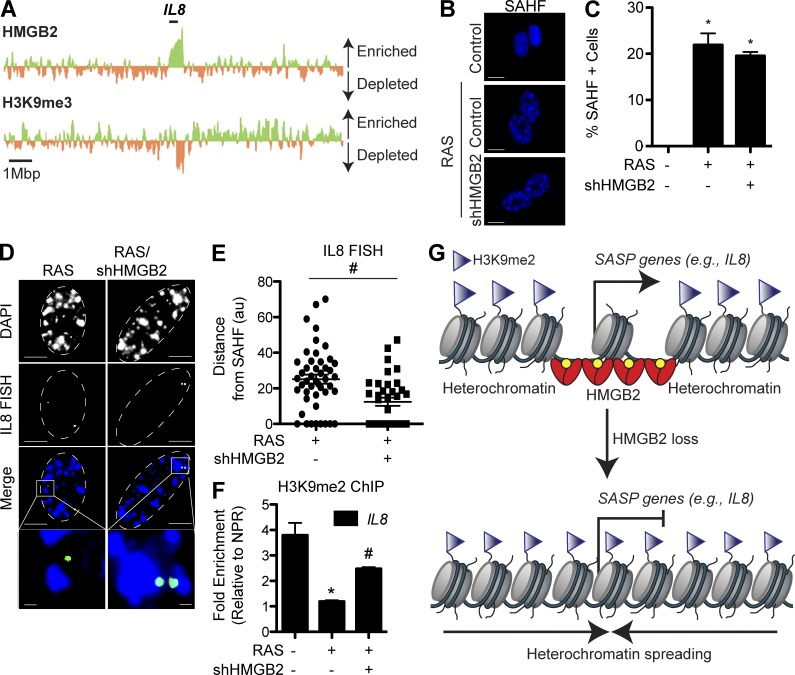
Cellular senescence is a stable cell growth arrest that is characterized by the silencing of proliferation-promoting genes through compaction of chromosomes into senescence-associated heterochromatin foci (SAHF). Paradoxically, senescence is also accompanied by increased transcription of certain genes encoding for secreted factors such as cytokines and chemokines, known as the senescence-associated secretory phenotype (SASP). How SASP genes are excluded from SAHF-mediated global gene silencing remains unclear. In this study, we report that high mobility group box 2 (HMGB2) orchestrates the chromatin landscape of SASP gene loci. HMGB2 preferentially localizes to SASP gene loci during senescence. Loss of HMGB2 during senescence blunts SASP gene expression by allowing for spreading of repressive heterochromatin into SASP gene loci. This correlates with incorporation of SASP gene loci into SAHF. Our results establish HMGB2 as a novel master regulator that orchestrates SASP through prevention of heterochromatin spreading to allow for exclusion of SASP gene loci from a global heterochromatin environment during senescence.


Figures

Figure 1.
Figure 1.
HMGB2 expression is altered during senescence. (A) Using publically available microarray databases, the most significantly altered chromatin-related genes during senescence were identified. Only genes that were significantly (P < 0.05) altered more than twofold in all four datasets were considered “hits.” Study #1: GEO accession no. GSE28464; study #2: GEO accession no. GSE40349; and study #3: GEO accession no. GSE60652. FC, fold change; FDR, false discovery rate; OIS, oncogene-induced senescence; RS, replicative senescence. (B) IMR90 cells were infected with retrovirus encoding oncogenic RAS to induce senescence or control. Cells were selected for 3 d with 1 µg/ml puromycin. 4 d later, HMGB2 mRNA expression was determined. (C) Same as B, but HMGB2 protein expression was determined in total protein lysates by immunoblot. β-Actin was used as a loading control. (D) HMGB2 mRNA expression was determined in young (PD24) and old senescent (PD60) IMR90 fibroblasts. (E) HMGB2 mRNA expression was determined in senescent G4 mTerc−/− or wild-type control ear fibroblasts. (B, D, and E) B2M expression was used as an internal control. (F) Same as B, but total cell lysates (TCL), cytoplasmic fraction (Cyto), nuclear soluble fraction (Nuc), and chromatin-bound fraction (Chromatin) were isolated, and HMGB2 and HMGB1 protein expression was determined. Long and short film exposures are shown for HMGB1. Histone H3 and β-actin were used as loading controls. For all panels, graphs shown are the mean and SEM of triplicates from a representative experiment that was independently repeated at least three times. *, P < 0.05 versus control.
Figure 2.
Figure 2.
HMGB2 preferentially binds to SASP gene loci in senescent cells. (A) HMGB2 ChIP-Seq data (GEO accession no. GSE85057) were cross-referenced with publically available microarray datasets. 89 genes were bound by HMGB2 and had increased expression in senescent cells. The significance of gene overlap was estimated and showed a significant enrichment in HMGB2-bound up-regulated genes compared with a random set of genes (P = 0.0027). The identified genes were subjected to pathway enrichment analysis by DAVID software. (B) Heatmap of SASP genes preferentially bound by HMGB2 during senescence. The ratio of HMGB2 ChIP signal and expression of the indicated genes in senescent (S) and control (C) is listed in dataset #1 (GEO accession no. GSE40349) and dataset #2 (GEO accession no. GSE60652). Green represents the signal intensity in the HMGB2 ChIP-Seq in senescent cells versus control. Red represents up-regulated genes, whereas blue represents down-regulated genes. Yellow represents the false discovery rate (FDR). (C) Representative tracks from HMGB2 ChIP-Seq for IL1β, IL8, and IL6. (D) IMR90 cells were infected with retrovirus encoding oncogenic RAS to induce senescence or controls. Cells were selected for 3 d with 1 µg/ml puromycin. 4 d later, IL1β, IL8, and IL6 mRNA expression was determined. B2M was used as an internal control. (E) Same as D, but HMGB2 ChIP was performed, and HMGB2 binding to IL1β, IL8, and IL6 was determined by quantitative PCR and normalized to a nonpeak region control. (F) Expression of IL1β and IL6 mRNA was determined by qRT-PCR in senescent G4 mTerc−/− and wild-type (WT) control mouse ear fibroblasts. B2M expression was used as an internal control. (G) Same as F, but HMGB2 ChIP was performed. HMGB2 binding to IL1β and IL6 was determined by quantitative PCR and normalized to a nonpeak region (NPR) control. For all panels, graphs shown are the mean and SEM of triplicates from a representative experiment that was independently repeated at least three times. *, P < 0.05 versus control.
Figure 3.
Figure 3.
Loss of HMGB2 blunts SASP gene expression while maintaining the senescence-associated cell growth arrest. (A) IMR90 cells were infected with retrovirus encoding oncogenic RAS alone or in combination with a lentivirus expressing an shRNA to the human HMGB2 gene (shHMGB2). Cells were selected for 3 d with 3 µg/ml puromycin. 4 d later, HMGB2 mRNA expression was determined. (B) Same as A, but both total cell lysates (TCL) and chromatin fractions were isolated, and HMGB2 protein expression was determined. Histone H3 and β-actin were used as internal loading controls. (C) Same as A, but IL1β, IL8, and IL6 mRNA expression was determined. (D) IMR90 cells were infected with retrovirus encoding oncogenic RAS alone or in combination with a Cas9-expressing lentivirus expressing a gRNA to HMGB2 (CRISPR). Cells were selected for 3 d with 3 µg/ml puromycin. 4 d later, the chromatin fraction was isolated, and HMGB2 protein expression was determined. Histone H3 was used as an internal loading control. (E) Same as D, but IL1β, IL8, and IL6 mRNA expression was determined. (A, C, and E) B2M was used as an internal control. (F) Same as A, but SA-β-Gal staining was performed. Bars, 5 µm. (G) Quantification of F. (H) Same as A, but an equal number of cells were seeded into 6-well plates and stained with crystal violet 14 d later. (I) Quantification of H. Graphs shown are the mean and SEM of triplicates from a representative experiment that was independently repeated at least three times. *, P < 0.05 versus control; #, P < 0.05 versus RAS.
Figure 4.
Figure 4.
Loss of HMGB2 allows for spreading of heterochromatin and promotes the inclusion of SASP gene loci in SAHF. (A) Cross-referencing of HMGB2 ChIP-Seq data and H3K9me3 ChIP-Seq data at the IL8 locus. Green indicates enrichment of HMGB2 or H3K9me3 binding in senescent cells, whereas orange indicates depletion of HMGB2 or H3K9me3 binding in senescent cells. The black bar indicates the IL8 genomic locus. (B) IMR90 cells were infected with retrovirus encoding oncogenic RAS alone or in combination with a lentivirus expressing an shRNA to HMGB2. Cells were selected for 3 d with 3 µg/ml puromycin. 4 d later, cells were stained for SAHF using DAPI. Bars, 10 µm. (C) Quantification of B. (D) Same as B, but 3D DNA-FISH was performed with a BAC containing the IL8 gene locus. White dashed lines indicate the nucleus. Bars: (top) 5 µm; (inset) 0.5 µm. (E) Quantification of 3D DNA-FISH. The distance between IL8 loci and the nearest SAHF was determined using ImageJ software (au, arbitrary units). At least 50 nuclei were quantified. Horizontal bars denote the comparison between RAS alone and RAS/shHMGB2. (F) Same as B, but H3K9me2 ChIP was performed, and H3K9me2 binding to IL8 was determined by quantitative PCR and normalized to a nonpeak region (NPR) control. (G) Scheme of how HMGB2 binds to SASP genes to promote their transcription (left). Loss of HMGB2 allows for spreading of repressive senescence-associated heterochromatin to inhibit SASP gene expression (right). Graphs shown are the mean and SEM of triplicates from a representative experiment that was independently repeated at least three times. *, P < 0.05 versus control; #, P < 0.05 versus RAS.

References

    1. Acosta J.C., O’Loghlen A., Banito A., Guijarro M.V., Augert A., Raguz S., Fumagalli M., Da Costa M., Brown C., Popov N., et al. 2008. Chemokine signaling via the CXCR2 receptor reinforces senescence. Cell. 133:1006–1018. 10.1016/j.cell.2008.03.038 - DOI - PubMed
    1. Aird K.M., Zhang G., Li H., Tu Z., Bitler B.G., Garipov A., Wu H., Wei Z., Wagner S.N., Herlyn M., and Zhang R.. 2013. Suppression of nucleotide metabolism underlies the establishment and maintenance of oncogene-induced senescence. Cell Reports. 3:1252–1265. 10.1016/j.celrep.2013.03.004 - DOI - PMC - PubMed
    1. Aksoy O., Chicas A., Zeng T., Zhao Z., McCurrach M., Wang X., and Lowe S.W.. 2012. The atypical E2F family member E2F7 couples the p53 and RB pathways during cellular senescence. Genes Dev. 26:1546–1557. 10.1101/gad.196238.112 - DOI - PMC - PubMed
    1. Bianchi M.E., and Agresti A.. 2005. HMG proteins: dynamic players in gene regulation and differentiation. Curr. Opin. Genet. Dev. 15:496–506. 10.1016/j.gde.2005.08.007 - DOI - PubMed
    1. Biniossek M.L., Lechel A., Rudolph K.L., Martens U.M., and Zimmermann S.. 2013. Quantitative proteomic profiling of tumor cell response to telomere dysfunction using isotope-coded protein labeling (ICPL) reveals interaction network of candidate senescence markers. J. Proteomics. 91:515–535. 10.1016/j.jprot.2013.08.007 - DOI - PubMed