. 2016 Nov 7;215(3):383-399.
doi: 10.1083/jcb.201603080. Epub 2016 Oct 31.

Formin-generated actomyosin arcs propel T cell receptor microcluster movement at the immune synapse

Affiliations

Formin-generated actomyosin arcs propel T cell receptor microcluster movement at the immune synapse

Sricharan Murugesan et al. J Cell Biol. .

Abstract

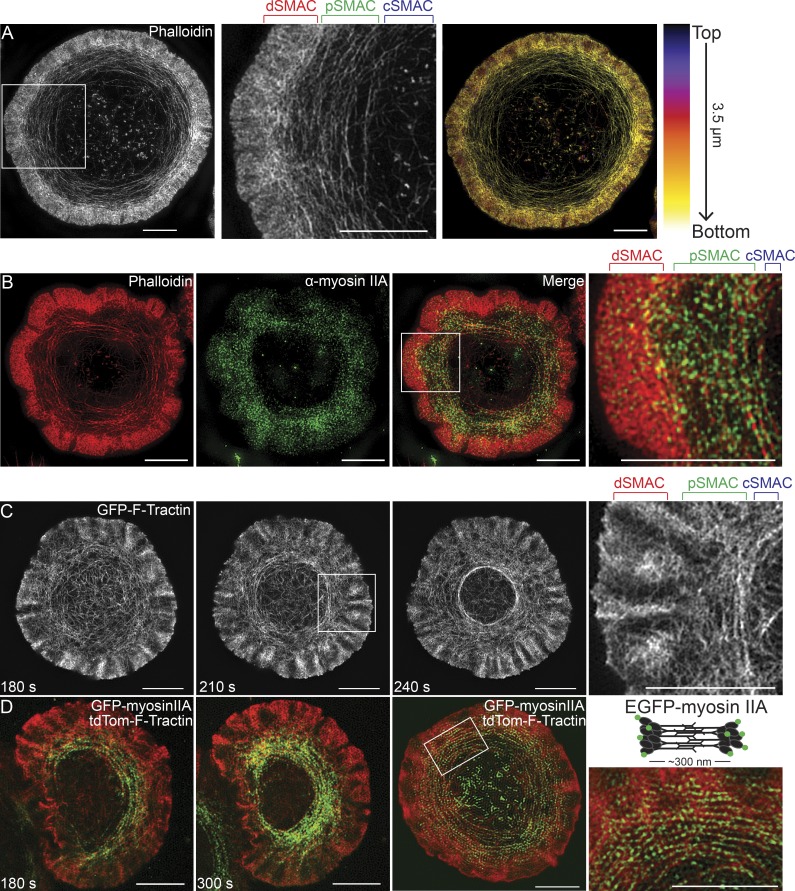
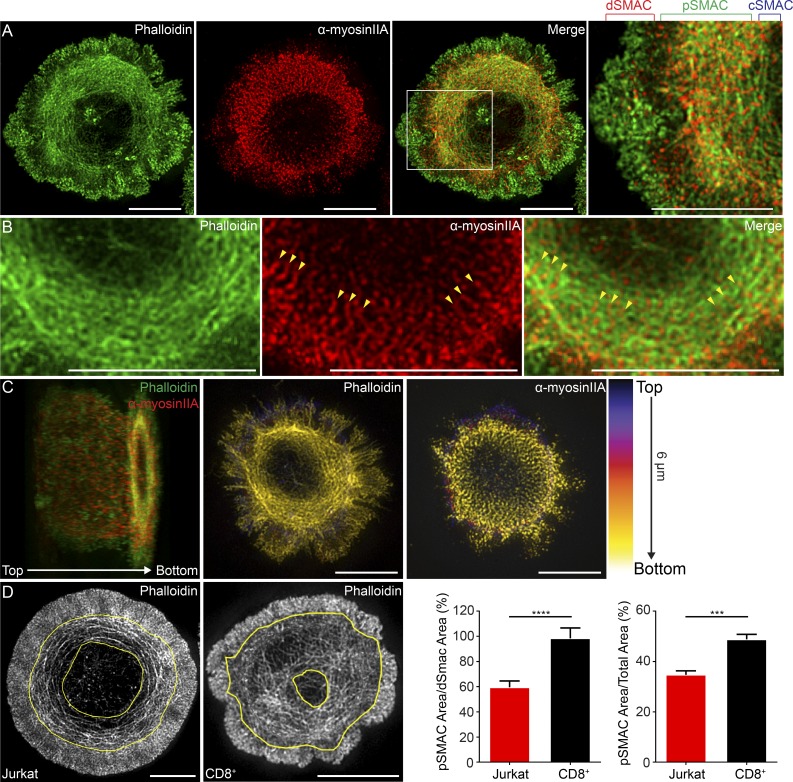
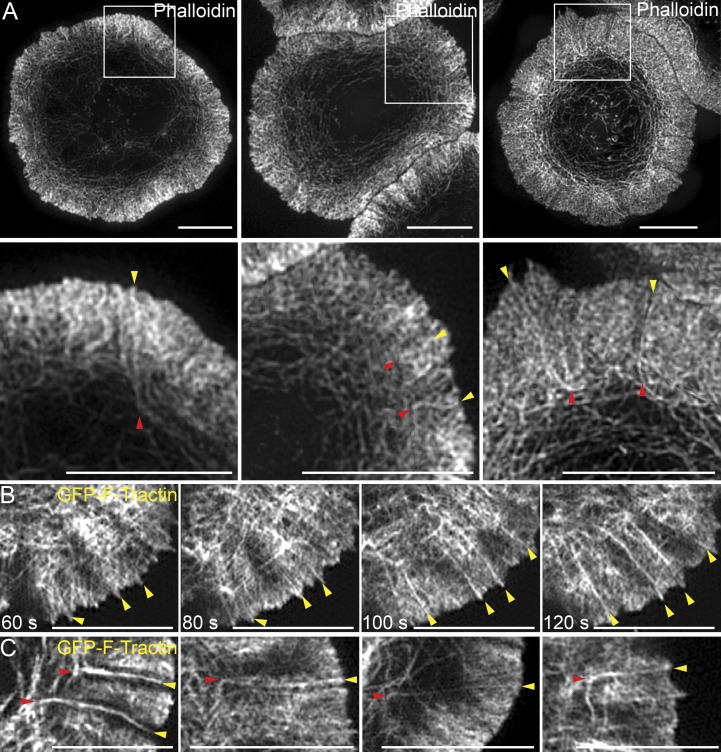
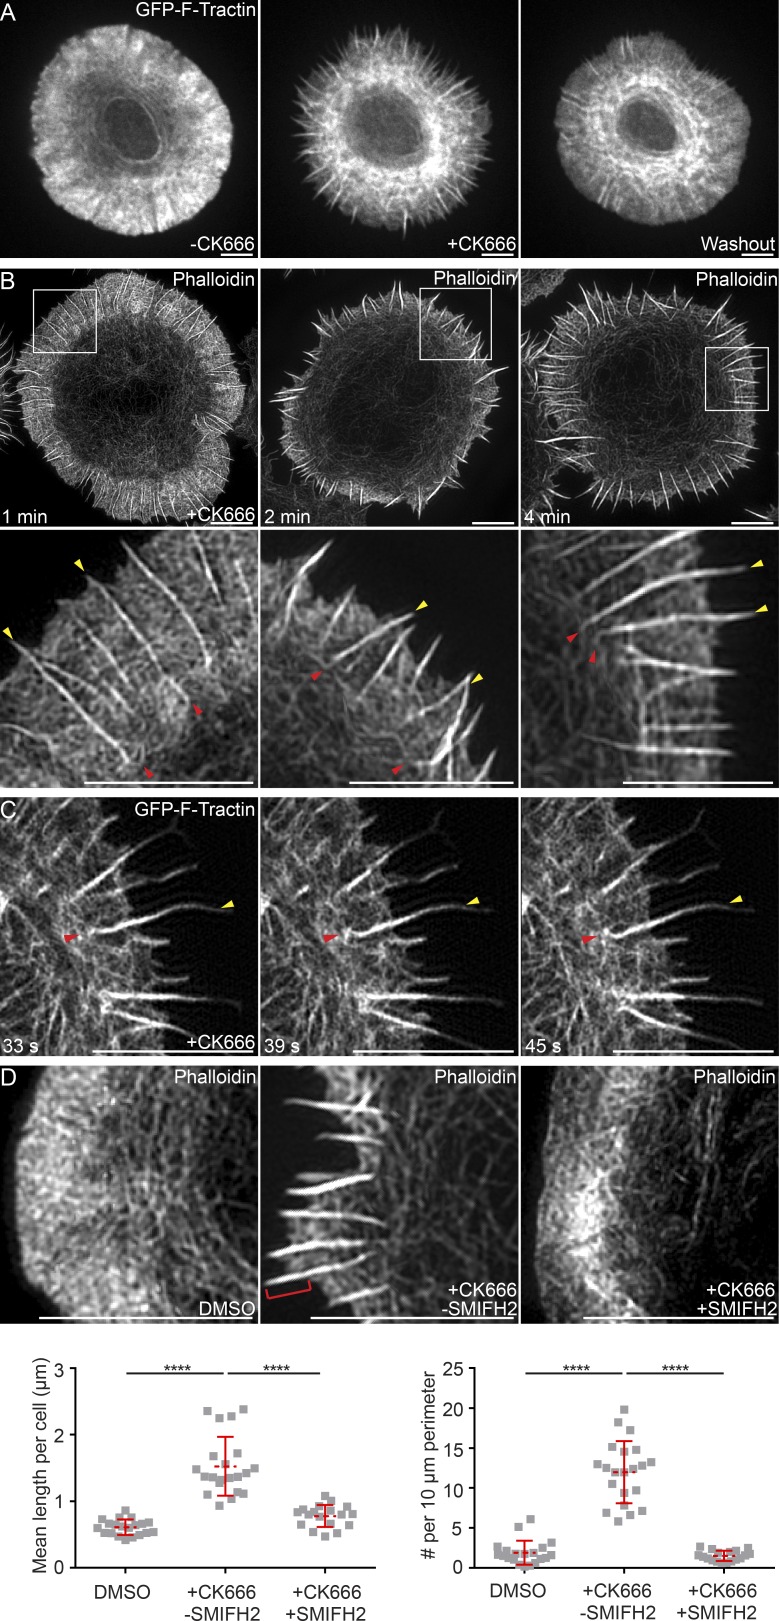
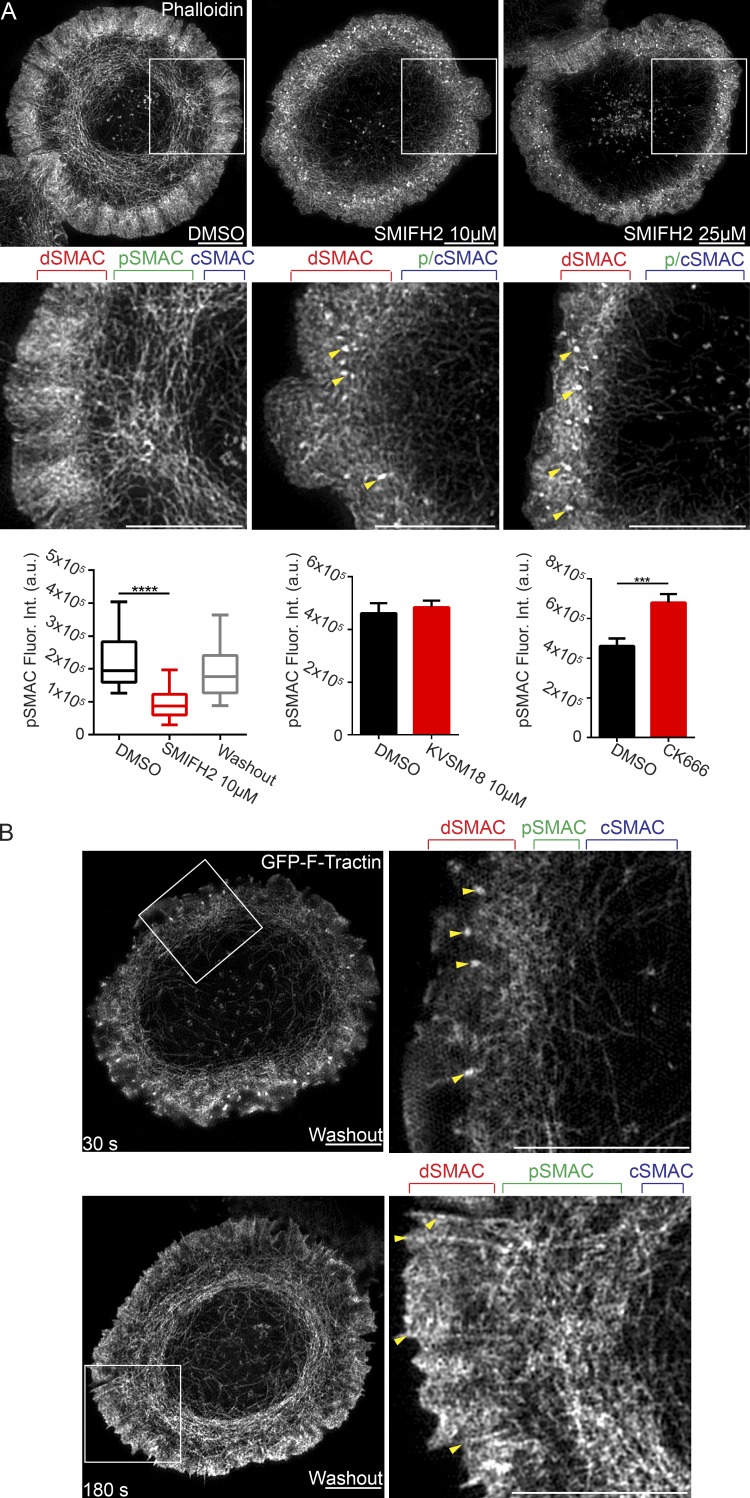
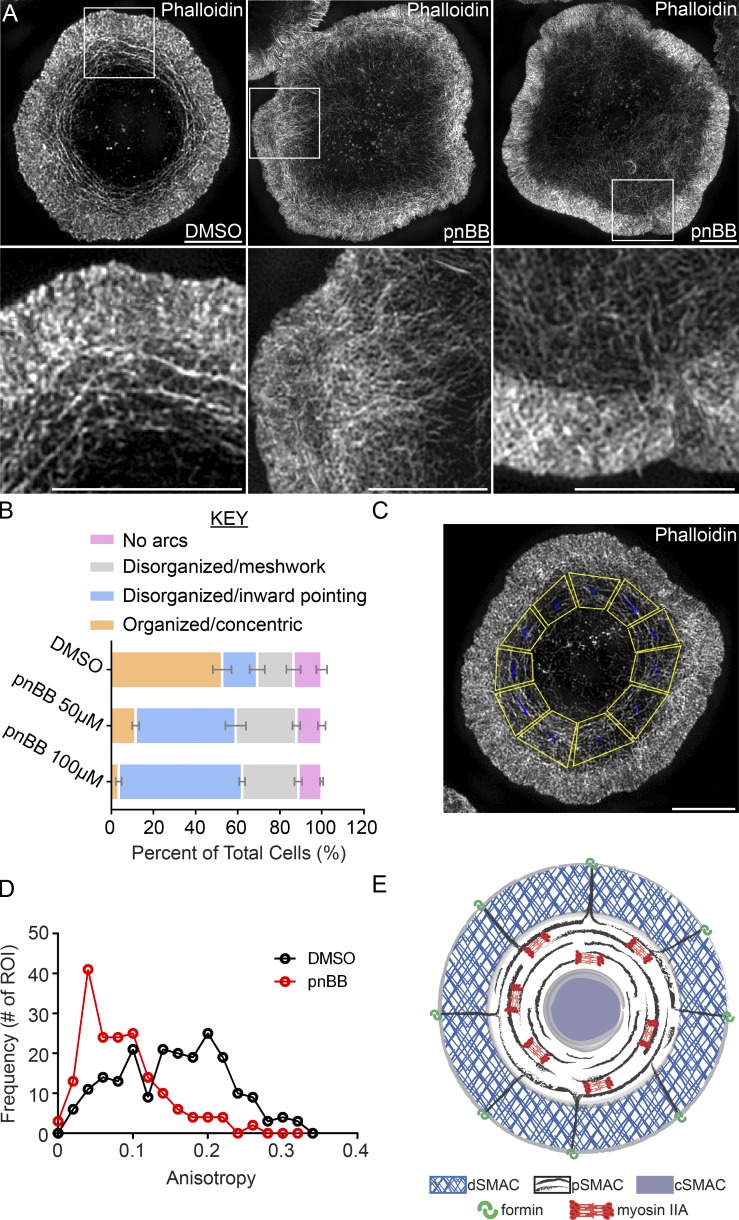
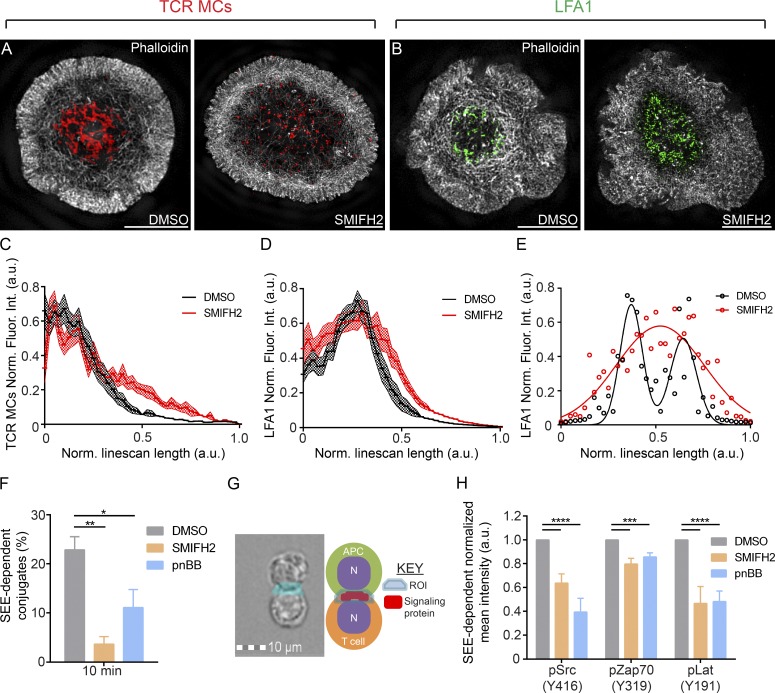
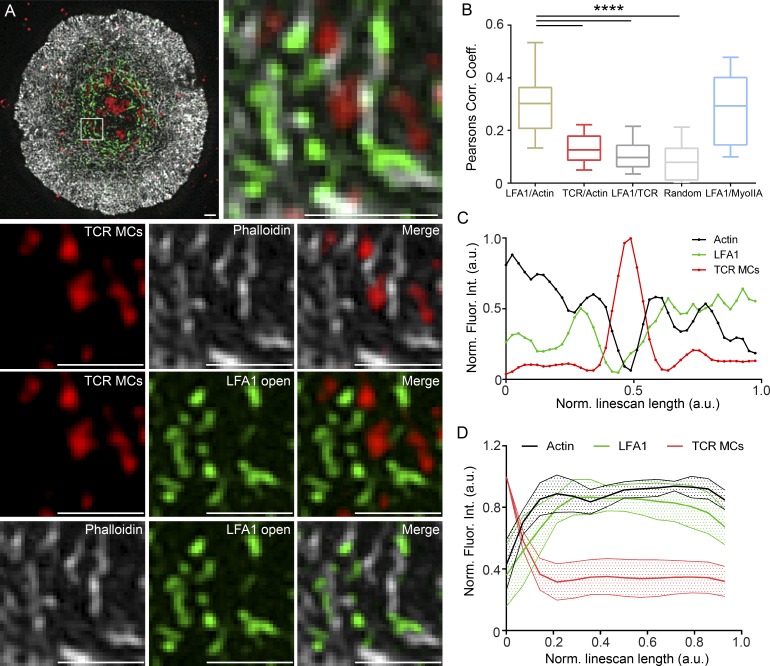
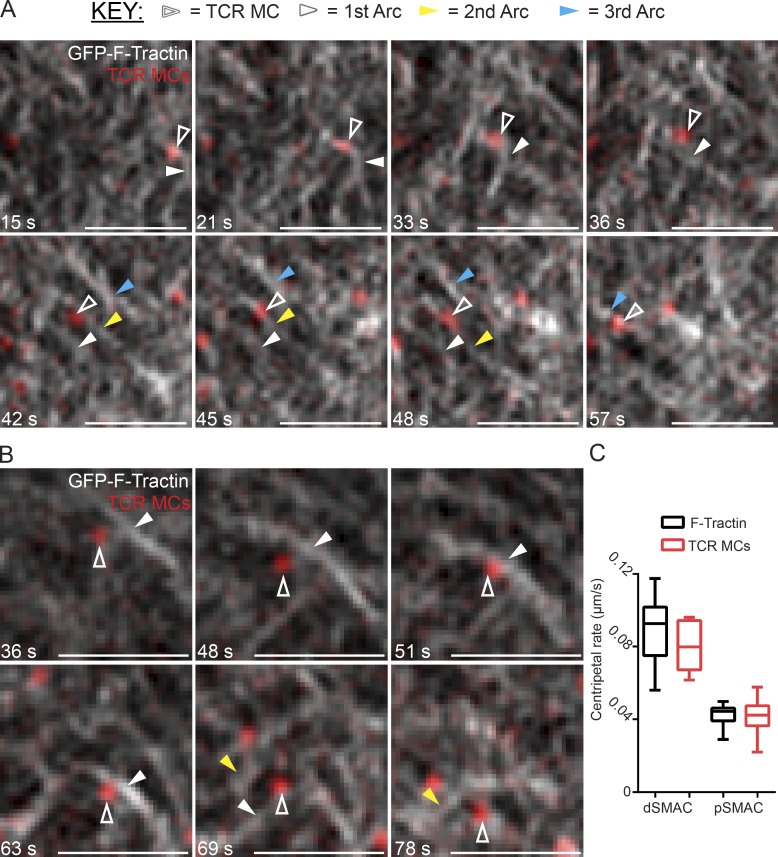
Actin assembly and inward flow in the plane of the immunological synapse (IS) drives the centralization of T cell receptor microclusters (TCR MCs) and the integrin leukocyte functional antigen 1 (LFA-1). Using structured-illumination microscopy (SIM), we show that actin arcs populating the medial, lamella-like region of the IS arise from linear actin filaments generated by one or more formins present at the IS distal edge. After traversing the outer, Arp2/3-generated, lamellipodia-like region of the IS, these linear filaments are organized by myosin II into antiparallel concentric arcs. Three-dimensional SIM shows that active LFA-1 often aligns with arcs, whereas TCR MCs commonly reside between arcs, and total internal reflection fluorescence SIM shows TCR MCs being swept inward by arcs. Consistently, disrupting actin arc formation via formin inhibition results in less centralized TCR MCs, missegregated integrin clusters, decreased T-B cell adhesion, and diminished TCR signaling. Together, our results define the origin, organization, and functional significance of a major actomyosin contractile structure at the IS that directly propels TCR MC transport.


Figures

Figure 1.
Figure 1.
SIM imaging reveals concentric actomyosin arcs in the pSMAC region of the Jurkat T cell IS. (A, first and second panel) 3D-SIM image of an activated Jurkat T cell stained with phalloidin. (A, third panel) Cell in first panel color-coded by z position. Lighter colors are closer to the coverslip. (B) 3D-SIM image of a Jurkat T cell stained with phalloidin (red) and anti–myosin IIA antibody (green). Individual channels and the merged image are shown. (C) Still images from a TIRF-SIM video of a Jurkat T cell expressing GFP–F-Tractin (Video 1). (D) Still images from two color TIRF-SIM videos of two different Jurkat T cells expressing GFP–myosin IIA and tdTomato–F-Tractin (Video 2, corresponding to third panel). SMAC zones bracketed in A–C at top. Bars, 5 µm.
Figure 2.
Figure 2.
Actomyosin arcs are also a very prominent feature of the primary mouse CD8+ T cell IS. (A) 3D-SIM image of a primary mouse CD8+ T cell stained with phalloidin (green) and anti–myosin IIA antibody (red). (B) Magnified views of actomyosin arcs in a separate CD8+ T cell stained as in A. Yellow arrowheads mark sarcomere-like pattern of myosin IIA. (C, left) Cell in B color-coded by z position; each channel is separated in middle and right panels. Lighter colors are closer to the coverslip. (D) Area occupied by pSMAC actin arcs (bracketed by yellow traces) in typical Jurkat IS (first panel) and primary mouse CD8+ T cell IS (second panel). The ratio of pSMAC to dSMAC area (third panel) and pSMAC to total IS area (fourth panel) for Jurkat and mouse CD8+ T cells. n = 17–24 cells/condition. Data are means ± SEM. SMAC zones bracketed in A at top. Bars, 5 µm. ***, P < 0.001; ****, P < 0.0001.
Figure 3.
Figure 3.
SIM imaging reveals linear actin filaments/bundles embedded in the branched actin network of dSMAC. (A) 3D-SIM images of three representative phalloidin-stained Jurkat T cells. (B) Successive still images from a TIRF-SIM video of a Jurkat expressing GFP–F-Tractin (Video 3). (C) Four still images from TIRF-SIM videos of Jurkats expressing GFP–F-Tractin. Yellow arrowheads mark the origin of linear actin filaments/bundles embedded in the branched actin network of the dSMAC, whereas red arrowheads mark where they bend upon exit from the dSMAC. See also Video 4. Bars, 5 µm.
Figure 4.
Figure 4.
Arp2/3 inhibition augments the assembly of the formin-nucleated linear actin filaments in the dSMAC. (A) Still images from a confocal video of a Jurkat T cell expressing GFP–F-Tractin before (left) and 3 min after (middle) treatment with 25 µM CK666 and after drug washout (right; and Video 5). (B) 3D-SIM images of phalloidin-stained Jurkat T cells treated with 25 µM CK666 for the indicated times. (C) Still images from a TIRF-SIM video of a Jurkat T cell expressing GFP–F-Tractin treated with CK666 as in B (Video 6). (D, top) 3D-SIM images of Jurkats treated with DMSO, 25 µM CK666, or 25 µM CK666 plus 10 µM SMIFH2 and stained with phalloidin. The red bracket in the second panel marks a spike. (D, bottom) Quantitation of mean length of linear actin spikes per cell (left) and their surface density (right). n = 16–22 cells/condition. In B and C, yellow arrowheads mark linear actin spikes, and red arrowheads mark their bend points. Data are means ± SD. Bars, 5 µm. ****, P < 0.0001.
Figure 5.
Figure 5.
Formin inhibition blocks actin arc formation. (A, micrographs) 3D-SIM images of Jurkat T cells treated with DMSO, 10 µM SMIFH2, or 25 µM SMIFH2 and stained with phalloidin. Yellow arrowheads mark actin foci. (A, bottom) Mean phalloidin fluorescence in the pSMAC. n = 21–30 cells/condition. Box plots are centered on means and display upper and lower quartile ranges and min to max values. Bar graphs are means ± SEM. (B, top) Still image from a TIRF-SIM video of a Jurkat T cell expressing GFP–F-Tractin 30 s after SMIFH2 washout. Yellow arrowheads mark actin foci. (B, bottom) Still image from the same TIRF-SIM video 180 s after SMIFH2 washout. Yellow arrowheads mark linear actin filaments. SMAC zones are bracketed in A and B at top. See also Video 7. Bars, 5 µm. ***, P < 0.001; ****, P < 0.0001. a.u., arbitrary units; Fluor. Int., fluorescence intensity.
Figure 6.
Figure 6.
Myosin IIA inhibition disrupts actin arc organization. (A) 3D-SIM images of a Jurkat pretreated with DMSO and two Jurkats pretreated with 50 µM pnBB for 30 min and stained with phalloidin (Video 9). (B) Cells were scored for actin arc morphology as indicated. n = 100 cells/condition; three experiments per condition; data are means ± SD (see Materials and methods for details). (C) Boxed regions covering the pSMAC (yellow) were quantitated for actin arc anisotropy in D using FibrilTool. n = 22–26 cells/condition. (E) Model depicting formin-dependent actomyosin arc formation at the IS. Bars, 5 µm.
Figure 7.
Figure 7.
Functional consequences of formin inhibition. (A) 3D-SIM images of phalloidin-stained (grayscale) DMSO-treated or 10 µM SMIFH2-treated Jurkat T cells stimulated on planar lipid bilayers containing Alexa Fluor 647–labeled anti-CD3 (red) to report TCR MC distribution. (B) Same as in A, except cells were stained with M24 antibody (green) during IS formation to determine the distribution of open, active LFA-1. Radial plot profiles of TCR MCs (C) and LFA-1 clusters (D) after DMSO or SMIFH2 treatment. n = 14–16 cells/condition; Data are means ± SEM; P < 0.0001, two-way ANOVA. (E) Line scans across cells in B fit to Gaussian distributions. (F) Adhesion conjugate assay after DMSO, SMIFH2, or pnBB treatment. n ≥ 3 independent experiments; data are means ± SEM. (G) Combination masking strategy to quantitate fluorescence at the T cell IS. (H) Imaging flow cytometry of Jurkat T–B cell conjugates fixed, immunostained, and analyzed on a flow cytometer for background-corrected MFI (Norm. Fluor. Int.) of the indicated signaling proteins after DMSO, SMIFH2, or pnBB treatment. n ≥ 3 independent experiments; data are means ± SEM. Note that the differences remain statistically significant even when background correction is omitted (DNS). Bars, 5 µm. *, P < 0.05; **, P < 0.01; ***, P < 0.001; ****, P < 0.0001. a.u., arbitrary units; Norm. Fluor. Int., normalized fluorescence intensity.
Figure 8.
Figure 8.
On average, TCR MCs reside between arcs, whereas active LFA-1 coincides with arcs in maturing synapses. (A) Three-color 3D-SIM imaging of endogenous actin (grayscale), TCR MCs (red), and open, active LFA-1 (green) at a Jurkat T cell IS 6 min after bilayer engagement. (A, bottom nine panels) Pairwise comparisons of the actin, LFA-1, and TCR MC channels and overlays. (B) Pearson’s correlation coefficient; n = 20–40 cells/correlation. Box plots are centered on means and display upper and lower quartile ranges and min to max values. (C) Line scans across population-averaged TCR MCs. n = 110. (D) Radial plot profiles of population-averaged TCR MCs. n = 11 cells; 10–15 TCR MCs/cell. Data are means ± SEM. Note that TCR MCs overlap considerably with F-actin during initial cell spreading (Lam Hui et al., 2014). Bars, 1 µm. ****, P < 0.0001. a.u., arbitrary units; MyoIIA, myosin IIA; Norm. Fluor. Int., normalized fluorescence intensity.
Figure 9.
Figure 9.
Actin arcs propel the centripetal transport of TCR MCs across the pSMAC. (A and B) Still images from two separate TIRF-SIM videos of Jurkat T cells expressing GFP–F-Tractin (grayscale) stimulated on planar lipid bilayers containing Alexa Fluor 568–labeled anti-CD3 antibody (red) to report TCR MC movement (Videos 9 and 10). (C) Quantitation of rates of centripetal movement of actin and TCR MCs across the dSMAC and pSMAC obtained from Videos 9 and 10. n = 15–19 measurements/condition. Box plots are centered on means and display upper and lower quartile ranges and min to max values. Bars, 1 µm.

References

    1. Babich A., Li S., O’Connor R.S., Milone M.C., Freedman B.D., and Burkhardt J.K.. 2012. F-actin polymerization and retrograde flow drive sustained PLCγ1 signaling during T cell activation. J. Cell Biol. 197:775–787. 10.1083/jcb.201201018 - DOI - PMC - PubMed
    1. Balagopalan L., Ashwell B.A., Bernot K.M., Akpan I.O., Quasba N., Barr V.A., and Samelson L.E.. 2011. Enhanced T-cell signaling in cells bearing linker for activation of T-cell (LAT) molecules resistant to ubiquitylation. Proc. Natl. Acad. Sci. USA. 108:2885–2890. 10.1073/pnas.1007098108 - DOI - PMC - PubMed
    1. Basu R., Whitlock B.M., Husson J., Le Floc’h A., Jin W., Oyler-Yaniv A., Dotiwala F., Giannone G., Hivroz C., Biais N., et al. 2016. Cytotoxic T cells use mechanical force to potentiate target cell killing. Cell. 165:100–110. 10.1016/j.cell.2016.01.021 - DOI - PMC - PubMed
    1. Beach J.R., Shao L., Remmert K., Li D., Betzig E., and Hammer J.A. III. 2014. Nonmuscle myosin II isoforms coassemble in living cells. Curr. Biol. 24:1160–1166. (published erratum appears in Curr. Biol. 2015. 25:402) 10.1016/j.cub.2014.03.071 - DOI - PMC - PubMed
    1. Beemiller P., and Krummel M.F.. 2013. Regulation of T-cell receptor signaling by the actin cytoskeleton and poroelastic cytoplasm. Immunol. Rev. 256:148–159. 10.1111/imr.12120 - DOI - PMC - PubMed

MeSH terms