. 2016 Nov 15;113(46):13063-13068.
doi: 10.1073/pnas.1613701113. Epub 2016 Oct 31.

Complex I assembly into supercomplexes determines differential mitochondrial ROS production in neurons and astrocytes

Affiliations

Complex I assembly into supercomplexes determines differential mitochondrial ROS production in neurons and astrocytes

Irene Lopez-Fabuel et al. Proc Natl Acad Sci U S A. .

Abstract

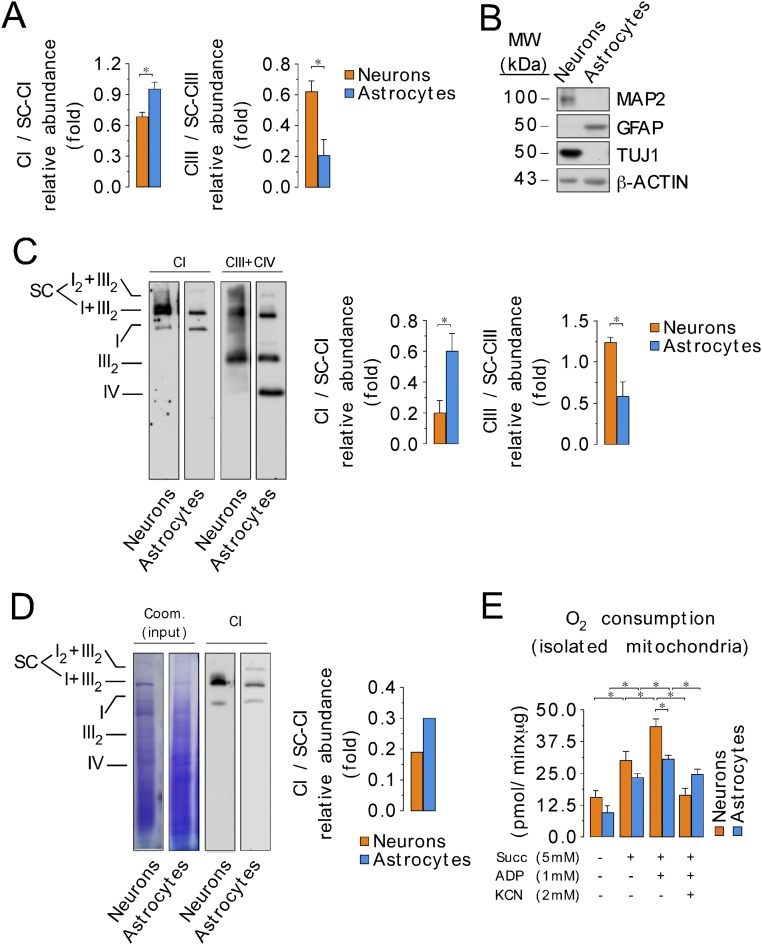
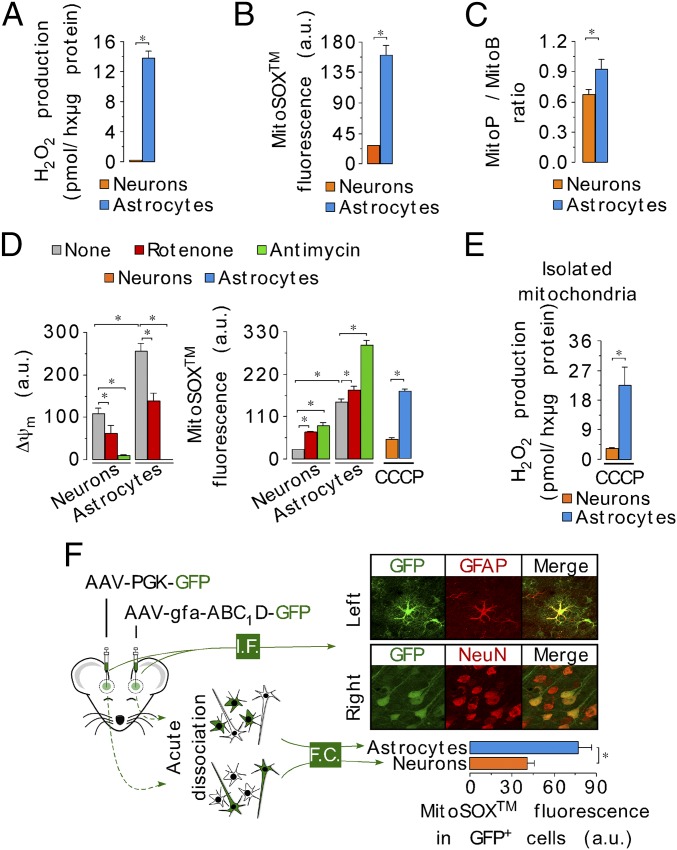
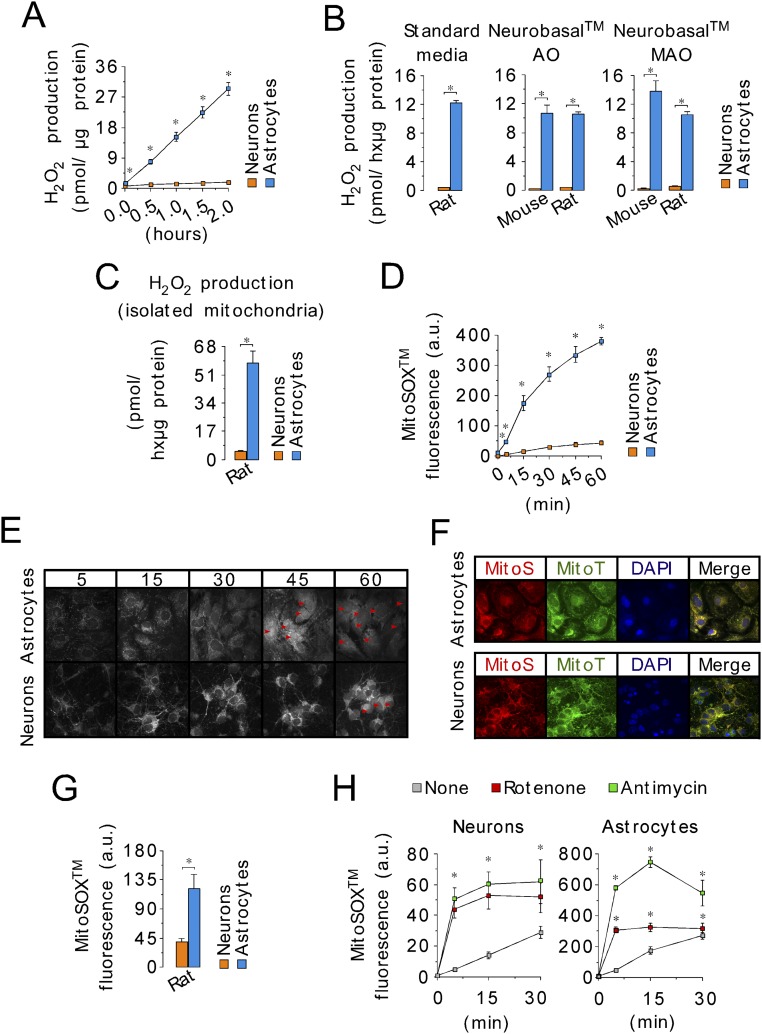
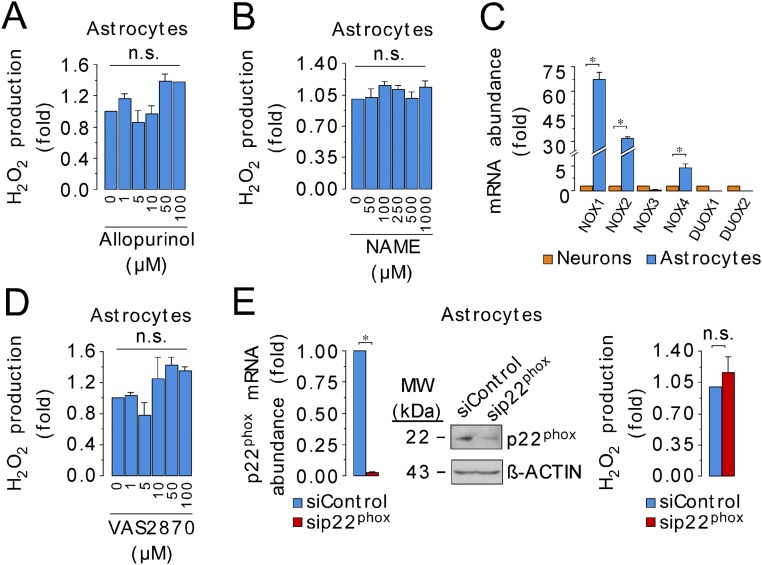
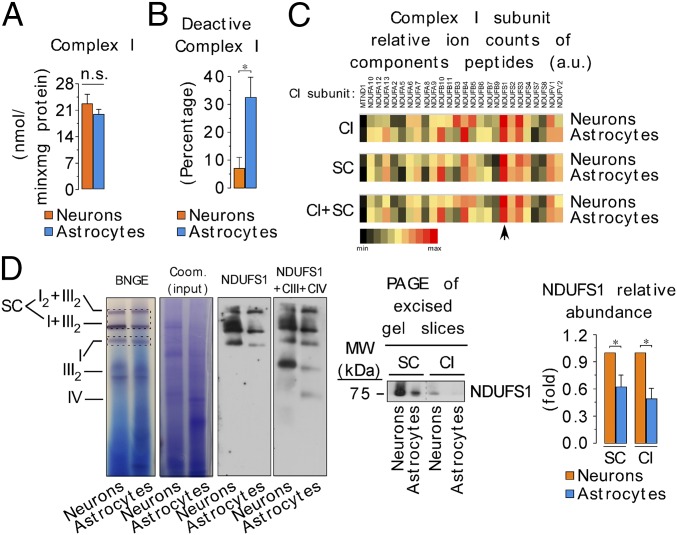
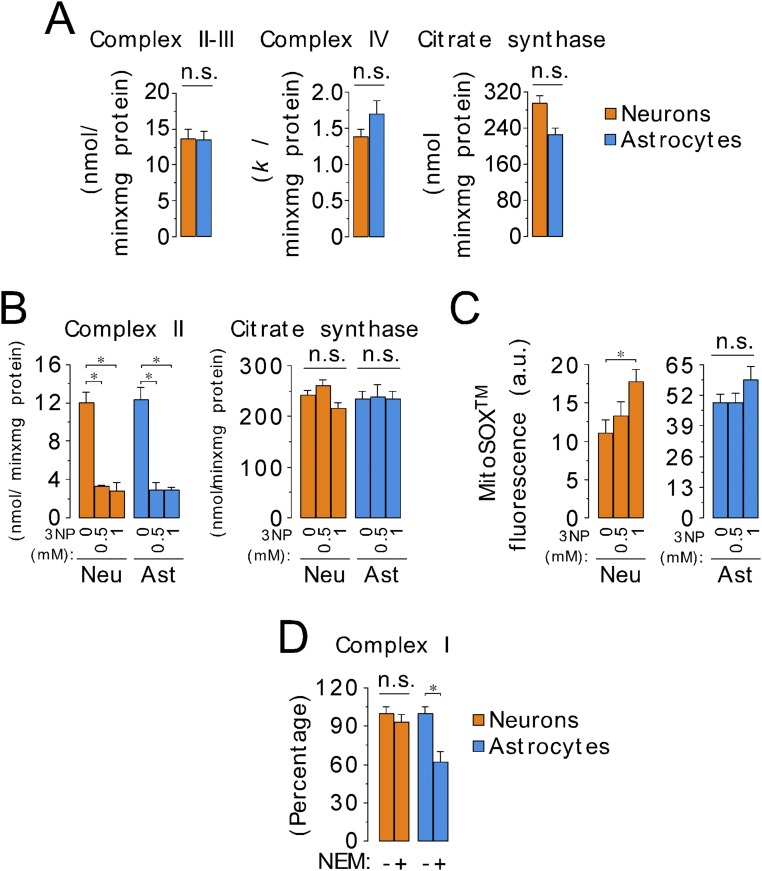
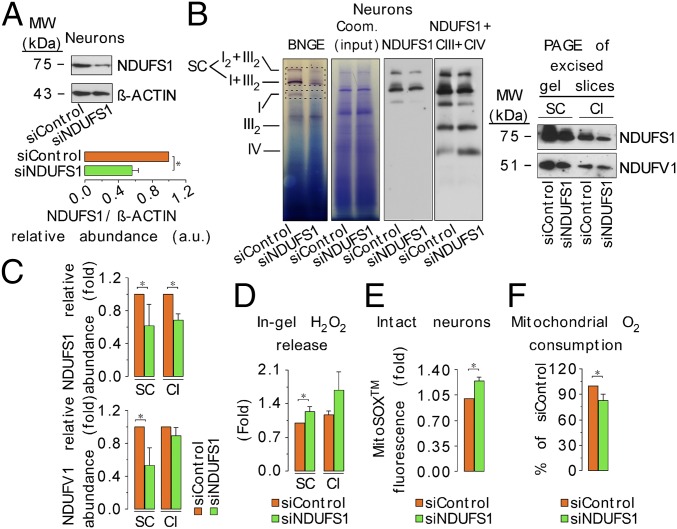
Neurons depend on oxidative phosphorylation for energy generation, whereas astrocytes do not, a distinctive feature that is essential for neurotransmission and neuronal survival. However, any link between these metabolic differences and the structural organization of the mitochondrial respiratory chain is unknown. Here, we investigated this issue and found that, in neurons, mitochondrial complex I is predominantly assembled into supercomplexes, whereas in astrocytes the abundance of free complex I is higher. The presence of free complex I in astrocytes correlates with the severalfold higher reactive oxygen species (ROS) production by astrocytes compared with neurons. Using a complexomics approach, we found that the complex I subunit NDUFS1 was more abundant in neurons than in astrocytes. Interestingly, NDUFS1 knockdown in neurons decreased the association of complex I into supercomplexes, leading to impaired oxygen consumption and increased mitochondrial ROS. Conversely, overexpression of NDUFS1 in astrocytes promoted complex I incorporation into supercomplexes, decreasing ROS. Thus, complex I assembly into supercomplexes regulates ROS production and may contribute to the bioenergetic differences between neurons and astrocytes.

Keywords: bioenergetics; brain; glycolysis; lactate; redox.


Conflict of interest statement

The authors declare no conflict of interest.

Figures

Fig. 1.
Fig. 1.
Different assembly of complex I into supercomplexes between neurons and astrocytes correlates with ROS production and mitochondrial respiration. (A) Digitonin-solubilized isolated mitochondria from mouse astrocytes and neurons were subjected to blue native gel electrophoresis (BNGE) followed by in-gel complex I activity assay. Complex I occurs both free and bound with complex III (I+III2 and I2+III2 supercomplexes). Direct electrotransfer of the native proteins to nitrocellulose followed by immunoblotting against NDUFB8 (a complex I subunit) or UQCRC2 (a complex III subunit). (B) Western blotting against NDUFB8 and UQCRC2 in whole-cell protein extracts showing the relative abundance of complex I versus complex III in astrocytes and neurons. (C) Slices were excised from digitonin-solubilized isolated astrocyte and neuronal mitochondria blue native gels, and the abundances of complex I subunits in free complex I (CI), relative to the abundance of those in I+III2 and I2+III2 supercomplexes (SC), were assessed by complexomics. (D) Rotenone-sensitive NADH-ubiquinone oxidoreductase activity of the excised and electroeluted free complex I and complex I-supercomplexes bands from the blue native gel in astrocytes and neurons. Data were not normalized per protein abundance in the eluate, as we aimed to assess the amount of total complex I activity present in each band. (E) In-gel H2O2 production in the excised SC and CI bands from the BNGE in astrocytes and neurons. H2O2 production values were normalized by the NADH dehydrogenase-activity band intensity obtained in the BNGE. (F) Pyruvate/malate (5 mM each)-driven mitochondrial oxygen consumption in isolated mitochondria from neurons or astrocytes under state 2 (0 mM ADP) or state 3 (1 mM ADP), either in the absence or in the presence of KCN (2 mM). (G) Rate of H2O2 production assessed using the AmplexRed assay, in mitochondria isolated from neurons and astrocytes, in the presence and absence of pyruvate/malate (5 mM each). Data are the mean values ± SEM from n = 3–4 independent culture preparations (Student’s t test; ANOVA post hoc Bonferroni). *P < 0.05.
Fig. S1.
Fig. S1.
Organization of mitochondrial electron transport chain. (A) Relative abundance of complex I and complex III, in free complex (CI or CIII) versus the abundance of the complexes into I2+III2 and I+III2 supercomplexes (CI-SC or CIII-SC), after the quantification of bands intensity in direct immunoblotting of BNGE against either complex I subunit NDUFB8 or III subunit UQCRC2. (B) Characterization of neurons and astrocytes freshly purified from mouse brain using the MACS technology by Western blotting against neuronal (TUJ1 and MAP2) and astrocytic marker (GFAP). (C) Mitochondrial electron transport chain organization, assayed by BNGE followed by direct immunoblotting against complex I (CI; NDUFS1) or complex III (CIII; UQCRC2) plus complex IV (CIV; MT-CO1), from neurons and astrocytes freshly obtained from mouse brain using the MACS technology. The results of the quantification of the relative abundance of CI and CIII in free/supercomplexes bands (SC; I2+III2 plus I+III2) after electroblotting of BNGE is shown. (D) BNGE followed by direct immunoblotting against complex I subunit NDUFS1 (CI) in primary cultures of neurons and astrocytes incubated at 11% of O2 for 24 h. The Coomassie-stained proteins is shown as an indicator of loaded proteins. The quantification of the relative abundance of CI in free/supercomplexes bands (SC; I2+III2 plus I+III2) after electroblotting of BNGE in a representative experiment is shown. (E) Succinate (5 mM)-driven mitochondrial oxygen consumption in isolated mitochondria from neurons or astrocytes under state 2 (0 mM ADP) or state 3 (1 mM ADP), either in the absence or in the presence of KCN (2 mM). Data are the mean values ± SEM from n = 3–4 independent culture preparations or animals (Student’s t test). *P < 0.05.
Fig. 2.
Fig. 2.
Higher mitochondrial ROS production in astrocytes than in neurons occurs ex vivo. (A) Rates of H2O2 production assessed using the AmplexRed assay, in intact C56BL/6 mouse neurons and astrocytes in primary culture. (B) Mitochondrial ROS was quantified using the MitoSox assay in the intact cells (C57BL/6) by flow cytometry. (C) Mitochondrial ROS levels assessed using MitoB probe. Ratio between MitoP (oxidized form) versus MitoB is normalized per million of cells. (D) Mitochondrial membrane potential (∆ψm) (Left) and MitoSox fluorescence (Right) were determined in basal conditions and after the inhibition of complex I (rotenone) or complex III (antimycin). Rotenone or antimycin was used at 10 µM, each, for 15 min. Furthermore, MitoSox fluorescence was evaluated after cell preincubation with the uncoupler CCCP (10 µM, 15 min). (E) Mitochondrial H2O2 production after ∆ψm abolishment with the uncoupler CCCP (10 µM). (F) Mitochondrial ROS abundance (MitoSox) assessed by flow cytometry (FC) in freshly isolated neurons and astrocytes from adult brain mouse expressing GFP governed either by an astrocyte (gfa-ABC1D) or a neuronal (PGK) promoter. Cell specificity of promoter-driven GFP expression was validated by immunofluorescence (I.F.) microscopy using astrocyte (GFAP) or neuronal (NeuN) markers. (Magnification: 40×.) Data are the mean values ± SEM from n = 3–4 independent culture preparations or n = 8 animals (Student’s t test; ANOVA post hoc Bonferroni). *P < 0.05.
Fig. S2.
Fig. S2.
The higher ROS production in astrocytes compared with neurons is conserved in mouse and rat and is not dependent on cell culture conditions. (A) A kinetics analysis of H2O2 production in neurons and astrocytes from C57BL/6 mice assayed by AmplexRed shows linearity with time up to 2 h. (B) Rates of H2O2 production, as assessed using the AmplexRed assay, in intact C56BL/6 mouse or Wistar rat neurons and astrocytes in primary culture, after replacement of the standard medium with antioxidants (standard medium or Neurobasal AO) or without antioxidant (Neurobasal MAO) for the last 24 h. (C) Rates of H2O2 production assessed using the AmplexRed assay, in mitochondria isolated from Wistar rat neurons and astrocytes in primary culture. (D) Mitochondrial ROS as quantified using the MitoSox assay in the intact cells by flow cytometry at different times. (E) Confocal images of neurons and astrocytes loaded with MitoSox showing mitochondrial-like localization of the probe at 5, 15, and 30 min, but both mitochondrial-like and nuclear (red arrows) localization at 45 and 60 min. Accordingly, MitoSox fluorescence was evaluated at 30 min (or 15 min) in all subsequent experiments. (Magnification: 40×.) (F) To confirm mitochondrial, but not nuclear, MitoSox localization at 30 min, confocal images of cultured mouse astrocytes and neurons were performed to show the colocalization of MitoSox (MitoS) with the mitochondrial-tagged dye Cytopainter (MitoT). (Magnification: 40×.) DAPI was used to stain nuclei. (G) Mitochondrial ROS as quantified using the MitoSox assay at 30 min in intact cells (Wistar rats) by flow cytometry. (H) Quantification of MitoSox fluorescence in neurons and astrocytes in primary culture in the absence (none) or presence of complex I (rotenone, 10 µM) or complex III (antimycin, 10 µM) inhibitors, at 5-, 15-, and 30-min reveals that 15 min is sufficient to achieve maximal increase in mitochondrial ROS. Data are the mean values ± SEM from n = 3–4 independent culture preparations (Student’s t test). *P < 0.05.
Fig. S3.
Fig. S3.
Xanthine oxidase, nitric oxide synthase, or NADPH oxidases do not account for the high rate of ROS production by astrocytes. (A) Inhibition of xanthine oxidase, a well-known nonmitochondrial O2•− source, using allopurinol at a wide range of effective concentrations, did not alter the rate of H2O2 production in mouse primary astrocytes. (B) Nitric oxide synthase (NOS) inhibition with nitro-l-arginine methyl ester (NAME) did not alter H2O2 production in astrocytes. (C) mRNA relative abundances of the nonmitochondrial NADPH oxidase (NOX)-1 (NOX1) and NOX2, and mitochondrial NOX4, well-known sources of superoxide, in neurons and astrocytes. (D) Inhibition of NOXs using VAS2870 at a wide range of effective concentrations did not alter the rate of H2O2 production in astrocytes. (E) siRNA-mediated knockdown of the NOXs assembly protein, p22phox, was confirmed by RT-qPCR and Western blotting in astrocytes. The rate of H2O2 production was unaltered in p22phox-knockdown astrocytes. Data are the mean values ± SEM from n = 3–4 independent culture preparations (Student’s t test; ANOVA post hoc Bonferroni). *P < 0.05; n.s., not significant.
Fig. S4.
Fig. S4.
Astrocytes produce ROS faster than neurons in freshly acutely dissociated cells from mice. (A) MitoSox fluorescence, as assessed by flow cytometry (FC), in freshly isolated neurons and astrocytes from the adult brain mouse. Identification of astrocytes was performed by incubation with astrocyte-specific anti-integrin β5+ cells and was confirmed by GFAP immunoblotting in the cell-sorted cells. Anti-integrin β5 cells were enriched in neurons as judged by MAP2 immunoblotting in the cell-sorted cells. (B) ∆ψm was assessed using the DiIC1 (5) probe by flow cytometry (full depolarization by 10 µM CCCP) in integrin β5+ (astrocyte-enriched) and integrin β5 (neuron-enriched) cells. (C) Rates of H2O2 production, as assessed by the AmplexRed assay, in neurons and astrocytes freshly purified from C56BL/6 mouse brain using the MACS technology. Data are the mean values ± SEM from n = 3 animals (Student’s t test). *P < 0.05.
Fig. 3.
Fig. 3.
Astrocytes present a high proportion of deactive complex I, with a reduced abundance of NDUFS1 subunit. (A) Mitochondrial complex I (rotenone-sensitive NADH-ubiquinone oxidoreductase) activity, as assessed spectrophotometrically in cell homogenates, in astrocytes and neurons. (B) Deactive complex I activity, as assessed by the difference in rotenone-sensitive NADH-ubiquinone oxidoreductase activity obtained with or without N-ethylmaleimide (NEM) (10 mM) in astrocytes and neurons. (C) Complex I subunits, excised from complex I-containing bands from a blue native gels, were rated according to their signal intensities. The arrow indicates the most easily observed complex I subunit (NDUFS1) present both in free and in bound (supercomplexes) complex I fractions in neurons and astrocytes. (D) NDUFS1 protein abundance in neurons and astrocytes, as assessed by BNGE either followed by direct electroblotting [also with complex III-UQCRC2 plus complex IV–MT-CO1 (mitochondrially encoded cytochrome C oxidase I) subunits] or by second-dimension SDS/PAGE immunoblotting followed by densitometric band intensity quantification. Coomassie-stained proteins from the BNGE were used as loading control. CIII, complex III subunit UQCRC2; CIV, complex IV subunit MT-CO1. Data are the mean values ± SEM from n = 3–4 independent culture preparations (Student’s t test). *P < 0.05.
Fig. S5.
Fig. S5.
Analysis of the mitochondrial respiratory chain complexes reveals higher proportion of deactive complex I in astrocytes than in neurons. (A) Specific activities of mitochondrial complex II–III (succinate–cytochrome c oxidoreductase), complex IV (cytochrome c oxidase), and citrate synthase, as assessed spectrophotometrically in whole-cell homogenates. (B) Specific activity of mitochondrial complex II (succinate–ubiquinone oxidoreductase) in neurons and astrocytes incubated in the absence or in the presence of the complex II inhibitor 3-nitropropionic acid (3NP). Citrate synthase activity denotes no changes by 3NP treatment. (C) Mitochondrial ROS abundance, as assessed by MitoSox fluorescence by flow cytometry in neurons and astrocytes incubated in the absence or in the presence of 3NP. The aim of this experiment was to analyze the contribution of reverse electron transfer (RET) to mitochondrial ROS production in both cell types. Because MitoSox fluorescence was not altered by 3NP treatment in astrocytes, we conclude that the contribution of RET to ROS production in astrocytes is negligible. MitoSox fluorescence was, however, increased in neurons, which is likely is due to 3NP excitotoxicity, as previously described (52), and not to RET-mediated ROS production. (D) Complex I activity, as assessed by the rotenone-sensitive NADH-ubiquinone oxidoreductase activity obtained with or without N-ethylmaleimide (NEM) (10 mM) in astrocytes and neurons to determine the proportion of deactive complex I. Data are the mean values ± SEM from n = 3–4 independent culture preparations (Student’s t test). *P < 0.05. Ast, astrocytes; Neu, neurons.
Fig. 4.
Fig. 4.
NDUFS1 knockdown in neurons disassembles complex I from supercomplexes increasing ROS and impairing mitochondrial respiration. (A) Neurons were transfected with a siRNA against NDUFS1 (or a control siRNA), and 3 d after, NDUFS1 protein abundance was analyzed by Western blotting in the whole-cell extracts, followed by densitometric band quantification. β-Actin was used as loading control. (B) Digitonin-solubilized isolated mitochondria from NDUFS1–knocked-down neurons were subjected to BNGE followed by in-gel complex I activity assay, and direct electroblotting against complex I subunit NDUFS1, and complex III (UQCRC2) plus complex IV (MT-CO1). Bands corresponding to supercomplexes (SC) and free complex I (CI) were excised from the blue native gels, and subjected to second-dimension SDS/PAGE immunoblotting against NDUFS1 and NADH:ubiquinone oxidoreductase core subunit V1 (NDUFV1) NADH:ubiquinone oxidoreductase core subunit V1 (NDUFV1). NDUFV1 abundance was assessed to distinguish between expression or stability of complex I. Coomassie-stained proteins from the BNGE were used as loading control. (C) Densitometric quantification analyses of the NDUFS1 and NDUFV1 band intensities shown in B. (D) In-gel H2O2 production in the excised SC and CI bands from the BNGE of digitonin-solubilized isolated mitochondria from control and NDUFS1–knocked-down neurons. H2O2 production values were normalized by the NADH dehydrogenase-activity band intensity obtained in the BNGE. (E) Mitochondrial ROS assessed using the MitoSox assay in intact cells by flow cytometry. (F) Rate of pyruvate/malate (5 mM each; 1 mM ADP)-driven mitochondrial oxygen consumption in isolated mitochondria from neurons. CIII, complex III subunit UQCRC2; CIV, complex IV subunit MT-CO1. Data are the mean values ± SEM from n = 3–4 independent culture preparations (Student’s t test). *P < 0.05.
Fig. 5.
Fig. 5.
Overexpression of NDUFS1 in astrocytes assembles complex I in supercomplexes and decreases ROS production. (A) Astrocytes were transfected with the full-length NDUFS1 cDNA (or control plasmid), and 1 d after, NDUFS1 protein abundance was analyzed by Western blotting in the whole-cell extracts, followed by densitometric band quantification. β-Actin was used as loading control. (B) Digitonin-solubilized isolated mitochondria from NDUFS1-overexpressing astrocytes were subjected to BNGE followed by in-gel complex I activity assay, and direct electroblotting against complex I subunit NDUFS1, and complex III (UQCRC2) plus complex IV (MT-CO1). Bands corresponding to supercomplexes (SC) and free complex I (CI) were excised from the blue native gel, and subjected to second-dimension SDS/PAGE immunoblotting against NDUFS1 and NDUFV1. Coomassie-stained proteins from the BNGE were used as loading control. (C) Densitometric quantification analyses of the NDUFS1 and NDUFV1 band intensities shown in B. (D) In-gel H2O2 production in the excised SC and CI bands from the BNGE of digitonin-solubilized isolated mitochondria from control and NDUFS1-overexpressing astrocytes. H2O2 production values were normalized by the NADH dehydrogenase-activity band intensity obtained in the BNGE. (E) Mitochondrial ROS as assessed using the MitoSox assay in intact cells by flow cytometry. (F) Rate of pyruvate/malate (5 mM each; 1 mM ADP)-driven mitochondrial oxygen consumption in isolated mitochondria from astrocytes. CIII, complex III subunit UQCRC2; CIV, complex IV subunit MT-CO1. Data are the mean values ± SEM from n = 3–4 independent culture preparations (Student’s t test). *P < 0.05.

References

    1. Magistretti PJ. Neuron-glia metabolic coupling and plasticity. J Exp Biol. 2006;209(Pt 12):2304–2311. - PubMed
    1. Allen NJ, Barres BA. Neuroscience: Glia—more than just brain glue. Nature. 2009;457(7230):675–677. - PubMed
    1. Kimelberg HK, Nedergaard M. Functions of astrocytes and their potential as therapeutic targets. Neurotherapeutics. 2010;7(4):338–353. - PMC - PubMed
    1. Perea G, Sur M, Araque A. Neuron-glia networks: Integral gear of brain function. Front Cell Neurosci. 2014;8:378. - PMC - PubMed
    1. Parpura V, et al. Glutamate-mediated astrocyte-neuron signalling. Nature. 1994;369(6483):744–747. - PubMed

Publication types

Substances