. 2016 Nov 15;113(46):E7231-E7239.
doi: 10.1073/pnas.1603738113. Epub 2016 Oct 31.

PTPN22 contributes to exhaustion of T lymphocytes during chronic viral infection

Affiliations

PTPN22 contributes to exhaustion of T lymphocytes during chronic viral infection

Christian J Maine et al. Proc Natl Acad Sci U S A. .

Abstract

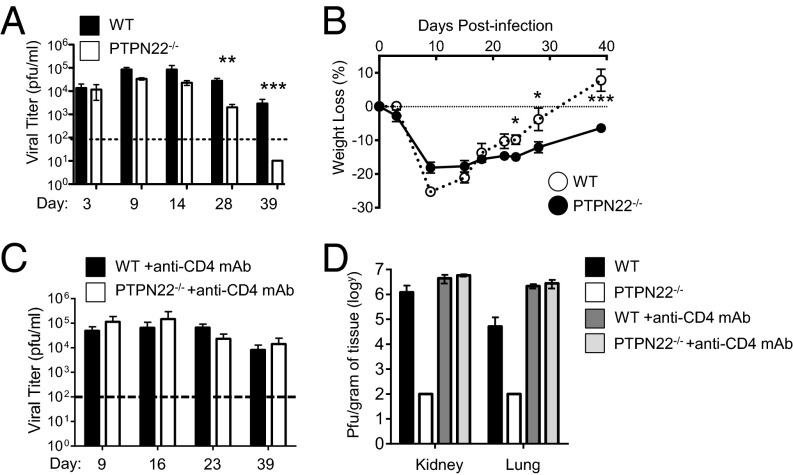
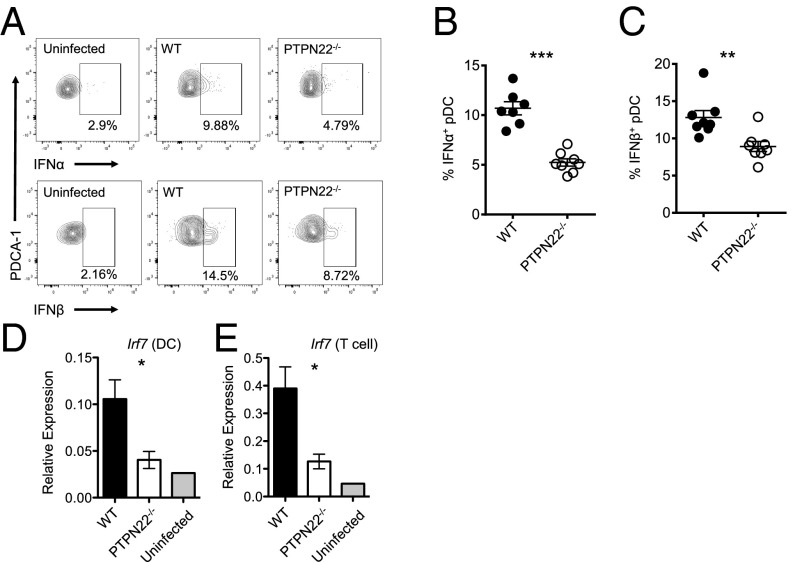
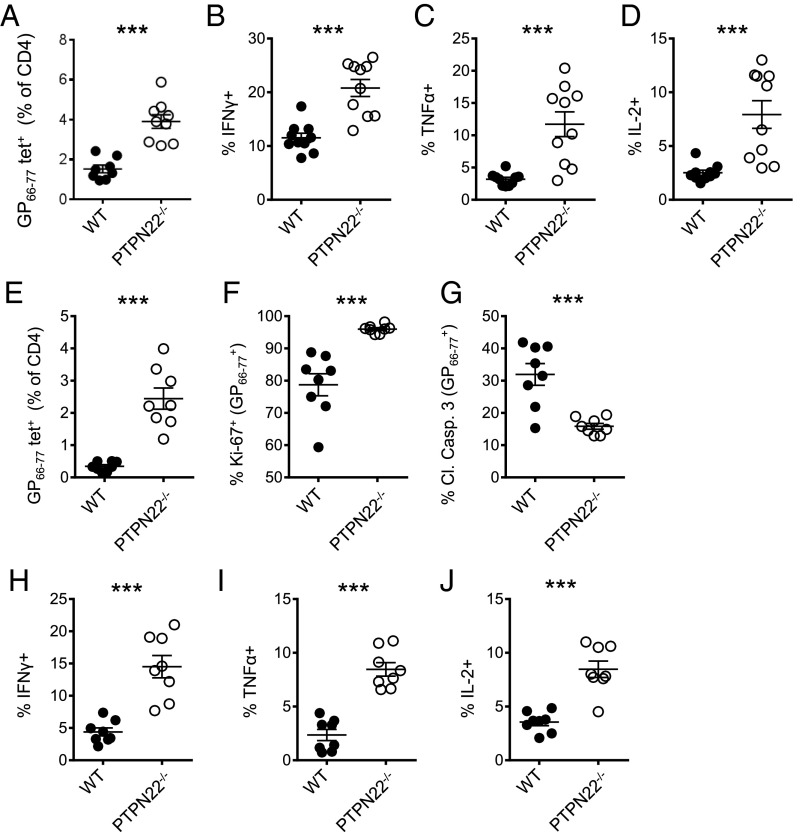
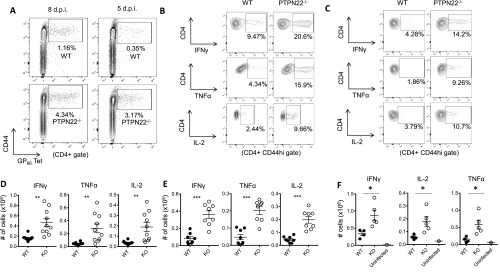
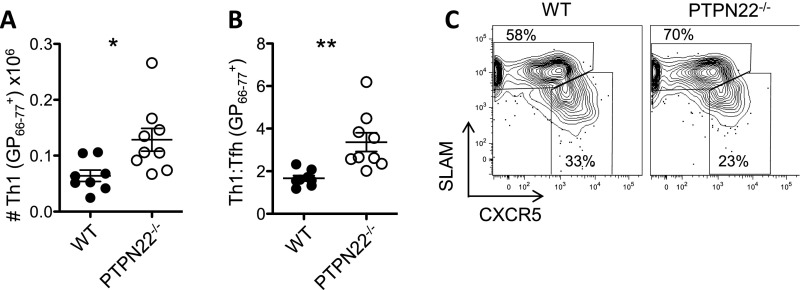
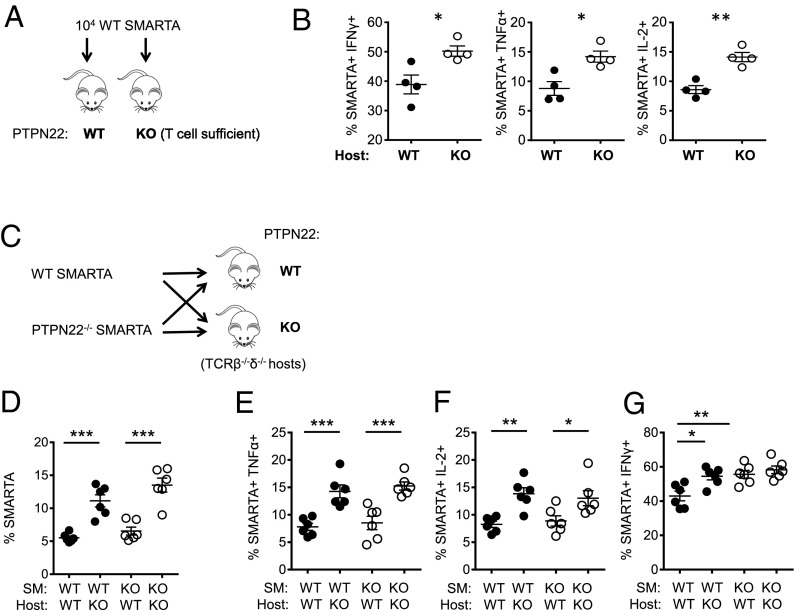
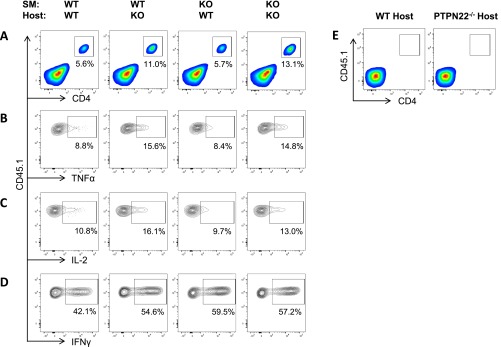
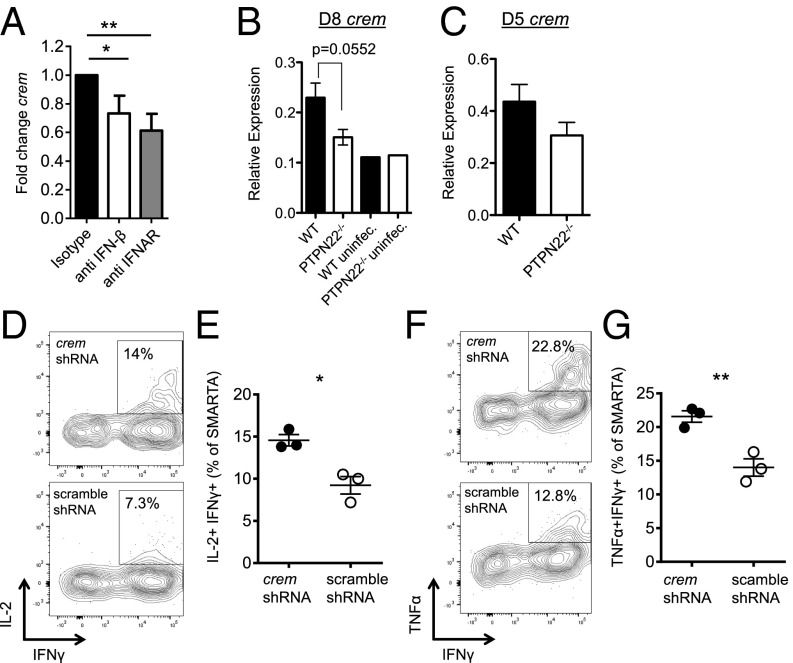
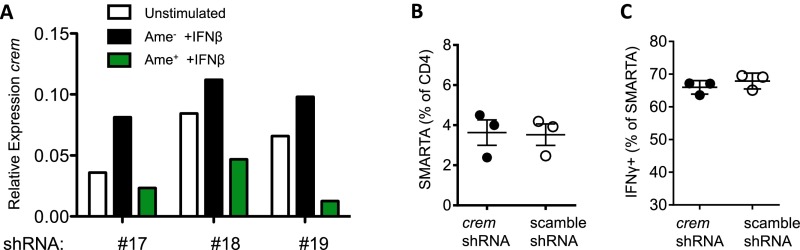
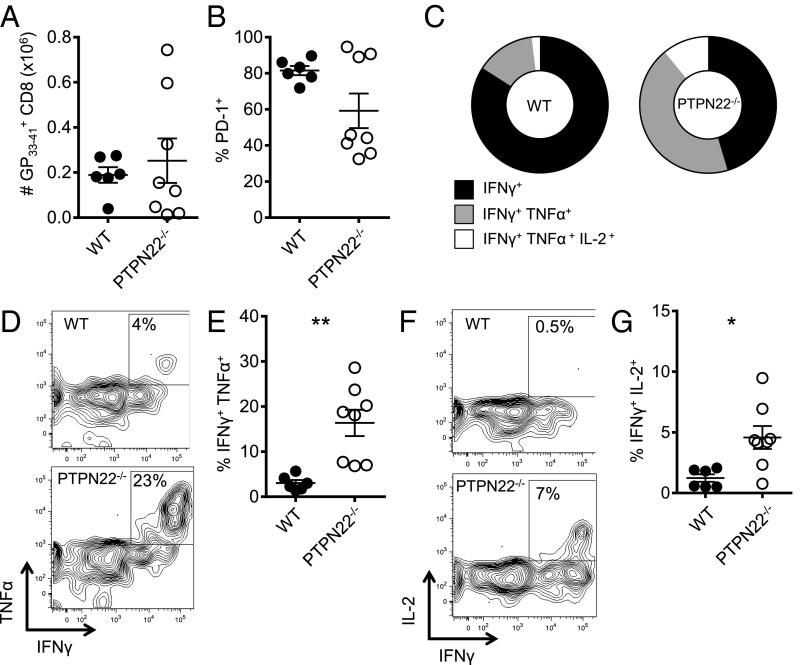
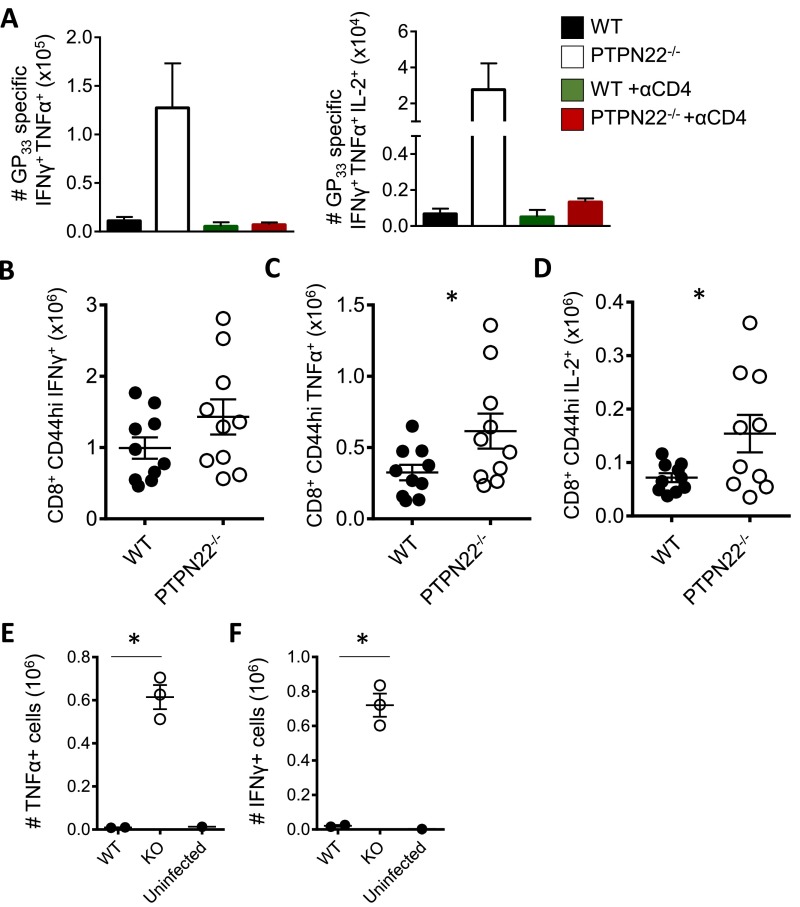
The protein encoded by the autoimmune-associated protein tyrosine phosphatase nonreceptor type 22 gene, PTPN22, has wide-ranging effects in immune cells including suppression of T-cell receptor signaling and promoting efficient production of type I interferons (IFN-I) by myeloid cells. Here we show that mice deficient in PTPN22 resist chronic viral infection with lymphocytic choriomeningitis virus clone 13 (LCMV cl13). The numbers and function of viral-specific CD4 T lymphocytes is greatly enhanced, whereas expression of the IFNβ-induced IL-2 repressor, cAMP-responsive element modulator (CREM) is reduced. Reduction of CREM expression in wild-type CD4 T lymphocytes prevents the loss of IL-2 production by CD4 T lymphocytes during infection with LCMV cl13. These findings implicate the IFNβ/CREM/IL-2 axis in regulating T-lymphocyte function during chronic viral infection.

Keywords: CREM; LCMV; PTPN22; T-cell exhaustion; chronic infection.


Conflict of interest statement

The authors declare no conflict of interest.

Figures

Fig. 1.
Fig. 1.
PTPN22 deficiency leads to improved clearance of LCMV cl13. PTPN22−/− (n = 10) and WT (n = 10) mice were infected i.v. with 106 pfu of LCMV cl13, and serum was collected at the specified time points. (A) Plaque assays were carried out to determine viral titer in the serum. (B) Weight loss over time postinfection. Each experiment was done at least twice, and data were combined. (C and D) PTPN22−/− and WT mice were injected with CD4-depleting antibody before infection with LCMV cl13, and viral titer was measured in the serum (C) and in kidney and lung (D) on day 40. The data in the graphs are shown as the mean ± SEM; *P < 0.05; **P < 0.01; ***P < 0.001.
Fig. S1.
Fig. S1.
PTPN22−/− mice clear LCMV cl13 infection (related to Fig. 1). (A and B) PTPN22−/− and WT mice were infected with 106 pfu of LCMV cl13, and organ viral load was measured at day 8 (A) and day 14 (B). (C) PTPN22−/− and WT mice were infected i.v. with 105 pfu of LCMV cl13, and serum was collected at the specified time points. Plaque assays were carried out to determine the viral titer in the serum. ND, not detected. The data in graphs are shown as the mean ± SEM.
Fig. 2.
Fig. 2.
PTPN22 deficiency results in reduced IFN-I. PTPN22−/− and WT mice were infected with LCMV cl13 (106 pfu i.v.). Twenty-four hours later spleens were removed, cultured in vitro with Brefeldin A for 3 h, and stained for IFNα and IFNβ. (A) Representative flow cytometric plots of pDC (CD19 CD11clo PDCA-1+) expression of IFNα and IFNβ. (B) Combined data showing pDC expression of IFNα. (C) Combined data showing pDC expression of IFNβ. B and C show combined data from two independent experiments combined, each symbol represents one mouse. (D and E) Eight days postinfection spleens were removed from WT and PTPN22-KO mice, and DCs (D) and T cells (E) were isolated by MACS. mRNA was purified, and quantitative RT-PCR was performed for irf7. D and E are two independent experiments. Each bar has four data points; each point is representative of two pooled mouse spleens. The data in graphs are shown as the mean ± SEM; *P < 0.05; **P < 0.01; ***P < 0.001.
Fig. S2.
Fig. S2.
The effect of PTPN22 on DC numbers and costimulatory phenotype (related to Fig. 2). PTPN22−/− and WT mice were infected with 106 pfu of LCMV cl13. Twenty-four hours later spleens were removed and stained for DC markers. (A) The number of cDCs (CD19/PDCA-1/CD11c+/MHC class II+) in the spleen. (B) The number of pDCs (CD19/PDCA-1+/CD11clo) in the spleen. (C) Representative histograms of PD-L1 expression on cDCs and pDCs. (D) Representative histograms of CD86 expression on cDCs and pDCs. Data in A and B are pooled from at least two independent experiments. Each symbol represents one mouse. The data in graphs are shown as the mean ± SEM.
Fig. 3.
Fig. 3.
PTPN22 deficiency results in increased IL-10 production. (A and B) PTPN22−/− and WT mice were infected i.v. with LCMV cl13 (106 pfu), and serum levels of IL-10 were measured by ELISA at 24 h (A) and 96 h (B) postinfection. (C) At day 8 postinfection splenocytes were cultured with GP66 peptide in vitro for 48 h, and the IL-10 concentration in the culture supernatant was measured by ELISA. Experiments were performed twice, and data were pooled. Each symbol represents one mouse. The data in graphs are shown as the mean ± SEM; **P < 0.01; ***P < 0.001.
Fig. 4.
Fig. 4.
PTPN22−/− enhances numbers and function of viral-specific CD4 T cells. PTPN22−/− and WT mice were infected i.v. with LCMV cl13 (106 pfu), and spleens were collected and restimulated with GP61–80 peptide. (A) The number of GP66–77 tetramer-positive CD4 T cells in the spleen on day 8. (BD) Intracellular staining for IFNγ (B), TNFα (C), and IL-2 (D) was performed and is shown for CD4/CD44hi T cells on day 8. (E) Viral-specific CD4 T cells were stained with the GP66–77 tetramer and counted by flow cytometry on day 5. (F and G) Tetramer-positive CD4 T cells were stained with Ki-67 (F) and cleaved caspase 3 (G) for flow cytometry analysis on day 5. (HJ) Spleens were restimulated with GP61–80 peptide on day 5 postinfection, and intracellular staining of CD4/CD44hi cells for IFNγ (H), TNFα (I), and IL-2 (J) was performed. Data in AD are combined from three independent experiments; data in EJ are combined from two independent experiments. Each symbol represents one mouse. The data in graphs are shown as the mean ± SEM; ***P < 0.001.
Fig. S3.
Fig. S3.
Representative FACS plots of CD4 tetramer-positive cells and cytokine production (related to Fig. 4). PTPN22−/− and WT mice were infected with 106 pfu of LCMV cl13 8. (A) Five days later spleens were removed, and GP66–77 tetramer-positive CD4 T cells were stained. (B and C) Spleens were collected and on day 8 (B) and on day 5 (C) and were restimulated with GP66–80 peptide. Representative FACS plots (gated on CD4/CD44hi cells) of intracellular cytokine staining for IFNγ, IL-2, and TNFα are shown. (D) The absolute number of CD4/CD44hi cytokine-positive cells following peptide stimulation on day 8. (E) The absolute number of CD4/CD44hi cytokine-positive cells following peptide stimulation on day 5. (F) Intracellular cytokine staining following GP66–80 peptide stimulation on day 8 postinfection with low-dose LCMV cl13. Gated on CD4/CD44hi cells. Each symbol represents one mouse. The data in graphs are shown as the mean ± SEM; *P < 0.05; **P < 0.01; ***P < 0.001.
Fig. S4.
Fig. S4.
PTPN22-deficient CD4 T cells are biased toward a Th1 phenotype (related to Fig. 4). PTPN22−/− and WT mice were infected with 106 pfu of LCMV cl13. Eight days later spleens were removed, and GP66–77 tetramer-positive CD4 T cells were stained for Th1 (SLAMhi CXCR5) and Tfh (SLAMlo CXCR5+) markers. (A) The number of Th1 phenotype cells in WT and PTPN22−/− mice. (B) The ratio of Th1:Tfh phenotype GP66–77 tetramer-positive CD4 T cells. Each symbol in A and B represents one mouse. (C) Representative dot plot staining to define the Th1 and Tfh populations. Data were pooled from two independent experiments. The data in graphs are shown as the mean ± SEM. *P < 0.05; **P < 0.01.
Fig. 5.
Fig. 5.
PTPN22 deficiency controls CD4 T-cell number and function in a T-cell–extrinsic manner. (A) CD45.1+ SMARTA cells (104) were purified by MACS and transferred into CD45.2+ WT or PTPN22−/− T-cell–sufficient hosts. The following day these mice were infected with 106 pfu LCMV cl13. (B) Spleens were restimulated with GP61–80 peptide on day 8 postinfection, and intracellular staining for IFNγ, TNFα, and IL-2 was performed. (C) CD45.1+ PTPN22−/− SMARTA and WT SMARTA cells (104) were purified by MACS and transferred into CD45.2+ WT or PTPN22−/− (TCRβ−/−δ−/−) hosts. The following day the four groups of mice were infected with 106 pfu LCMV cl13. (D) The percentage of SMARTA cells in the lymphocyte gate on day 8 postinfection in the spleen. (EG) Spleens were restimulated with GP61–80 peptide on day 8 postinfection, and intracellular staining for TNFα (E), IL-2 (F), and IFNγ (G) was performed. Experiments were performed twice and pooled. Each symbol represents one mouse. The data in the graphs are shown as the mean ± SEM; *P < 0.05; **P < 0.01; ***P < 0.001.
Fig. S5.
Fig. S5.
PTPN22 deficiency controls CD4 T-cell number and function in a T-cell–extrinsic manner (related to Fig. 5). CD45.1+ PTPN22−/− SMARTA and WT SMARTA cells (104) were purified by MACS and transferred into CD45.2+ WT or PTPN22−/− (TCRβ−/−δ−/−) hosts. The following day the four groups of mice were infected with 106 pfu LCMV cl13. (A) Representative flow cytometry plots showing the percentage of SMARTA cells in the lymphocyte gate on day 8 postinfection in the spleen. (BD) Spleens were restimulated with GP61–80 peptide on day 8 postinfection, and intracellular staining for TNFα (B), IL-2 (C), and IFNγ (D) was performed. Each graph is a representative flow cytometry plot gated on SMARTA cells. (E) CD45.1+ WT SMARTA cells (104) were purified by MACS and transferred into CD45.2+ WT or PTPN22−/− (TCRβ−/−δ−/−) uninfected hosts. The spleens were analyzed at day 8 posttransfer for SMARTA cells. The data in graphs are shown as the mean ± SEM.
Fig. 6.
Fig. 6.
PTPN22−/− CD4 T cells do not up-regulate CREM, which can lead to enhanced antibody production. (A) CD45.1+ SMARTA cells (103) were adoptively transferred into WT B6 mice along with blocking antibodies against IFNβ, IFNAR, or isotype control. Twenty-four hours later, the mice were infected i.v. with LCMV cl13 (106 pfu). SMARTA cells were sorted from spleens 7 d postinfection, and the crem transcript was measured by quantitative RT-PCR. (B) PTPN22−/− and WT mice were infected i.v. with LCMV cl13 (106 pfu), and CD4/CD44hi cells were sorted by FACS on day 8. Quantitative RT-PCR was performed to measure crem transcript levels. (C) SMARTA cells or PTPN22−/− SMARTA cells were adoptively transferred into WT or PTPN22−/− mice, respectively, and mice were infected with LCMV cl13. Transferred cells were sorted on day 5, and mRNA was isolated. Quantitative RT-PCR was used to measure crem transcript. AC show data points; each point was pooled from two mouse spleens from two independent experiments. (DG) SMARTA cells were transduced with a retrovirus expressing shRNA targeting CREM or control (scramble) and were reinjected into WT mice. After at least 5 d of rest, mice were infected with LCMV cl13 (106 pfu i.v.), and spleens were collected on day 8. SMARTA T cells were restimulated with GP61–80 peptide, and TNFα+ IFNγ+ (D and E) and IL-2+ IFNγ+ (F and G) cells were counted by flow cytometry. D and F are representative flow cytometric plots gated on SMARTA cells. E and G are representative of two independent experiments; each symbol represents one mouse. The data in graphs are shown as the mean ± SEM; *P < 0.05; **P < 0.01.
Fig. S6.
Fig. S6.
CREM knockdown by shRNA (related to Fig. 6). (A) SMARTA cells were transduced with retroviral vectors expressing three different shRNA sequences (nos. 17, 18, and 19). Transduced cells were sorted by FACS using the fluorescent reporter protein Ametrine (Ame). Transduced (Ame+) and untransduced (Ame) cells were stimulated overnight with IFNβ, and mRNA was isolated. CREM transcript levels were measured by quantitative RT-PCR. shRNA no.17 was chosen for all subsequent experiments. (B and C) SMARTA CD4 T cells were transduced with a retrovirus expressing shRNA targeting CREM or control and were reinjected into WT B6 mice. After at least 5 d rest, mice were infected i.v. with LCMV cl13 (106 pfu), and spleens were collected on day 8. (B) The percentage of SMARTA cells in the CD4 gate. (C) SMARTA T cells were restimulated with GP61–80 peptide, and IFNγ+ cells were counted by flow cytometry.
Fig. 7.
Fig. 7.
Virus-specific CD8 T cells are not exhausted in PTPN22−/− mice. PTPN22−/− and WT mice were infected i.v. with LCMV cl13 (106 pfu). (A) GP33–41 tetramer-positive CD8 T-cell numbers in the spleen at day 14. (B) PD-1 expression on GP33–41 tetramer-positive CD8 T cells. Spleens were collected on day 14 and restimulated with GP33–41 peptide. TNFα, IFNγ, and IL-2 were measured by intracellular FACS. (C) Piecharts showing polyfunctionality of GP33–41 tetramer-positive cells with respect to cytokine production. (D) Representative FACS plots of TNFα and IFNγ staining on GP33–41 tetramer-positive cells. (E) Combined intracellular cytokine staining data from two independent experiments. (F) Representative FACS plots of IL-2 and IFNγ staining on GP33–41 tetramer-positive cells. (G) Combined intracellular cytokine staining data from two independent experiments. Experiments were performed twice and pooled. Each symbol represents one mouse. In A, B, E, and G data are shown as the mean ± SEM. In C data represents the mean (WT n = 6, KO n = 8). *P < 0.05; **P < 0.01.
Fig. S7.
Fig. S7.
PTPN22−/− mice have increased CD8 T-cell function (related to Fig. 7). (A) PTPN22−/− and WT mice were injected with CD4-depleting antibody or isotype control and then were infected with 106 pfu of LCMV cl13. At 40 d postinfection spleens were harvested and restimulated with GP33–41 peptide. Intracellular cytokine staining was performed to measure IFNγ, TNFα, and IL-2. (BD) PTPN22−/− and WT mice were infected with 106 pfu of LCMV cl13. Eight days later spleens were removed and restimulated with GP33–41 peptide. Intracellular cytokine staining for IFNγ (B), TNFα (C), and IL-2 (D) was performed. (E and F) Intracellular cytokine staining following GP33–41 peptide stimulation on day 25 postinfection with low-dose LCMV cl13 (gated on CD8/CD44hi cells). The data in graphs are shown as the mean ± SEM; *P < 0.05.

References

    1. Wherry EJ. T cell exhaustion. Nat Immunol. 2011;12(6):492–499. - PubMed
    1. Wherry EJ, Kurachi M. Molecular and cellular insights into T cell exhaustion. Nat Rev Immunol. 2015;15(8):486–499. - PMC - PubMed
    1. Chandele A, Mukerjee P, Das G, Ahmed R, Chauhan VS. Phenotypic and functional profiling of malaria-induced CD8 and CD4 T cells during blood-stage infection with Plasmodium yoelii. Immunology. 2011;132(2):273–286. - PMC - PubMed
    1. Esch KJ, Juelsgaard R, Martinez PA, Jones DE, Petersen CA. Programmed death 1-mediated T cell exhaustion during visceral leishmaniasis impairs phagocyte function. J Immunol. 2013;191(11):5542–5550. - PMC - PubMed
    1. Gautam S, et al. CD8 T cell exhaustion in human visceral leishmaniasis. J Infect Dis. 2014;209(2):290–299. - PMC - PubMed

Publication types

MeSH terms

Substances

LinkOut - more resources