. 2016 Nov 15;113(46):E7250-E7259.
doi: 10.1073/pnas.1603754113. Epub 2016 Oct 31.

Cardiac electrical defects in progeroid mice and Hutchinson-Gilford progeria syndrome patients with nuclear lamina alterations

Affiliations

Cardiac electrical defects in progeroid mice and Hutchinson-Gilford progeria syndrome patients with nuclear lamina alterations

José Rivera-Torres et al. Proc Natl Acad Sci U S A. .

Abstract

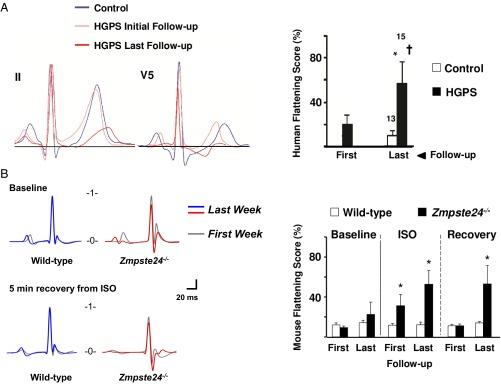
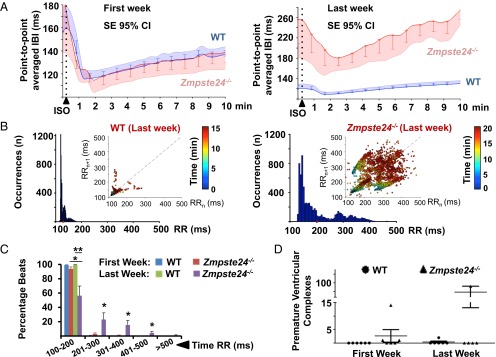
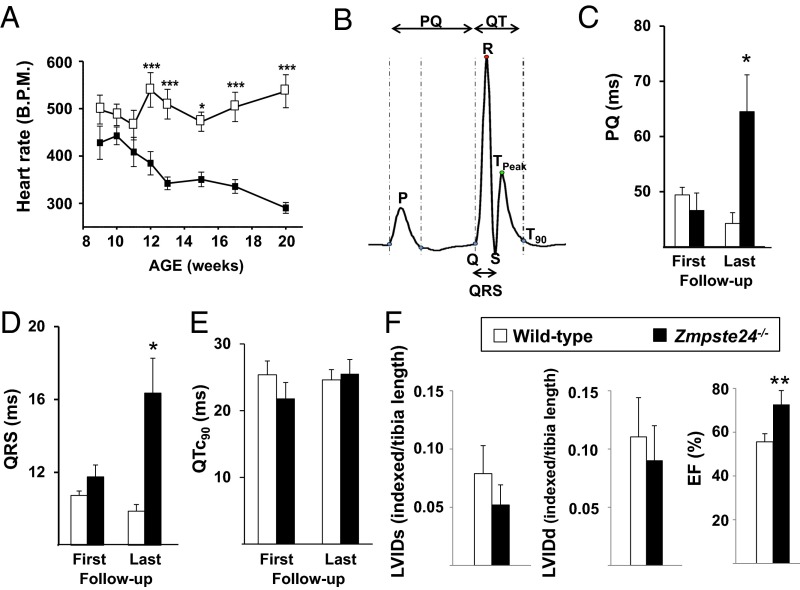
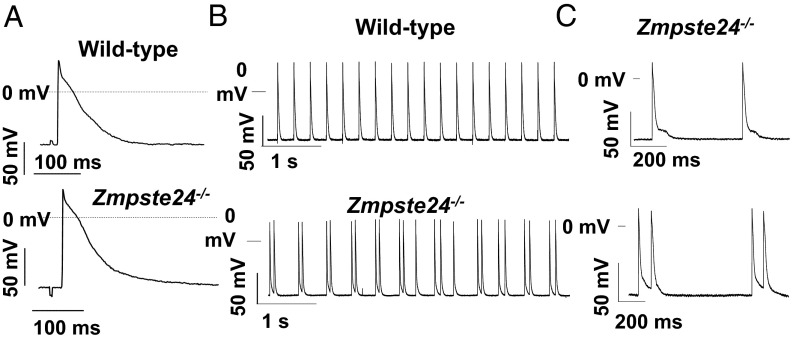
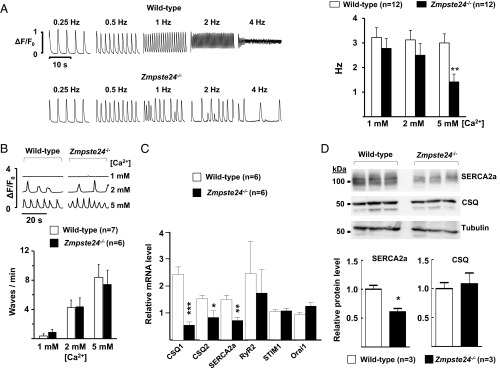
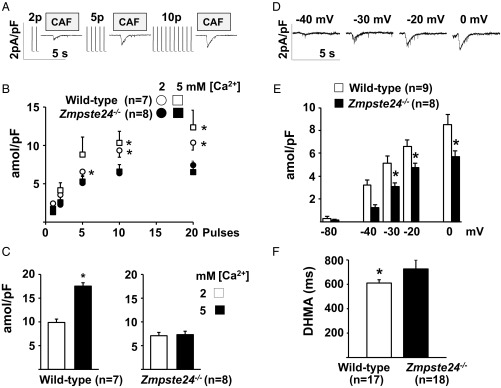
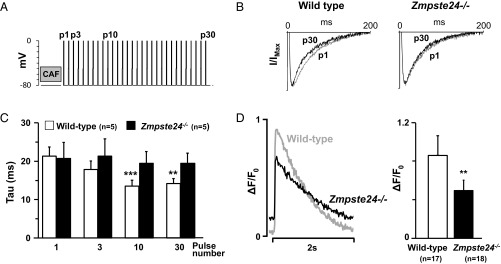
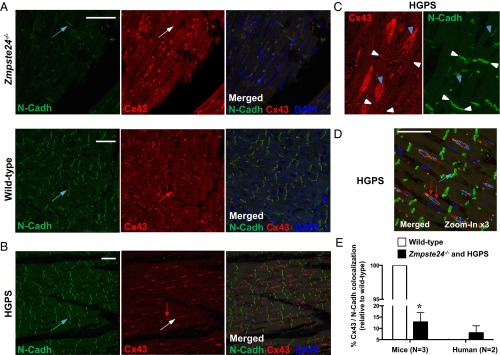
Hutchinson-Gilford progeria syndrome (HGPS) is a rare genetic disease caused by defective prelamin A processing, leading to nuclear lamina alterations, severe cardiovascular pathology, and premature death. Prelamin A alterations also occur in physiological aging. It remains unknown how defective prelamin A processing affects the cardiac rhythm. We show age-dependent cardiac repolarization abnormalities in HGPS patients that are also present in the Zmpste24-/- mouse model of HGPS. Challenge of Zmpste24-/- mice with the β-adrenergic agonist isoproterenol did not trigger ventricular arrhythmia but caused bradycardia-related premature ventricular complexes and slow-rate polymorphic ventricular rhythms during recovery. Patch-clamping in Zmpste24-/- cardiomyocytes revealed prolonged calcium-transient duration and reduced sarcoplasmic reticulum calcium loading and release, consistent with the absence of isoproterenol-induced ventricular arrhythmia. Zmpste24-/- progeroid mice also developed severe fibrosis-unrelated bradycardia and PQ interval and QRS complex prolongation. These conduction defects were accompanied by overt mislocalization of the gap junction protein connexin43 (Cx43). Remarkably, Cx43 mislocalization was also evident in autopsied left ventricle tissue from HGPS patients, suggesting intercellular connectivity alterations at late stages of the disease. The similarities between HGPS patients and progeroid mice reported here strongly suggest that defective cardiac repolarization and cardiomyocyte connectivity are important abnormalities in the HGPS pathogenesis that increase the risk of arrhythmia and premature death.

Keywords: Hutchinson–Gilford progeria syndrome; calcium handling; connexin43; prelamin A; progerin.


Conflict of interest statement

The authors declare no conflict of interest.

Figures

Fig. 1.
Fig. 1.
Age-related exacerbation of repolarization abnormalities in HGPS patients and Zmpste24−/− mice. (A, Left) Extracted averaged ECG leads II and V5 from human control participants (blue traces) and HGPS patients at initial stage (Initial; light red trace) and advanced stages (Last; dark red trace). (A, Right) Quantification of mean flattening scores. (B, Left) Representative T-wave abnormalities in Zmpste24−/− mice comparing the first and the last isoproterenol (ISO) challenge (SI Appendix, SI Materials and Methods). (B, Right) Mean effective flattening scores at baseline, after ISO exposure and during 5-min recovery. *P < 0.05 vs. control; P < 0.05 vs. first follow-up. First: 11-wk-old mice; Last: 19-wk-old mice or last week before death.
Fig. 2.
Fig. 2.
Severe bradycardia in postisoproterenol (post-ISO) administration recovery is associated with an increase in premature ventricular complexes in Zmpste24−/− mice. First: 11-wk-old mice; Last: 19-wk-old mice or last week before death. (A) β-Adrenergic response [interbeat interval (IBI)] in WT and Zmpste24−/− mice from the first to the last ISO challenge. 95% CI, 95% confidence interval. (B) RR histograms in WT and Zmpste24−/− mice during ISO time course challenge. The Insets show correlation plots between consecutive cardiac beats (RRn vs. RRn + 1; n = cardiac beat number within the entire registration period; color-coded timescale). A significant increase in the percentage of long RR intervals during the last week of follow-up (C) was also associated with a significant increase in bradycardia-related premature ventricular complexes (D). *P < 0.05; **P < 0.01 (SI Appendix, SI Materials and Methods).
Fig. 3.
Fig. 3.
Zmpste24−/− mice show preserved cardiac function but develop severe bradycardia and cardiac conduction abnormalities. (A) Heart rate (bpm) in conscious mice. (B) Template ECG showing the intervals used to quantify (C) PQ, (D) QRS, and (E) heart rate-corrected QT at 90% of repolarization from Tpeak (QTc90) duration measured on the baseline ECG at the first follow-up (week 11; First) and the last follow-up (Last) (SI Appendix, SI Materials and Methods). (F) LVIDs, LVIDd, and EF determined by transthoracic echocardiography in 18- to 20-wk-old mice. *P < 0.05; **P < 0.01; ***P < 0.001.
Fig. 4.
Fig. 4.
Transmembrane APs recorded in multicellular left ventricular preparations. (A) Representative APs (3 Hz) from WT and Zmpste24−/− mice. (B) Left ventricular preparations from Zmpste24−/− mice displayed afterdepolarizations that occasionally yielded triggered APs (C, Lower).
Fig. 5.
Fig. 5.
Defective Ca2+ transients in Zmpste24−/− cardiomyocytes. (A, Left) Analysis of beat to beat response stability in isolated mouse ventricular myocytes subjected to increasing stimulation frequencies. Representative examples of calcium transients recorded in the presence of 5 mM extracellular Ca2+are shown. Irregular beat to beat responses start at lower frequencies in Zmpste24−/− cardiomyocytes. (A, Right) The graph shows threshold frequencies (in hertz) for the induction of nonuniform beat to beat responses at the indicated Ca2+ concentrations. Responses were recorded in myocytes isolated from WT and Zmpste24−/− mice (12 cells from six mice of each genotype). (B, Upper) Typical recordings of spontaneous calcium waves at the indicated Ca2+ concentrations. (B, Lower) Calcium dependency of the calcium wave frequency. Values are from seven WT mice (n = 15 cells) and six Zmpste24−/− mice (n = 14 cells). (C) qPCR of heart tissue. (D) Western blot analysis of heart tissue. Representative blots are shown, and relative band intensity was quantified as described in SI Appendix, SI Materials and Methods. *P < 0.05; **P < 0.01; ***P < 0.001.
Fig. 6.
Fig. 6.
Reduced maximal SR Ca2+ uptake in Zmpste24−/− cardiomyocytes. SR calcium loading capacity in isolated ventricular myocytes. (A–C) Calcium loading measured as a function of the number of stimulation pulses used for SR loading. (A) Representative caffeine (CAF)-induced currents recorded after SR reloading with the indicated number of stimulation pulses. Transient exposure to CAF was used to release SR calcium content before reloading and measure loading after the train of stimulation pulses. (B) Time integral of CAF-induced currents recorded after SR reloading with the indicated stimulation pulses. Data were obtained from seven Zmpste24−/− and eight WT myocytes (from n = 5 mice) exposed consecutively to 2 and 5 mM extracellular Ca2+. Time integrals were converted to amoles and normalized to cellular capacitance (in picofarads). (C) Effect of extracellular calcium concentration on the time integral of CAF-induced current at steady state (after ≥30 stimulation pulses). (DF) Calcium loading measured as a function of membrane potential. (D) Representative CAF-induced currents recorded after SR loading with a 5-s depolarization to the indicated membrane potentials. (E) Time integral of CAF-induced current recorded in the presence of 2 mM extracellular Ca2+ after SR reloading at rest (−80 mV) and after depolarizing to the indicated voltage. Data were obtained from eight Zmpste24−/− myocytes (n = 5 mice) and nine WT myocytes (n = 6 mice). (F) Mean calcium transient duration at half-maximal amplitude (DHMA) recorded in myocytes paced at 0.5 Hz (17 WT and 18 Zmpste24−/− myocytes from n = 6 mice per group). *P < 0.05.
Fig. 7.
Fig. 7.
Impaired SR calcium release-dependent inactivation of ICa in isolated Zmpste24−/− myocytes. (A) Protocol to measure the effect of SR calcium loading on ICa inactivation. SR calcium content was released with caffeine (CAF) and reloaded with a train of stimulation pulses. (B) Representative superimposed ICa recordings on p1 and p30. Currents were normalized to their peak values and fitted to a double-exponential equation. (C) Dependency of time constant (tau) for fast ICa inactivation on indicated pulses. (D) Representative calcium transient (ΔF/F0) recordings from myocytes paced at 0.5 Hz (Left) and calcium transient amplitude quantification (Right). Indicated cardiomyocytes are from n = 6 mice per genotype. **P < 0.01; ***P < 0.001.
Fig. 8.
Fig. 8.
Abnormal localization of Cx43 in hearts of progeroid Zmpste24−/− mice and HGPS patients. (A and B) Double immunofluorescence of left ventricle sections from mice of the indicated genotype and HGPS patients to detect N-Cadherin (N-Cadh; green in Left) and Cx43 (red in Center). Right shows merged images, with DAPI staining of nuclei (blue). (A) Cx43 lateralization was evident in Zmpste24−/− mice. Blue arrows mark examples of intercalated disk areas (N-Cadh positive). The white arrow in the Zmpste24−/− image marks an intercalated disk without Cx43 expression, and the red arrow in the WT image marks an intercalated disk with abundant Cx43 expression. (B) Representative images illustrating loss of Cx43/N-Cadh colocalization in HGPS heart. Blue arrow and white arrow are as in A. The red arrow marks a Cx43-positive area, which does not colocalize with N-Cadh. (C) Magnified view of an HGPS heart section. Blue arrowheads mark examples of predominant Cx43 expression near nuclei. White arrowheads mark examples of scant Cx43/N-Cadh colocalization at intercalated disks. (D) Automatic image segmentation of an HGPS heart section used for quantification of Cx43/N-Cadh colocalization. Green, red, and dark blue blob boundaries correspond to positive staining for N-Cadh, Cx43, and nuclei, respectively. Cyan blob boundaries represent areas showing Cx43/nuclei colocalization. (Scale bars: 50 µm.) (E) Percentage of Cx43/N-Cadh colocalization at the intercalated disks estimated by quantifying automatically segmented images. Results are represented relative to WT (=100); n = 3 WT and Zmpste24−/− mice and n = 2 HGPS patients were analyzed (n = 5 sections per individual). *P < 0.001.

References

    1. Andrés V, González JM. Role of A-type lamins in signaling, transcription, and chromatin organization. J Cell Biol. 2009;187(7):945–957. - PMC - PubMed
    1. Trigueros-Motos L, González JM, Rivera J, Andrés V. Hutchinson-Gilford progeria syndrome, cardiovascular disease and oxidative stress. Front Biosci (Schol Ed) 2011;3:1285–1297. - PubMed
    1. Merideth MA, et al. Phenotype and course of Hutchinson-Gilford progeria syndrome. N Engl J Med. 2008;358(6):592–604. - PMC - PubMed
    1. Gordon LB, et al. Progeria Clinical Trials Collaborative Impact of farnesylation inhibitors on survival in Hutchinson-Gilford progeria syndrome. Circulation. 2014;130(1):27–34. - PMC - PubMed
    1. Barrowman J, Wiley PA, Hudon-Miller SE, Hrycyna CA, Michaelis S. Human ZMPSTE24 disease mutations: Residual proteolytic activity correlates with disease severity. Hum Mol Genet. 2012;21(18):4084–4093. - PMC - PubMed

Publication types

MeSH terms