. 2016 Nov 15;113(46):13081-13086.
doi: 10.1073/pnas.1607747113. Epub 2016 Oct 31.

Global environmental drivers of influenza

Affiliations

Global environmental drivers of influenza

Ethan R Deyle et al. Proc Natl Acad Sci U S A. .

Abstract

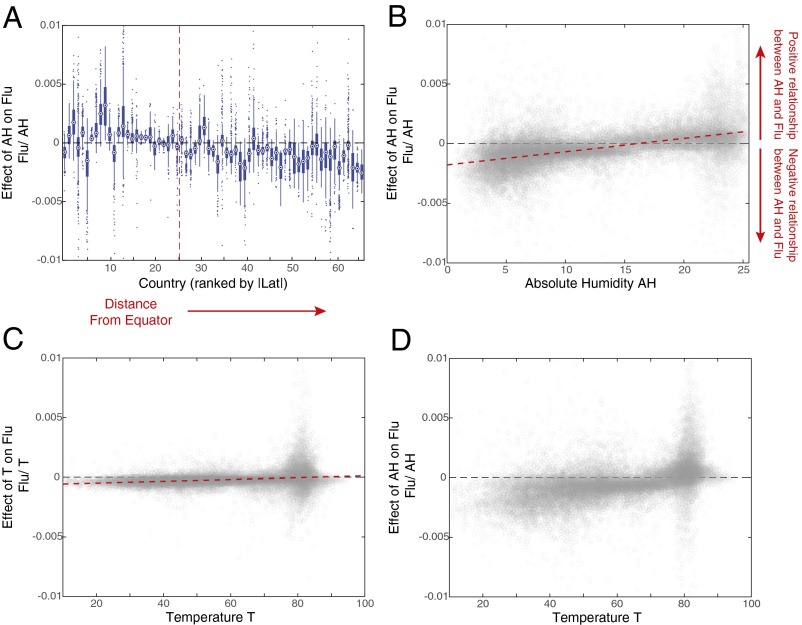
In temperate countries, influenza outbreaks are well correlated to seasonal changes in temperature and absolute humidity. However, tropical countries have much weaker annual climate cycles, and outbreaks show less seasonality and are more difficult to explain with environmental correlations. Here, we use convergent cross mapping, a robust test for causality that does not require correlation, to test alternative hypotheses about the global environmental drivers of influenza outbreaks from country-level epidemic time series. By moving beyond correlation, we show that despite the apparent differences in outbreak patterns between temperate and tropical countries, absolute humidity and, to a lesser extent, temperature drive influenza outbreaks globally. We also find a hypothesized U-shaped relationship between absolute humidity and influenza that is predicted by theory and experiment, but hitherto has not been documented at the population level. The balance between positive and negative effects of absolute humidity appears to be mediated by temperature, and the analysis reveals a key threshold around 75 °F. The results indicate a unified explanation for environmental drivers of influenza that applies globally.

Keywords: empirical dynamic modeling; epidemiology; nonlinear dynamics; physical–biological coupling; state-dependence.


Conflict of interest statement

The authors declare no conflict of interest.

Figures

Fig. 1.
Fig. 1.
Stochastic SIRS model with strongly and weakly seasonal drivers. (A) A strongly periodic environment induces synchrony through dynamical resonance, causing peaks in infection to correlate with seasonal lows in the seasonal environment. (B) If the same SIRS model is driven by a seasonal signal with the same variance, but much weaker seasonality, there is no dynamic resonance, infection peaks show much weaker seasonality, and correlation between infection and environment is much lower.
Fig. 2.
Fig. 2.
Correspondence between seasonality of environment and seasonality of influenza infection. Countries are colored from the least seasonal to most seasonal for absolute humidity (A) and influenza infection (B). The Spearman correlation between the two is high: ρ = 0.73.
Fig. 3.
Fig. 3.
Detecting cross-map causality beyond shared seasonality of environmental drivers on influenza. Red circles show the unlagged cross-map skill (ρCCM) for observed influenza predicting purported seasonal drivers: absolute humidity, temperature, relative humidity, and precipitation. Together with this, box-and-whisker plots show the null distributions for ρCCM expected from random surrogate time series that shares the same seasonality as the true environmental driver. Countries are ordered according to distance from the equator (absolute latitude). Filled circles indicate that the measured ρCCM is significantly better than the null expectation (P ≤ 0.05).
Fig. 4.
Fig. 4.
Forecast improvement with multivariate EDM. Causal effect is demonstrated if EDM forecast skill (ρ) improves when a driver variable is included in the EDM model. This is quantified by Δρ = ρ(with driver) − ρ(without driver), where ρ is the Pearson’s correlation between observations and EDM predictions. Including either absolute humidity (AH) or temperature (T) leads to significant (P < 0.001) improvement in forecast skill both globally (A) and the tropics specifically (B). The significance is more marginal when looking solely at temperate countries (C) (P < 0.07 for AH; P < 0.03 for T). In the tropics, including both (AH +T) is marginally better than either AH or T alone, suggesting possible compound effects of temperature and humidity.
Fig. 5.
Fig. 5.
Scenario exploration with multivariate EDM gives a measure of the effect of environment on influenza infection by predicting the change in influenza (Δflu) that results from a small change in absolute humidity (ΔAH) or temperature (ΔT). Analysis covers countries with at least 208 observations (4 y) and area <1.5 million mi2. (A) Range of values for Δflu/ΔAH for each country across latitude, ordered by distance from equator (SI Appendix, Table S1). Countries closest to the equator tend to show a positive effect of AH on influenza infection, whereas countries furthest from the equator show a negative effect (red line indicates the tropical boundary). (B) Effect of absolute humidity on influenza (Δflu/ΔAH) as a function of AH grouped over all countries. Each point represents the estimated effect from scenario exploration for one historical point in one of the study countries. At low AH (typical of high-latitude countries), AH has a negative effect on influenza infection, whereas at high AH (typical of low-latitude countries), AH has a positive effect on influenza. (C) Effect of temperature on influenza (Δflu/ΔT) as a function of T. Evidence of a single global effect is much weaker, but it suggests there might be important temperature thresholds. (D) How the effect of absolute humidity on influenza (Δflu/ΔAH) changes as a function of T. Additional details given in SI Appendix, Section 5.
Fig. 6.
Fig. 6.
Temperature thresholds in the effect of absolute humidity (ΔAH) on influenza (Δflu). The results of scenario exploration in Fig. 4B are replotted according to temperature. (Left) Values correspond to observations when T was below 75 °F. (Right) Values correspond to observations when T was between 75 °F and 85 °F. The red dashed lines indicate the 0.1 and 0.9 quantile regressions.

Comment in

References

    1. Xie X, Li Y, Chwang ATY, Ho PL, Seto WH. How far droplets can move in indoor environments--Revisiting the Wells evaporation-falling curve. Indoor Air. 2007;17(3):211–225. - PubMed
    1. Lowen AC, Mubareka S, Steel J, Palese P. Influenza virus transmission is dependent on relative humidity and temperature. PLoS Pathog. 2007;3(10):1470–1476. - PMC - PubMed
    1. Shaman J, Kohn M. Absolute humidity modulates influenza survival, transmission, and seasonality. Proc Natl Acad Sci USA. 2009;106(9):3243–3248. - PMC - PubMed
    1. Lofgren E, Fefferman NH, Naumov YN, Gorski J, Naumova EN. Influenza seasonality: Underlying causes and modeling theories. J Virol. 2007;81(11):5429–5436. - PMC - PubMed
    1. Tamerius JD, et al. Environmental predictors of seasonal influenza epidemics across temperate and tropical climates. PLoS Pathog. 2013;9(3):e1003194. - PMC - PubMed