. 2016 Nov 14;213(12):2811-2829.
doi: 10.1084/jem.20160206. Epub 2016 Oct 31.

pMHC affinity controls duration of CD8+ T cell-DC interactions and imprints timing of effector differentiation versus expansion

Affiliations

pMHC affinity controls duration of CD8+ T cell-DC interactions and imprints timing of effector differentiation versus expansion

Aleksandra J Ozga et al. J Exp Med. .

Abstract

During adaptive immune responses, CD8+ T cells with low TCR affinities are released early into the circulation before high-affinity clones become dominant at later time points. How functional avidity maturation is orchestrated in lymphoid tissue and how low-affinity cells contribute to host protection remains unclear. In this study, we used intravital imaging of reactive lymph nodes (LNs) to show that T cells rapidly attached to dendritic cells irrespective of TCR affinity, whereas one day later, the duration of these stable interactions ceased progressively with lowering peptide major histocompatibility complex (pMHC) affinity. This correlated inversely BATF (basic leucine zipper transcription factor, ATF-like) and IRF4 (interferon-regulated factor 4) induction and timing of effector differentiation, as low affinity-primed T cells acquired cytotoxic activity earlier than high affinity-primed ones. After activation, low-affinity effector CD8+ T cells accumulated at efferent lymphatic vessels for egress, whereas high affinity-stimulated CD8+ T cells moved to interfollicular regions in a CXCR3-dependent manner for sustained pMHC stimulation and prolonged expansion. The early release of low-affinity effector T cells led to rapid target cell elimination outside reactive LNs. Our data provide a model for affinity-dependent spatiotemporal orchestration of CD8+ T cell activation inside LNs leading to functional avidity maturation and uncover a role for low-affinity effector T cells during early microbial containment.


Figures

Figure 1.
Figure 1.
TCR affinity controls duration of stable CD8+ T cell–DC interactions in vivo. (A) Experimental layout. T cell–DC interactions in popliteal LNs were analyzed by 2PM in the presence of s.c. peptide-pulsed DCs at the indicated time points after i.v. T cell transfer. (B) Representative 2PM images of OT-I T cell tracks (white lines) or OT-3 T cell tracks (blue lines) in the presence of peptide-pulsed DCs at early (2–10 h) or late (24–32 h) time points after T cell transfer. Arrowheads point to stable (>30 min) OT-I T cell–DC (closed) or OT-3 T cell–DC (open) interactions. Bar, 20 µm. (C and E) Single–T cell speeds at each time point. Polyclonal T cell speeds are included for comparison. Percentages refer to tracks in dashed-line boxes showing single-cell speeds of >7 µm/min. (D and F) T cell–DC interaction times. Each dot represents a single track (C and E) or interaction (D and F). Bars indicate mean (C and E) or median (D and F). (C–F) Data are pooled from at least two independent experiments with four or more mice/eight image sequences per condition and time point. Statistical significance was analyzed for entire datasets by Kruskal-Wallis tests with Dunn’s posttest. *, P < 0.05; **, P < 0.01; ***, P < 0.001.
Figure 2.
Figure 2.
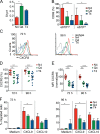
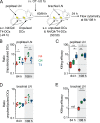
TCR affinity inversely correlates with onset of effector gene expression and cytotoxic activity in vivo. (A) mRNA levels of Batf, Irf4, Gzmb, and Prf1 in divided (e670low) GFP+ OT-I T cells sorted 60 h after transfer into recipient mice that contained N4-, Q4-, or T4-pulsed DCs. Relative mRNA levels were normalized to naive OT-I T cell mRNA levels (set to 1). Fold-changes in mRNA levels are shown as mean ± SEM. Data are representative of two independent experiments with RNA from LNs pooled from two to three mice per condition. (B) Flow cytometry of gzmB-positive OT-I T cells and gzmB MFI 60 h after T cell transfer. Each dot represents data from one mouse. Data are pooled from three independent experiments with a total of 8–11 mice per group. (C) Relative mRNA levels of GzmB and Prf1 in N4-stimulated OT-I T cells at 60 h (as in A) and 108 h after transfer. Data are of one experiment with RNA pooled from LNs of two to three mice per condition. Error bars represent mean ± SEM. (D) Experimental layout of DC elimination assay. (E) Flow cytometry plots gated on CD45.1+ DCs injected 1 d before into mice that contained activated OT-I T cells (readout at 84 and 108 h after OT-I T cell transfer). e670low DCs were pulsed with peptides, and e670hIgh unpulsed DCs (U) were cotransferred as controls. Data are representative of six independent experiments. (F) Ratio of unpulsed DCs to N4-, Q4-, or T4-pulsed DCs recovered from LNs 84 or 108 h after OT-I T cell transfer. Bars show the mean, with each dot representing a single LN. (G) Killing efficacy as assessed by dividing data in F by the percentage of OT-I T cells in reactive LNs. Calculated values were normalized to the N4/DC ratio divided by the 84-h OT-I T cell percentage. The box extends from the 25th to 75th percentile with the median; whiskers indicate upper and lower range. (F and G) Data are pooled from six independent experiments with total of seven mice per condition. Data were analyzed using Kruskal-Wallis tests with Dunn’s posttest (A, B, F, and G) or Student’s t test (C). *, P < 0.05; **, P < 0.01; ***, P < 0.001.
Figure 3.
Figure 3.
TCR affinity determines S1P1, CD69, and CXCR3 expression levels on OT-I T cells. (A and B) mRNA levels of S1pr1 and CD69 expression in e670-labeled GFP+ OT-I T cells 60 h after transfer into recipient C57BL/6 mice that contained N4-, Q4-, or T4-pulsed DCs. Divided OT-I T cells (e670low) were sorted by flow cytometry and analyzed for relative mRNA levels of S1pr1 by RT-qPCR as in Fig. 2 A (A) or stained for CD69 expression on divided and undivided OT-I T cells (B; mean ± SD). (A) Data are representative of two independent experiments with RNA from LNs pooled from two to three mice per condition. (B) Data are pooled from three independent experiments with total of five to six mice per condition. (C–E) OT-I T cells were analyzed for CXCR3 expression by flow cytometry 72 and 96 h after transfer in C57BL/6 mice that contained N4-, Q4-, or T4-pulsed DCs. (C) Representative flow cytometry plots of CXCR3 expression. Data are representative of at least five independent experiments. (D) Percentage of CXCR3+ OT-I T cells. Bars indicate the mean. (E) CXCR3 MFI normalized to CXCR3+ N4-primed OT-I T cells. (D and E) Data are pooled from five to six independent experiments with a total of 10–12 mice. (F) In vitro OT-I T cell migration to CXCL9 and CXCL10 at 72 and 96 h after transfer (mean ± SEM). Data are pooled from two independent experiments with total of four mice per condition. Statistical significance was analyzed by Kruskal-Wallis tests with Dunn’s posttest. *, P < 0.05; **, P < 0.01; ***, P < 0.001.
Figure 4.
Figure 4.
TCR affinity governs OT-I T cell localization during expansion. (A–E) LNs were isolated 24 or 84 h after transfer of 104 GFP+ OT-I T cells into Prf1-deficient mice containing N4-, Q4-, or T4-pulsed DCs and analyzed by SPIM. (A) 3D volume rendering of the HEV network (gray) and GFP+ OT-I T cells (green) at 24 h (only for N4) and 84 h in LNs containing N4-, Q4-, or T4-pulsed DCs. Higher magnification images show OT-I T cell localization in the T cell zone (24-h LNs) or IFRs (84-h LNs; red arrowheads). Bars, 300 µm. Data are representative of three independent experiments with four mice at 84 h and one experiment at 24 h after T cell transfer. (B) Total OT-I T cell numbers per LN 84 h after T cell transfer. (C) 3D quantification scheme of SPIM-generated datasets. Cortical position (Pc), medullary position (Pm), and cortical-medullary position (Pcm), together with the polar angle θ fixed at 20°, were used to subdivide 3D LN renderings into microenvironments as described in Fig. S1. (D) The percentage of total OT-I T cells that was detected within medulla, cortex, T cell zone, and IFRs. (E) Medulla/cortex ratio of OT-I T cells. (B–E) Data are pooled from three independent experiments with total of five to six LNs isolated from total of four mice per condition. (B, D, and E) Each dot represents one LN. Statistical significance was analyzed by Kruskal-Wallis tests with Dunn’s posttest. *, P < 0.05; **, P < 0.01.
Figure 5.
Figure 5.
Successive DC encounters lead to enhanced expansion in a TCR affinity–dependent manner. (A–E) Prf1-deficient mice received s.c. injections of N4-, Q4-, and T4-pulsed DCs, followed by transfer of 104 GFP+ OT-I T cells 1 d later. After 60 h, mice received a second wave of unpulsed or N4-, Q4-, or T4-pulsed DCs. Flow cytometry was performed on day 6. (A) Percentage of FSChigh cells on day 6 after transfer. (B and C) Percentage of CD25+ OT-I T cells (B) and CD25 MFI levels (normalized to unpulsed DC-exposed OT-I T cell values; C). (A–C) Data are pooled from three independent experiments with total of nine mice per condition. (D and E) Percentage (D) and total cell numbers (E) of OT-I T cells on day 6 after a second transfer of unpulsed or peptide-pulsed DCs 60 h after T cell transfer. Data are pooled from two independent experiments with total of six mice per condition. Bars show the mean. Statistical significance was analyzed by Mann-Whitney (A–C) or Kruskal-Wallis tests with Sidak’s posttest (D and E). **, P < 0.01; ***, P < 0.001.
Figure 6.
Figure 6.
CXCR63 is required for efficient signal integration from successive DC encounters. (A–C) GFP+ CXCR3+/+ or CXCR3−/− OT-I T cells (104/mouse) were transferred into Prf1-deficient mice that contained N4-pulsed DCs. At 84 h after T cell transfer, LNs were isolated and analyzed by SPIM. (A) 3D volume rendering of LYVE-1+ lymphatic vessel network (red) and GFP+ CXCR3+/+ or CXCR3−/− OT-I T cells (green). Higher magnification images show the indicated IFRs (red arrowheads). Bars, 300 µm. Data are representative of two independent experiments with two mice. (B and C) Medulla/cortex ratio (B) and percentage of CXCR3+/+ and CXCR3−/− OT-I T cells in IFRs over total cell number (C). Data are pooled from at least two independent experiments with total of 7–10 LNs isolated from four to six mice per condition. CXCR3+/+ OT-I data are taken from Fig. 4 (D and E). (D) Percentage of FSChigh cells on day 6 after transfer. (E and F) Percentage of CD25+ OT-I T cells (E) and CD25 MFI levels (normalized to unpulsed DC-primed CXCR3+/+ OT-I T cell values; F). (G) Percentage of OT-I T cells on day 6 after a second transfer of unpulsed or N4-pulsed DCs 60 h after T cell transfer as in Fig. 5. (D–G) Data are pooled from three independent experiments with total of 8–12 LNs isolated from four to six mice per condition. (B–G) Bars show the mean, and dots represent data from individual LNs. Statistical significance was analyzed by Student’s t tests. *, P < 0.05; **, P < 0.01.
Figure 7.
Figure 7.
Low affinity–primed T cells contribute to early elimination of target cells outside lymphoid priming tissue. (A) Prf1-deficient mice received s.c. injections of N4-, Q4-, and T4-pulsed DCs into hind and unpulsed DCs into front footpads, followed by i.v. transfer of 104 GFP+ OT-I T cells 24 h later. At 60 or 84 h after T cell transfer, mice received a second injection of mixed fluorescently labeled unpulsed and N4-, Q4-, or T4-pulsed DCs into hind and front footpads. Draining reactive popliteal and nonreactive brachial LNs were isolated 24 h later to determine DC elimination as in Fig. 2. (B and C) Ratio of unpulsed and pulsed DCs (B) and per-cell killing efficacy (C) in popliteal LNs at 84 and 108 h after T cell transfer. (D and E) Ratio of unpulsed and pulsed DCs at 84 and 108 h (D) and per-cell killing efficacy (E) in brachial LNs at 84 h after T cell transfer. (B–E) Data are pooled from two independent experiments with total of five to eight LNs isolated from three to four mice per condition. Statistical significance was analyzed by Kruskal-Wallis tests with Dunn’s posttest. *, P < 0.05; **, P < 0.01; ***, P < 0.001.
Figure 8.
Figure 8.
Low-affinity T cells show reduced expression of CXCR3 and CD69 but increased gzmB at viral infection onset and contribute to early host protection. (A) Experimental layout of systemic LCMV-OVA infection. (B–D) Percent positive and normalized MFI of CD69 (B), CXCR3 (C), and GzmB (D) expression of OT-I and OT-3 T cells at 48 h p.i. Data are pooled from three to four independent experiments with a total of 9–12 mice per condition. Statistical significance was analyzed by paired Student’s t tests. (E) Experimental layout of local HSVTOM-OVA skin infection. (F) Viral titers (as determined by PFU/gram of tissue) in skin tissue of Prf1-deficient mice that had not received T cells versus recipients of 5 × 10⁴ or 5 ×10⁵ OT-I and OT-3 T cells. Data are pooled from three independent experiments with five to nine mice total (for no cells and 5 × 10⁵ T cell recipients) and one experiment (5 × 10⁴ T cell recipients) with four mice. Each point represents one skin biopsy. Bars indicate the median. Statistical significance was analyzed using a Kruskal-Wallis test against no cells with Dunn’s posttest. *, P < 0.05; **, P < 0.01; ***, P < 0.001.

References

    1. Abe J., Ozga A.J., Swoger J., Sharpe J., Ripoll J., and Stein J.V.. 2016. Light sheet fluorescence microscopy for in situ cell interaction analysis in mouse lymph nodes. J. Immunol. Methods. 431:1–10. 10.1016/j.jim.2016.01.015 - DOI - PubMed
    1. Altan-Bonnet G., and Germain R.N.. 2005. Modeling T cell antigen discrimination based on feedback control of digital ERK responses. PLoS Biol. 3:e356 10.1371/journal.pbio.0030356 - DOI - PMC - PubMed
    1. Ariotti S., Beltman J.B., Borsje R., Hoekstra M.E., Halford W.P., Haanen J.B.A.G., de Boer R.J., and Schumacher T.N.M.. 2015. Subtle CXCR3-dependent chemotaxis of CTLs within infected tissue allows efficient target localization. J. Immunol. 195:5285–5295. 10.4049/jimmunol.1500853 - DOI - PubMed
    1. Bedoui S., Whitney P.G., Waithman J., Eidsmo L., Wakim L., Caminschi I., Allan R.S., Wojtasiak M., Shortman K., Carbone F.R., et al. . 2009. Cross-presentation of viral and self antigens by skin-derived CD103+ dendritic cells. Nat. Immunol. 10:488–495. 10.1038/ni.1724 - DOI - PubMed
    1. Blanchfield J.L., Shorter S.K., and Evavold B.D.. 2013. Monitoring the dynamics of T cell clonal diversity using recombinant peptide:MHC technology. Front. Immunol. 4:170 10.3389/fimmu.2013.00170 - DOI - PMC - PubMed

Publication types

MeSH terms