. 2016 Oct 21;3(5):ENEURO.0130-16.2016.
doi: 10.1523/ENEURO.0130-16.2016. eCollection 2016 Sep-Oct.

Loss of SynDIG1 Reduces Excitatory Synapse Maturation But Not Formation In Vivo

Affiliations

Loss of SynDIG1 Reduces Excitatory Synapse Maturation But Not Formation In Vivo

George Chenaux et al. eNeuro. .

Abstract

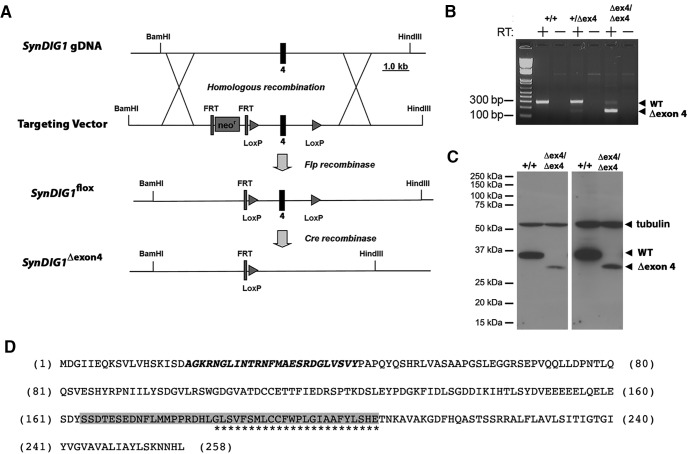
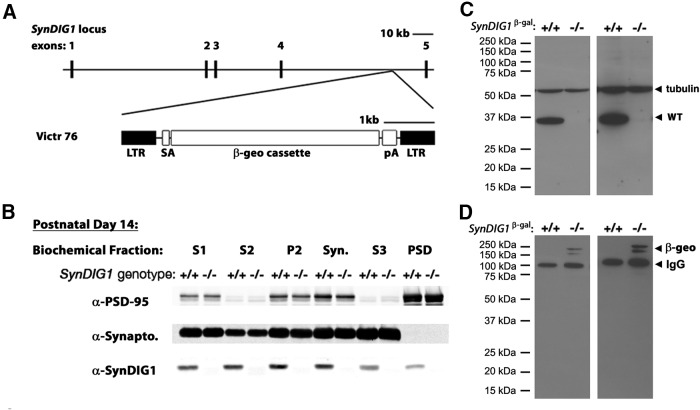
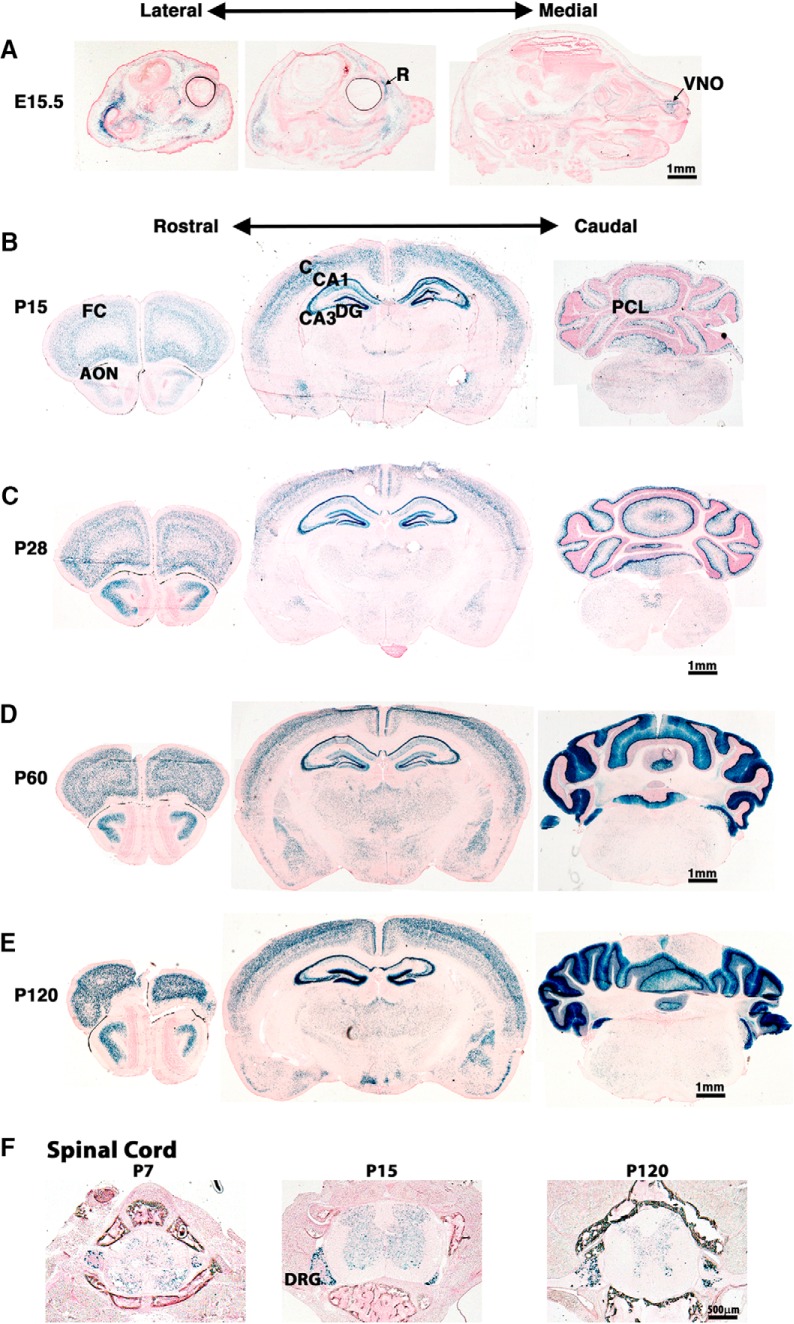
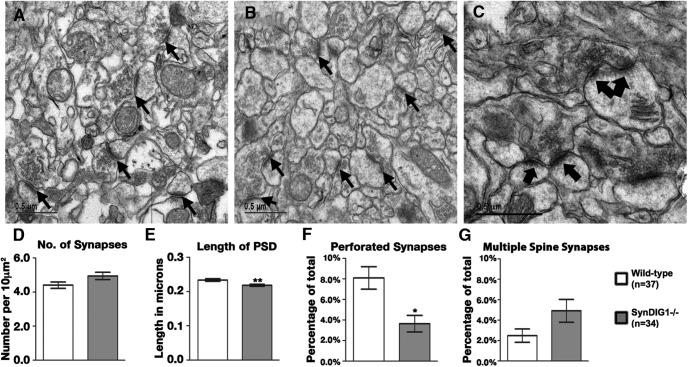
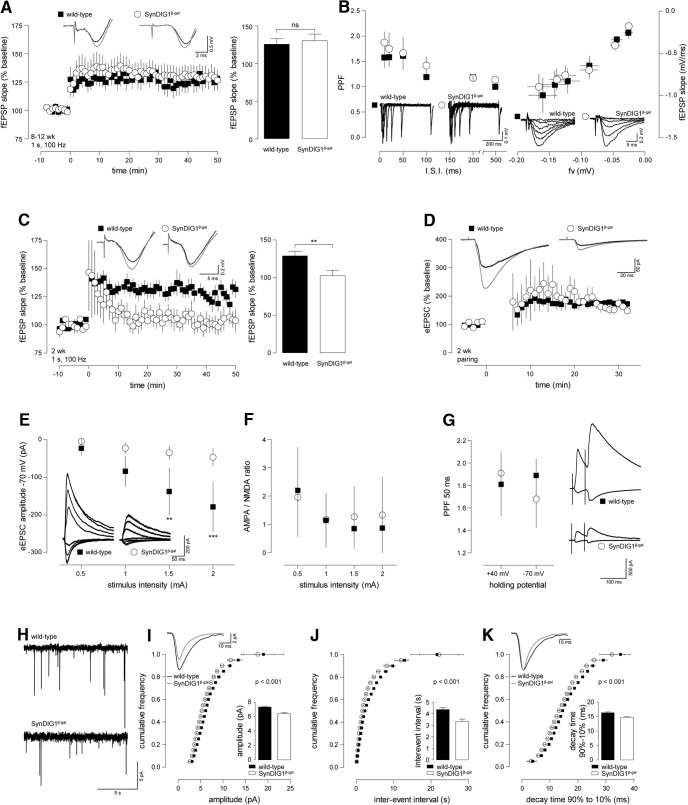
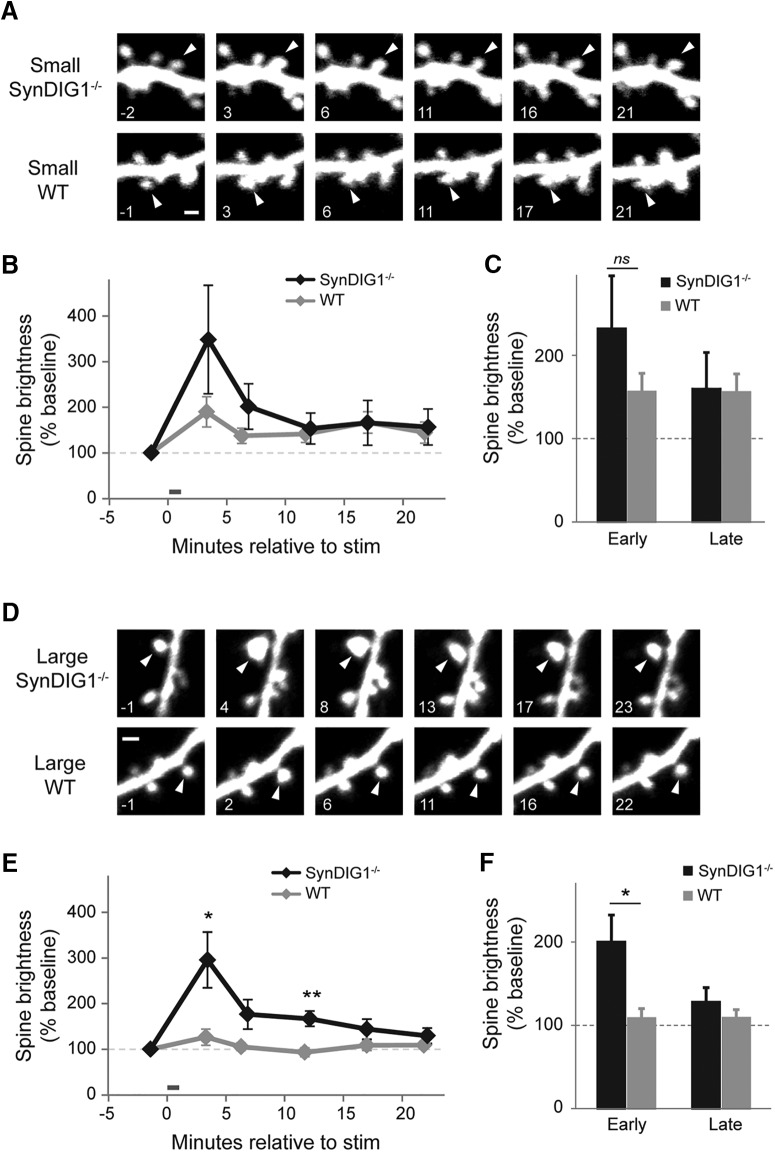
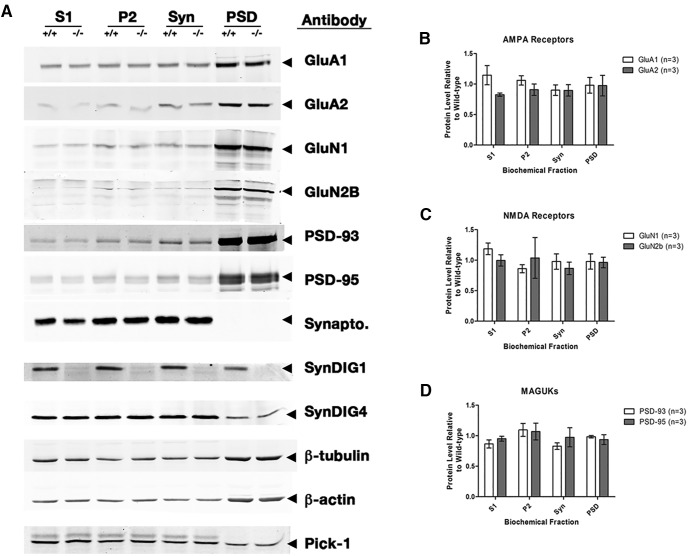
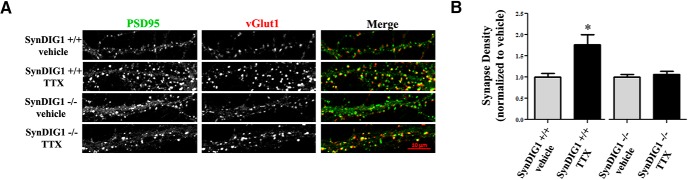
Modification of the strength of excitatory synaptic connections is a fundamental mechanism by which neural circuits are refined during development and learning. Synapse Differentiation Induced Gene 1 (SynDIG1) has been shown to play a key role in regulating synaptic strength in vitro. Here, we investigated the role of SynDIG1 in vivo in mice with a disruption of the SynDIG1 gene rather than use an alternate loxP-flanked conditional mutant that we find retains a partial protein product. The gene-trap insertion with a reporter cassette mutant mice shows that the SynDIG1 promoter is active during embryogenesis in the retina with some activity in the brain, and postnatally in the mouse hippocampus, cortex, hindbrain, and spinal cord. Ultrastructural analysis of the hippocampal CA1 region shows a decrease in the average PSD length of synapses and a decrease in the number of synapses with a mature phenotype. Intriguingly, the total synapse number appears to be increased in SynDIG1 mutant mice. Electrophysiological analyses show a decrease in AMPA and NMDA receptor function in SynDIG1-deficient hippocampal neurons. Glutamate stimulation of individual dendritic spines in hippocampal slices from SynDIG1-deficient mice reveals increased short-term structural plasticity. Notably, the overall levels of PSD-95 or glutamate receptors enriched in postsynaptic biochemical fractions remain unaltered; however, activity-dependent synapse development is strongly compromised upon the loss of SynDIG1, supporting its importance for excitatory synapse maturation. Together, these data are consistent with a model in which SynDIG1 regulates the maturation of excitatory synapse structure and function in the mouse hippocampus in vivo.

Keywords: AMPA receptor; SynDIG1; excitatory synapse; hippocampus; synapse development; synapse maturation.


Figures

Figure 1.
Figure 1.
Characterization of a conditional SynDIG1flox allele. A, Schematic of the conditional SynDIG1flox allele, which results in the removal of exon 4 (SynDIG1Δexon4) upon exposure to Cre recombinase. B, RT-PCR using purified tissue RNA from brain tissue of SynDIG1 wild-type (+/+), heterozygous (+/Δex4), and homozygous (Δex4/Δex4) mutant brains generated by crossing with Nes-cre transgenic mice detects the presence or absence of an mRNA lacking exon 4. A forward primer in exon 3 and a reverse primer in exon 5 produce a 295 or 138 bp product, respectively, in transcripts containing or lacking exon 4. Arrowheads indicate positions of WT and exon 4 lacking mutant products. Note that (+) refers to the unmodified unfloxed SynDIG1 allele. C, Chemiluminescence immunoblot to detect SynDIG1 expression in brain lysates from wild type (+/+) and homozygous (Δex4/Δex4) mutant animals generated by crossing with CMV-cre transgenic mice detects the presence or absence of SynDIG1 protein lacking amino acids encoded by exon 4. Arrowheads indicate full-length protein (WT), mutant protein (Δexon4), and tubulin (loading control) at 2 min (left) and 4 h (right) exposure times. Note that (+) refers to the unmodified unfloxed SynDIG1 allele. D, Amino acid sequence of full-length SynDIG1 protein. The epitope recognized by the anti-SynDIG1 antibody is within the region and is shown in bold italic type. Transmembrane amino acids are indicated by asterisks. Amino acids encoded by exon 4 that are eliminated in SynDIG1Δexon4 upon exposure to Cre recombinase are highlighted in gray.
Figure 2.
Figure 2.
Characterization of SynDIG1 β-gal mutant mice. A, Schematic of mouse SynDIG1 locus showing the insertion site of the β-geo cassette between exon 4 and exon 5 to create SynDIG1 β-gal homozygous mutant mice. SynDIG1 expression is disrupted and replaced with β-gal expression. SA, Splice acceptor; pA, synthetic polyA signal/transcriptional blocker; LTR, viral long-terminal repeat segment. B, Immunoblots of biochemical fractions from P14 wild-type (+/+) and SynDIG1 β-gal homozygous mutant (−/−) mice using a LI-COR system. Fractions loaded are S1-, S2-, P2-, Syn-, S3-, and PSD-enriched fractions. As a control for the biochemical fractionation, PSD-95 is enriched in the PSD fraction and de-enriched in S2 and S3 while synaptophysin (Synapto) is absent from PSD and enriched in S3. Note that (+) refers to the unmodified SynDIG1 allele. C, Chemiluminescence immunoblot to detect SynDIG1 expression in brain lysates from wild-type (+/+) and SynDIG1 β-gal homozygous mutant (−/−) mice. Arrowheads indicate full-length protein and tubulin (loading control) at 2 min (left) and 4 h (right) exposure times. Note that (+) refers to the unmodified SynDIG1 allele. D, Chemiluminescence immunoblot to detect β-geo reactivity in brain lysates from WT (+/+) and homozygous (−/−) mutant mice. Arrowheads indicate bands for β-geo and mouse IgG (recognized by secondary antibody) at 2 min (left) and 4 h (right) exposure times. Note that (+) refers to the unmodified SynDIG1 allele.
Figure 3.
Figure 3.
Expression profile of SynDIG1 reporter in the developing mouse brain. A, Sagittal sections from the entire head of E15.5 SynDIG1 β-gal homozygous mutant mouse show β-gal reporter activity (blue) within the retina (R) and vomeronasal organ (VNO), but little β-gal activity in the brain. B–E, Coronal sections of P15 (B), P28 (C), P60 (D), and P120 (E) mutant mouse brains show β-gal expression in the CA1, CA3, and DG in the hippocampus; in the PCL of the cerebellum; in the frontal cortex (FC); in the AON; and in the cortex (C). Scale bars, 1 mm. F, Cross sections of P7, P15, and P120 vertebrae show β-gal expression in the dorsal root ganglia (DRG) and within the spinal cord. Scale bar, 500 nm. All sections are counterstained with nuclear fast red.
Figure 4.
Figure 4.
Synapse ultrastructure is altered in SynDIG1 mutant mice. A, B, Representative electron micrographs from the CA1 region of the hippocampus from P56 WT (A) and SynDIG1 β-gal homozygous mutant littermates (B). Example synapses are indicated by black arrows. C, Higher-magnification image from WT mouse hippocampus illustrating a stereotypical perforated synapse (conjoined black arrows) and multiple spine synapses (two separated arrows). Scale bar, 0.5 µm. D–G, Quantification of multiple images (WT, n = 37; SynDIG1 β-gal homozygous mutant, n = 34) reveal a trend toward increased synapse number (WT, 4.40 synapses/10 µm2; mutant, 4.94 synapses/10 μm2; p = 0.057; D), a statistically significant decrease in average PSD length (WT, 0.233 µm; SynDIG1 β-gal homozygous mutant, 0.218 µm; p = 0.016; E), a statistically significant decrease in the number of perforated synapses (WT, 8.10% perforated synapses; SynDIG1 β-gal homozygous mutant, 3.65% perforated synapses; p = 0.002; F), and a trend toward an increased number of multiple spine synapses (WT, 2.49% multiple spine synapses; SynDIG1 β-gal homozygous mutant, 4.92% multiple spine synapses; p = 0.059; G) in SynDIG1 β-gal homozygous mutant mice compared with WT. Error bars represent the SEM.
Figure 5.
Figure 5.
Synaptic transmission and plasticity is disturbed in 2-week-old but not in adult SynDIG1 β-gal mutant mice. Acute brain slices from SynDIG1 β-gal homozygous mutant (○, SynDIG1 β-gal) and litter-matched WT controls (▪) were used to record Schaffer collateral LTP and whole-cell patch-clamp experiments on CA1 pyramidal cells. A, fEPSP recorded in slices from 8- to 12-week-old mice. SynDIG1 β-gal homozygous mutant and WT controls showed significant LTP after a 1 s 100 Hz tetanic stimulation. The level of potentiation was not different between the genotypes (WT: baseline, 99.6 ± 0.8%; LTP, 125.6 ± 7.6%; p < 0.05 vs baseline; n = 12; SynDIG1 β-gal homozygous mutant: baseline, 100.5 ± 0.4%; LTP, 130.2 ± 8.9%; p < 0.01 vs baseline; n = 13). Insets at top show traces from representative recordings before and after (gray traces) tetanization. The left panel shows averaged time courses of all experiments with traces from representative recordings on top. Statistics are illustrated in the bar diagram on the right. B, SynDIG1 β-gal homozygous mutant mice displayed normal PPF (left) and IOR (right) when compared with WT animals. Insets beneath data points show representative recordings. C, fEPSP recorded from 2-week-old mice. A 1 s 100 Hz tetanus leads to potentiation of fEPSP in WT [baseline, 99.9 ± 0.9%; LTP, 128.3 ± 6.7%; p < 0.001 (WT baseline vs LTP); n = 10] but not SynDIG1 β-gal homozygous mutant mice [baseline, 99.4 ± 0.5%; LTP, 102.6 ± 7.0%; p < 0.01 (SynDIG1 β-gal homozygous mutant vs WT LTP); n = 6]. The left panel shows the averaged time courses of all experiments with traces from representative recordings at the top. Statistics are illustrated in the bar diagram on the right. D, Pairing-induced LTP of evoked EPSC (eEPSC) in hippocampal slices of 2-week-old animals was normal in SynDIG1β-gal (baseline, 99.4 ± 0.6%; LTP, 168.5 ± 15.4%; p < 0.001 vs baseline; n = 3) compared with WT mice (baseline, 100.1 ± 0.04%; LTP, 175.7 ± 10.6%; p < 0.001 vs baseline; n = 4). Insets at the top show traces from representative recordings before and after (gray traces) pairing. E, EPSCs were evoked by increasing stimulus intensities recorded at holding potentials of −70 and +40 mV. At a holding potential of −40 mV, eEPSC amplitudes were significantly higher in WT mice than in SynDIG1β-gal mutants [stimulus intensity (si) = 0.5 mA, −22.8 ± 19.3 pA; si = 1 mA, −84.2 ± 40.1 pA; si = 1.5 mA, −137.9 ± 62.4 pA; si = 2 mA, −179.8 ± 66.6 pA; n = 9; SynDIG1β-gal; si = 0.5 mA, −4.7 ± 1.2 pA; si = 1 mA, −22.5 ± 15.6 pA; si = 1.5 mA, −34.6 ± 17.6 pA; si = 2 mA, −46.6 ± 23.1 pA; n = 4; two-way ANOVA and Bonferroni’s post-test: F(1,44) = 35.4; 1.5 pA, p < 0.01; 2 pA, p < 0.001]. Insets at the bottom show traces from representative recordings. F, The AMPAR/NMDAR ratio did not differ between WT and SynDIG1β-gal in the recordings from E for all stimulus intensities. G, No difference was found in PPF (50 ms interstimulus interval) between WT and SynDIG1β-gal. Insets on the right show traces from representative recordings. H, Sample recordings of mEPSCs recorded from CA1 pyramidal neurons in acute slices of 2-week-old WT and SynDIG1 β-gal homozygous mutant mice. I–K, Cumulative histograms show significant reduction in amplitude (I), interevent interval (J), and decay time (K) of mEPSC recorded in SynDIG1 β-gal homozygous mutant compared with WT mice (bin size, 0.5; t tests for each binned data point). Inset at top contains traces averaged from all mEPSCs of one representative experiment for each genotype drawn to scale (I) and normalized to peak (K). Averages are shown in bar diagrams at the bottom (amplitude: WT, 7.3 ± 0.1 pA, n = 8; SynDIG1 β-gal homozygous mutant, 6.4 ± 0.1 pA, n = 6. Interevent interval: WT, 4.3 ± 0.2 s; SynDIG1 β-gal homozygous mutant, 3.3 ± 0.2 ms. Decay time: WT, 16.4 ± 0.3 ms; SynDIG1 β-gal homozygous mutant, 14.7 ± 0.3 ms).
Figure 6.
Figure 6.
SynDIG1 limits early-phase structural plasticity in large spines. A, Representative images illustrating small stimulated spines (arrowheads) on EGFP-expressing neurons from SynDIG1 β-gal homozygous mutant neurons (top) and neurons from WT mice (bottom). Time stamps are in minutes relative to LTP stimulation. Small spines are defined as <85% of average neighbor brightness. Scale bar, 1 µm. B, Time course of small spine structural plasticity. There are no significance differences between genotypes (WT, n = 14 stimulated target spines on 14 cells; SynDIG1 β-gal homozygous mutant, n = 13 stimulated target spines on 13 cells; p > 0.2 for all comparisons). Error bars indicate ±SEM. C, The average early (<15 min after stimulation) and late (>15 min after stimulation) change in small spine brightness by genotype. There are no significant differences between genotypes (p > 0.4 for all comparisons). Error bars represent ±SEM. D, Representative images illustrating large stimulated target spines (arrowheads) on EGFP-expressing neurons from SynDIG1 β-gal homozygous mutant neurons (top) and WT neurons (bottom). Time stamps are in minutes relative to LTP stimulation. Large spines are defined as >85% of average neighbor brightness. Scale bar, 1 µm. E, Time course of large spine structural plasticity. Large stimulated spines on WT neurons did not enlarge after stimulation (black line; n = 8 spines on 8 cells). Large stimulated spines on SynDIG1 β-gal homozygous mutant neurons enlarged significantly 3 and 12 min after stimulation (gray line; n = 7 spines on 7 cells; p < 0.05). Error bars represent the SEM. F, The average early (<15 min after stimulation) and late (>15 min after stimulation) change in large spine brightness by genotype. Large stimulated spines on SynDIG1 β-gal homozygous mutant neurons enlarged significantly more than those of WT neurons during early-phase, but not late-phase, structural plasticity (p < 0.05). Error bars represent ±SEM.
Figure 7.
Figure 7.
Synapse composition is unaltered in SynDIG1-deficient synapses. A, Representative immunoblots of biochemical fractions isolated from WT and SynDIG1 β-gal homozygous mutant P14 mouse brain tissue showing levels of GluA1, GluA2, GluN1, GluN2B, PSD-93, PSD-95, synaptophysin (Synapto), SynDIG1, SynDIG4, and PICK-1 present in the S1-, P2-, Syn-, and PSD-enriched fractions. Loading controls are provided by β-actin and β-tubulin immunoreactivity. B–D, Graphs depict the ratio of SynDIG1 β-gal homozygous mutant protein relative to WT levels of AMPA receptor subunits (B), NMDA receptor subunits (C), and PSD-93 and PSD-95 (D) in the PSD-enriched fractions. Data are the average of three independent biochemical fractionation experiments; each experiment used four to six mouse brains of each genotype. Error bars represent ±SEM.
Figure 8.
Figure 8.
Activity-dependent synapse development was abolished upon the loss of SynDIG1. A, Loss of SynDIG1 inhibits activity-dependent excitatory synapse development. Immunostaining of PSD-95 (green) and presynaptic VGluT1 (red) proteins is shown. Dissociated hippocampal neurons from SynDIG1 β-gal homozygous mutant (−/−) or WT (+/+) mice were treated with vehicle (DMSO) or TTX (2 μm) at 12 DIV, fixed, and stained at 14 DIV. Synapses are defined as the overlap of presynaptic and postsynaptic clusters. Scale bar, 10 μm. B, Graph depicts the density of PSD-95/VGluT1 colocalized puncta. Normalized values relative to untreated cells are shown for the average of two independent experiments (n = 20-30 cells/condition). Error bars represent ±SEM. *p < 0.05.

Similar articles

Cited by

References

    1. Bosch M, Castro J, Saneyoshi T, Matsuno H, Sur M, Hayashi Y (2014) Structural and molecular remodeling of dendritic spine substructures during long-term potentiation. Neuron 82:444–459. 10.1016/j.neuron.2014.03.021 - DOI - PMC - PubMed
    1. Bredt DS, Nicoll RA (2003) AMPA Receptor Trafficking at Excitatory Synapses. Neuron 40:361–379. - PubMed
    1. Calverley RK, Jones DG (1990) Contributions of dendritic spines and perforated synapses to synaptic plasticity. Brain Res Brain Res Rev 15:215–249. - PubMed
    1. Chen L, Tracy T, Nam CI (2007) Dynamics of postsynaptic glutamate receptor targeting. Curr Opin Neurobiol 17:53–58. 10.1016/j.conb.2006.11.001 - DOI - PubMed
    1. Colgan LA, Yasuda R (2014) Plasticity of dendritic spines: subcompartmentalization of signaling. Annu Rev Physiol 76:365–385. 10.1146/annurev-physiol-021113-170400 - DOI - PMC - PubMed

Publication types

MeSH terms