. 2016 Oct 25;17(Suppl 8):802.
doi: 10.1186/s12864-016-3063-x.

Computational workflow for the fine-grained analysis of metagenomic samples

Affiliations

Computational workflow for the fine-grained analysis of metagenomic samples

Esteban Pérez-Wohlfeil et al. BMC Genomics. .

Abstract

Background: The field of metagenomics, defined as the direct genetic analysis of uncultured samples of genomes contained within an environmental sample, is gaining increasing popularity. The aim of studies of metagenomics is to determine the species present in an environmental community and identify changes in the abundance of species under different conditions. Current metagenomic analysis software faces bottlenecks due to the high computational load required to analyze complex samples.

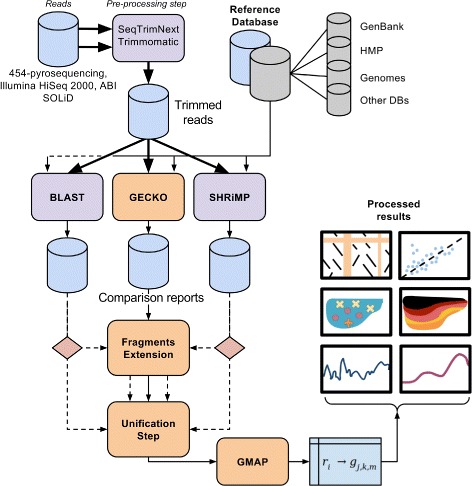
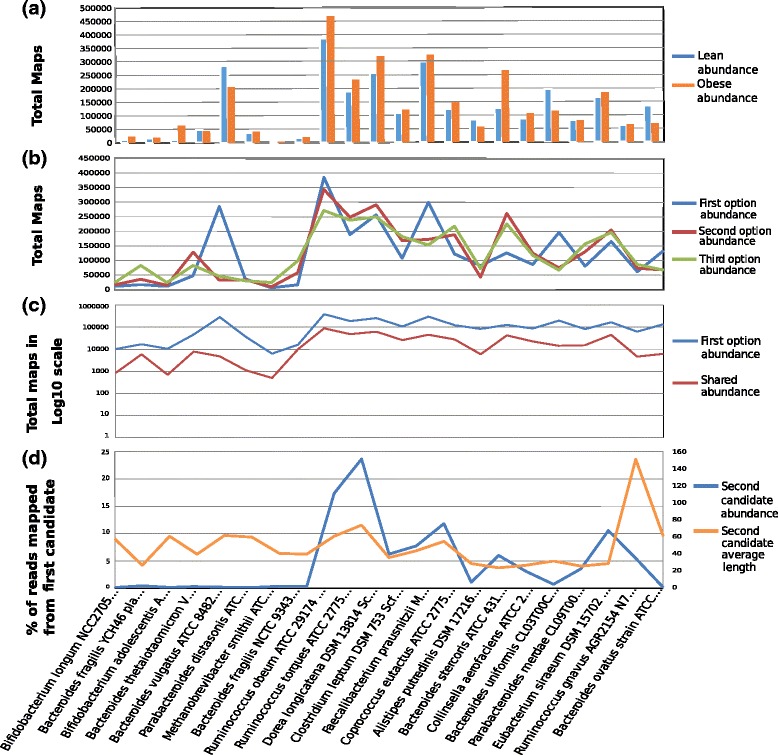
Results: A computational open-source workflow has been developed for the detailed analysis of metagenomes. This workflow provides new tools and datafile specifications that facilitate the identification of differences in abundance of reads assigned to taxa (mapping), enables the detection of reads of low-abundance bacteria (producing evidence of their presence), provides new concepts for filtering spurious matches, etc. Innovative visualization ideas for improved display of metagenomic diversity are also proposed to better understand how reads are mapped to taxa. Illustrative examples are provided based on the study of two collections of metagenomes from faecal microbial communities of adult female monozygotic and dizygotic twin pairs concordant for leanness or obesity and their mothers.

Conclusions: The proposed workflow provides an open environment that offers the opportunity to perform the mapping process using different reference databases. Additionally, this workflow shows the specifications of the mapping process and datafile formats to facilitate the development of new plugins for further post-processing. This open and extensible platform has been designed with the aim of enabling in-depth analysis of metagenomic samples and better understanding of the underlying biological processes.

Keywords: Annotational mapping; Differential abundance; Mapping over specific regions; Metagenome analysis; Open platform.


Figures

Fig. 1
Fig. 1
The Workflow diagram. Top: Quality control layer and input files. Center: Comparison software layer. Bottom: Mapping kernel (GMAP), which provides open-source datafile definitions and enables many on-demand post-processing experiments (Right)
Fig. 2
Fig. 2
Three-options mapping analysis. Some data from GMAP-based mapping analysis. a Abundance plot for the averaged Lean (blue) and Obese (orange) metagenomes of the most read-abundance genomes. The plot depicts total mapped reads per specie in the two averaged metagenomes. b Three-option abundance by organism. In blue, total first option abundance, (number of reads assigned). In red and green, the number of times an organism was the second and third best candidate for a read. Bacteria with red or green peaks reveal that another organism is probably hiding them (regarding abundance) and there is not a direct consensus. c Total reads assigned in log10 scale per species as best candidate (first option, blue) and from that total, the number of reads that had two very similar candidates (defined as a distance in terms of identity, length and coverage) from the second best candidate (in red). d An exhaustive-one-vs-all user-defined analysis where a bacterium is compared against all species in the database. The peak in the plot (near the middle) is the analyzed genome, Ruminococcus obeum ATCC 29,174. This particular scenario depicts a comparison of the target genome against all species by length and abundance. In blue, the percentage of reads that were mapped as second candidate when the best candidate was the target genome. In orange, the average length of such mapped reads
Fig. 3
Fig. 3
Genome-specific experiments. Some of the results oriented at a genome-specific-level. a DNA-seq differential expression plot. Each point represents an annotated region for a particular genome. In the x-axis and y-axis, the percentage of reads that are mapped to each annotated region divided by the total mapped reads. b Accumulated reads mapped onto each position of the genome smoothed using a window of size 10000. In the x-axis, the genome bases from 1 to a portion of its length. In the y-axis, absolute accumulated number of reads mapped. c This plot shows how proteins found by searching with annotated (Left) and non annotated (Right) reads accumulate along similarity and length. The annotated search depicts higher length and similarity matches, resembling Sanders curve (reference in the main text), whereas non-annotated search shows mostly non significant matches. d Annotation mapping. This plot shows reads mapped to a particular genome distributed by annotation properties. The three groups are plotted in different colours and shapes, namely a orange crosses for unannotated reads, b yellow crosses for semi-annotated reads and c purple points for fully-annotated reads. The background grey area represents the accumulation of reads for the whole mapped metagenome in logarithmic scale; thus, darker areas represent higher accumulation
Fig. 4
Fig. 4
MEGAN and MG Workflow comparison. Comparative analysis for the lean metagenome shows similar mapping abundances. a Abundance plot by species in percentages. b Total reads assigned by each method and total number of reads in the metagenome. c Abundance chart by family (except Actinobacteria, shown as Phylum)

References

    1. Huson DH, Weber N. Microbial community analysis using MEGAN. Methods Enzymol. 2012;531:465–85. doi: 10.1016/B978-0-12-407863-5.00021-6. - DOI - PubMed
    1. Meyer F, et al. The metagenomics RAST server–a public resource for the automatic phylogenetic and functional analysis of metagenomes. BMC Bioinforma. 2008;9(1):386. doi: 10.1186/1471-2105-9-386. - DOI - PMC - PubMed
    1. Hunter S, et al. EBI metagenomics—a new resource for the analysis and archiving of metagenomic data. Nucleic Acids Res. 2014;42(D1):D600–D6. doi: 10.1093/nar/gkt961. - DOI - PMC - PubMed
    1. Altschul SF, et al. Gapped BLAST and PSI-BLAST: a new generation of protein database search programs. Nucleic Acids Res. 1997;25(17):3389–402. doi: 10.1093/nar/25.17.3389. - DOI - PMC - PubMed
    1. Caporaso GJ, et al. QIIME allows analysis of high-throughput community sequencing data. Nat Methods. 2010;7(5):335–6. doi: 10.1038/nmeth.f.303. - DOI - PMC - PubMed

Publication types